Figures from the monitoring report
On this page, you will find all the charts and figures from the monitoring report “Renewable Energy in Transport”, clearly organised by chapter. You can use the chapter overview to go directly to the section you require. If you would like to download all the figures and charts together, please use the download button below.
Chapter selection
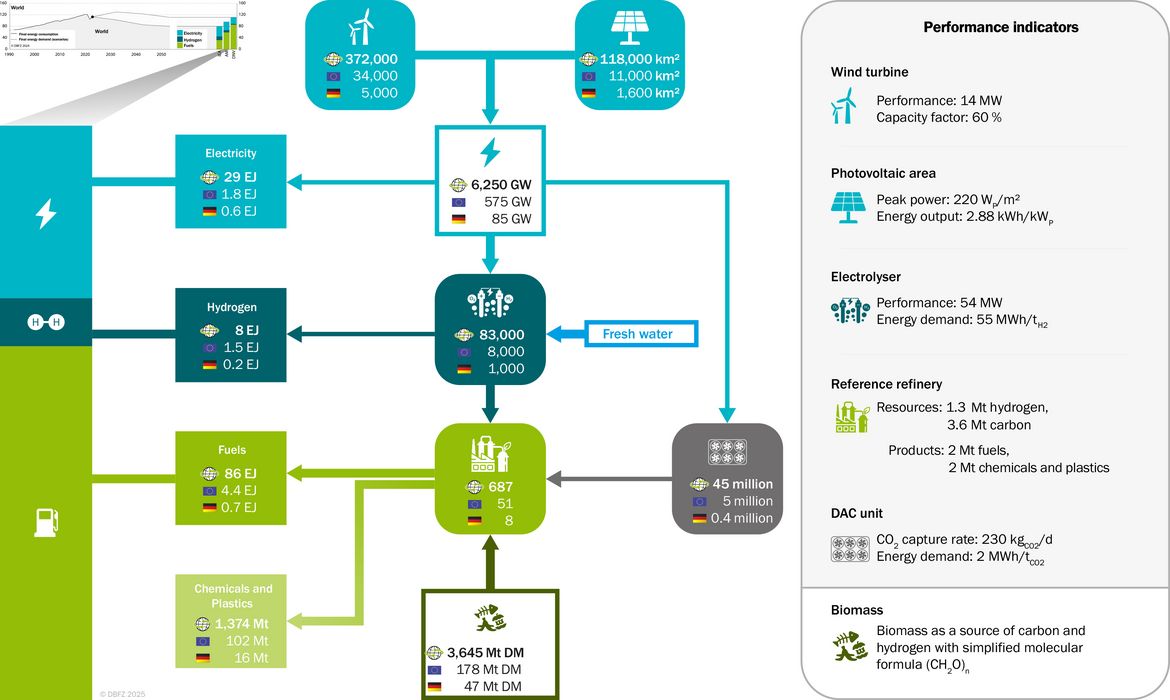
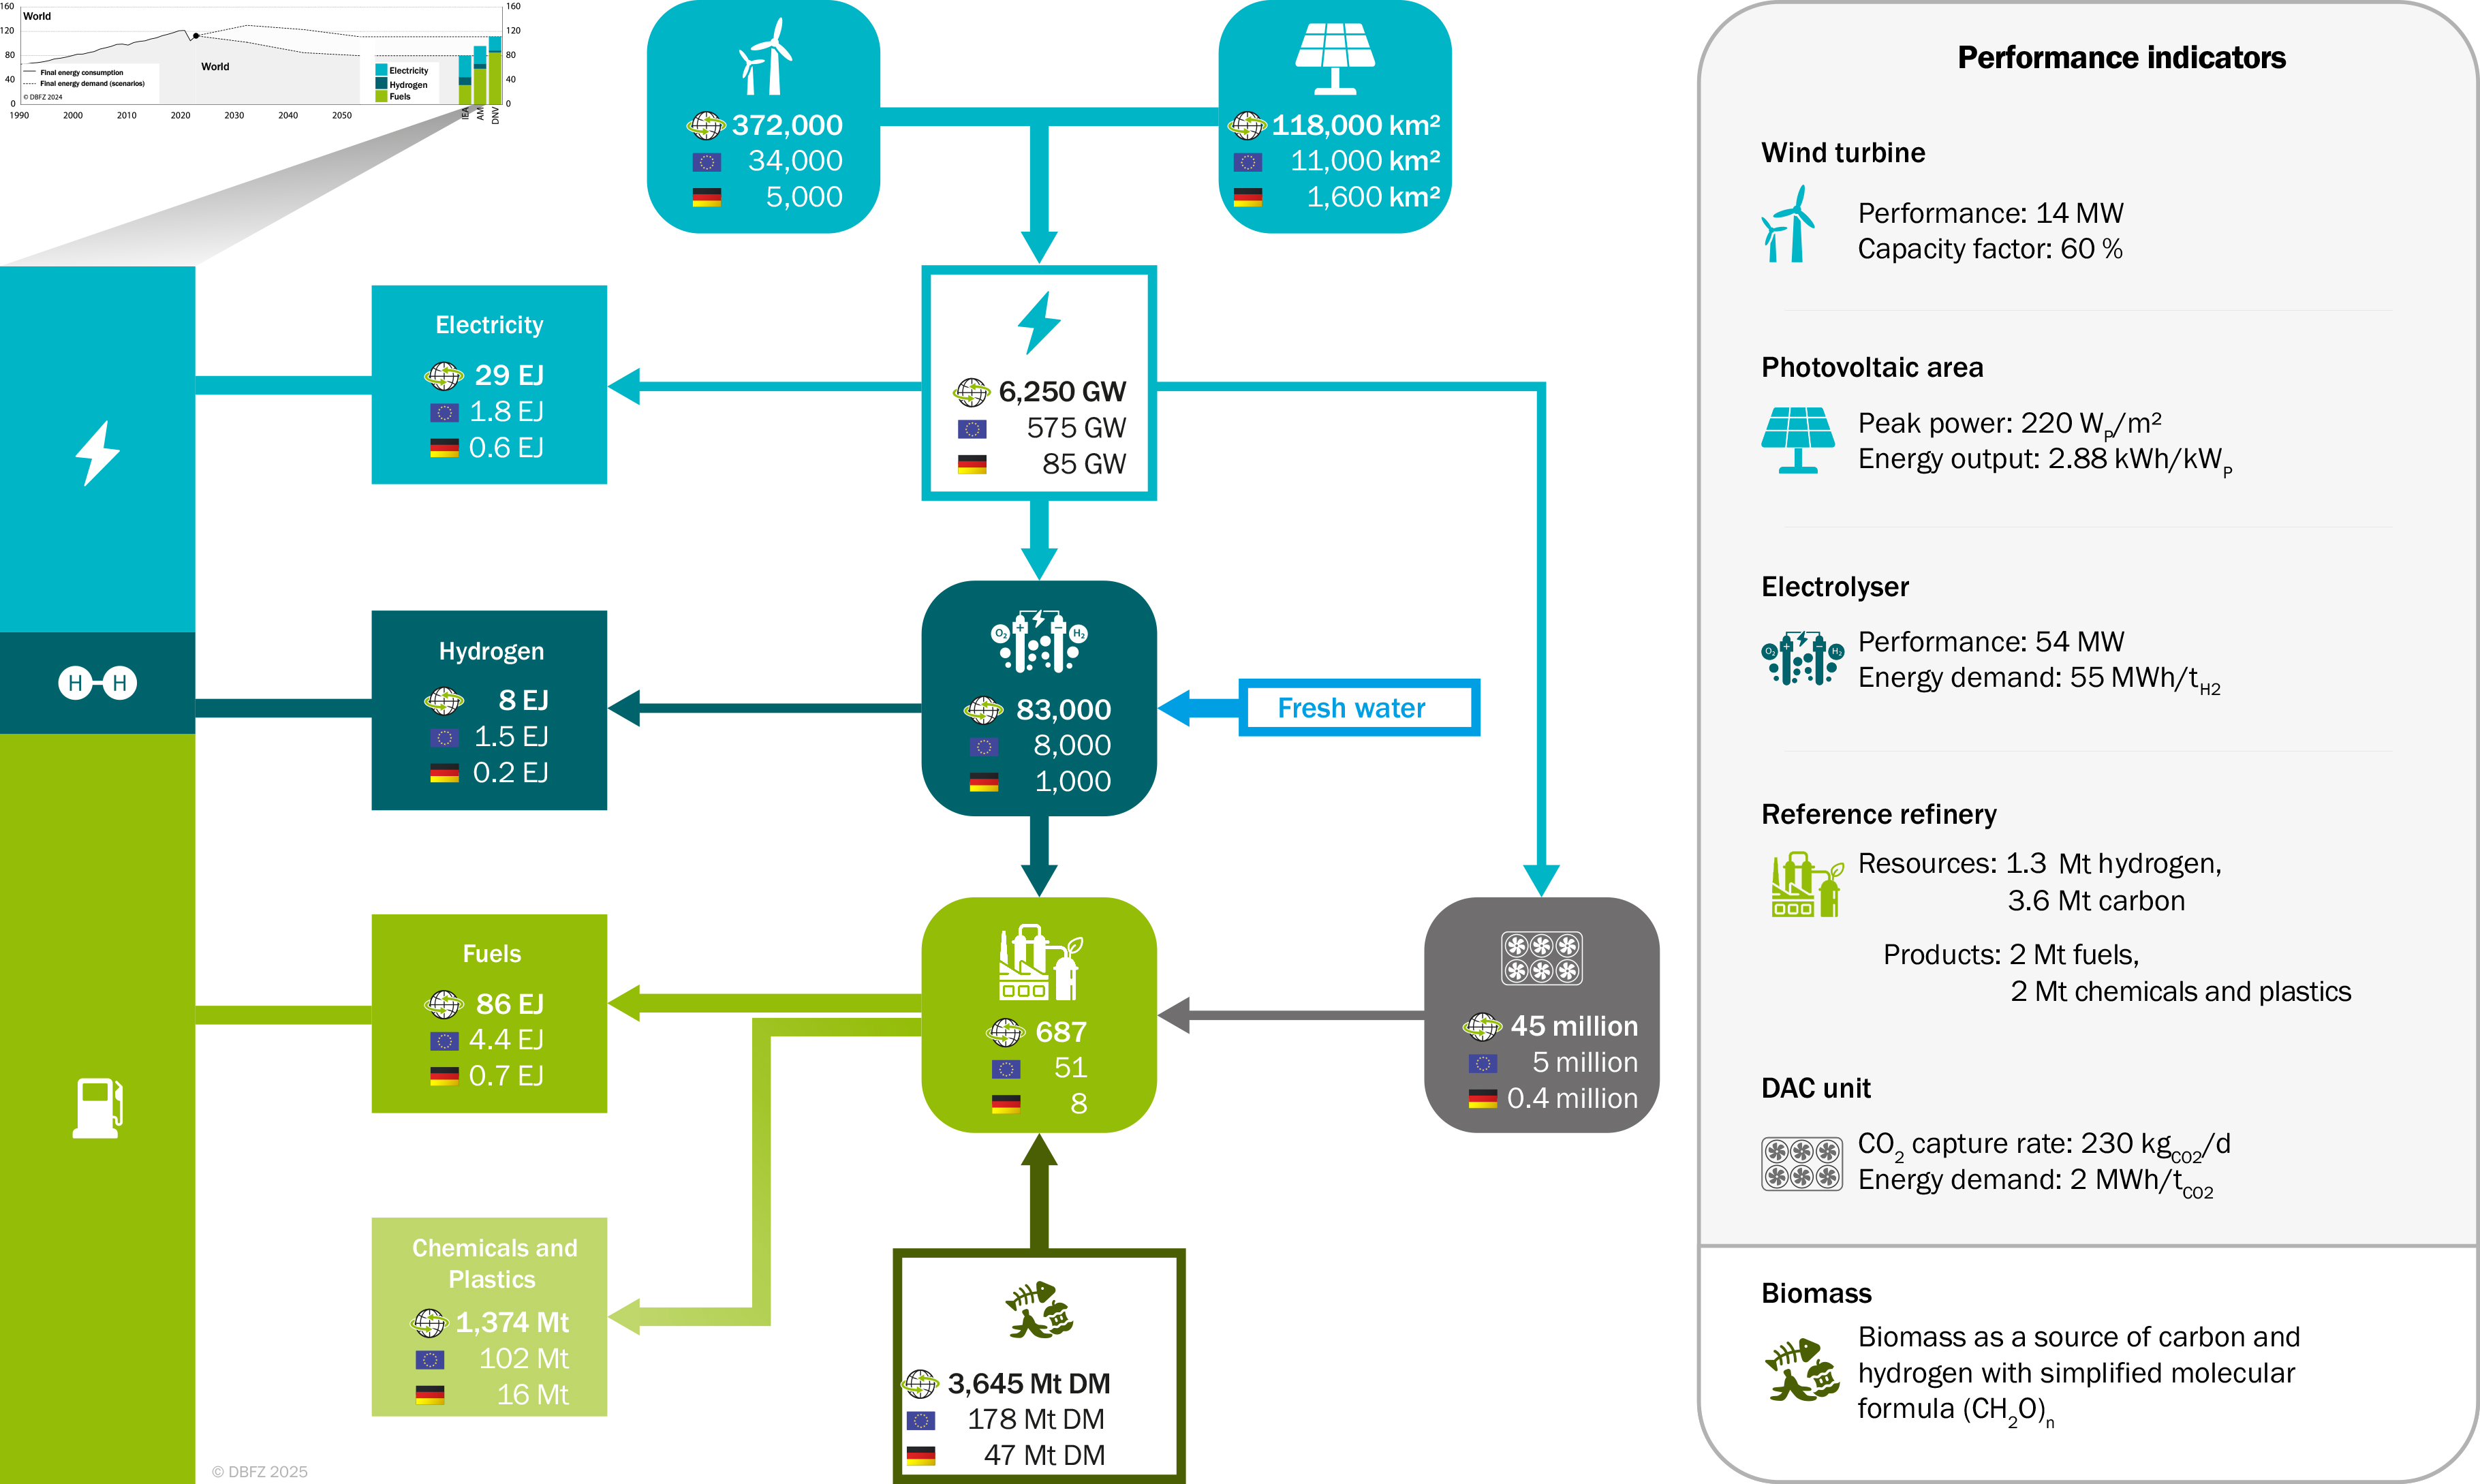
Summary
Chapter 1: The challenge of the energy transition in transport
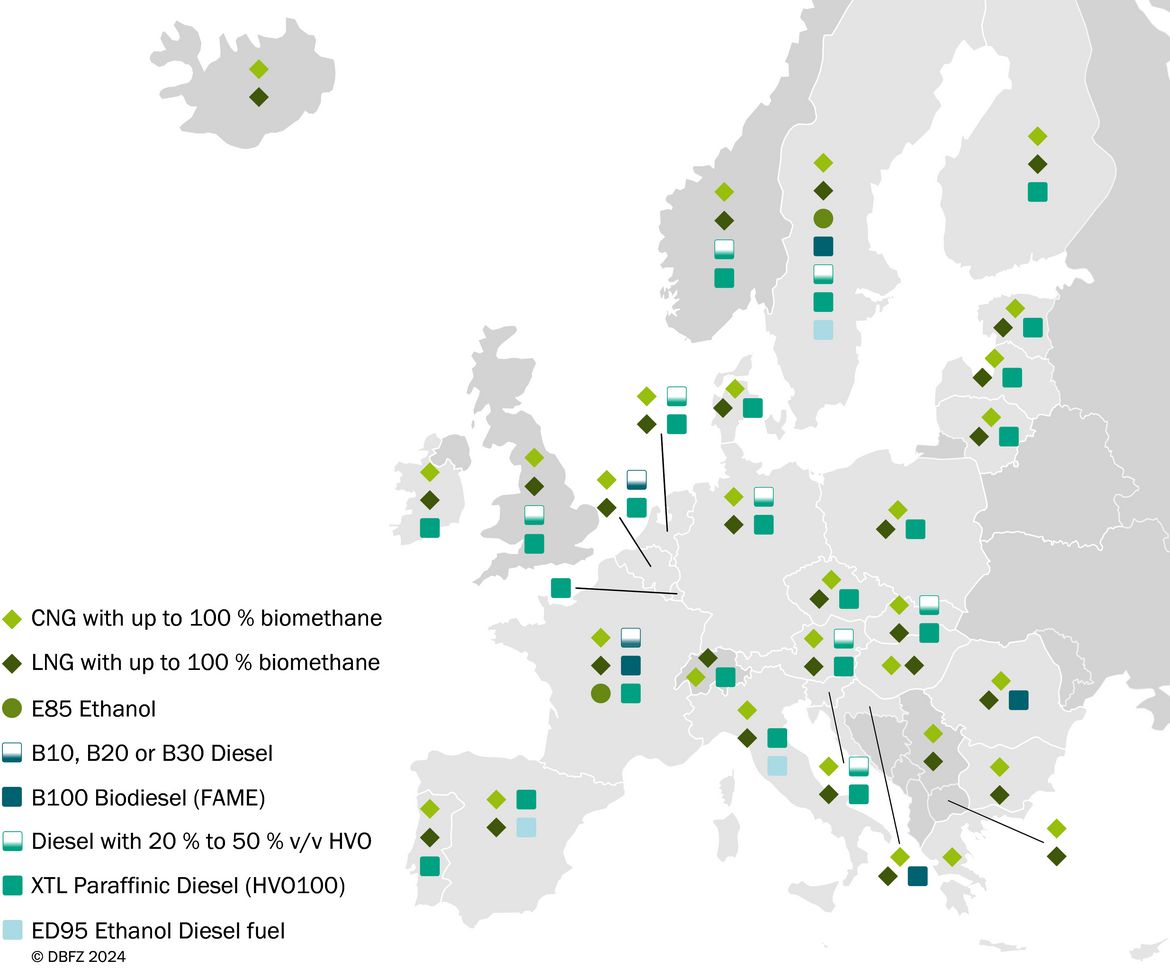
Chapter 2: Transport and its infrastructure
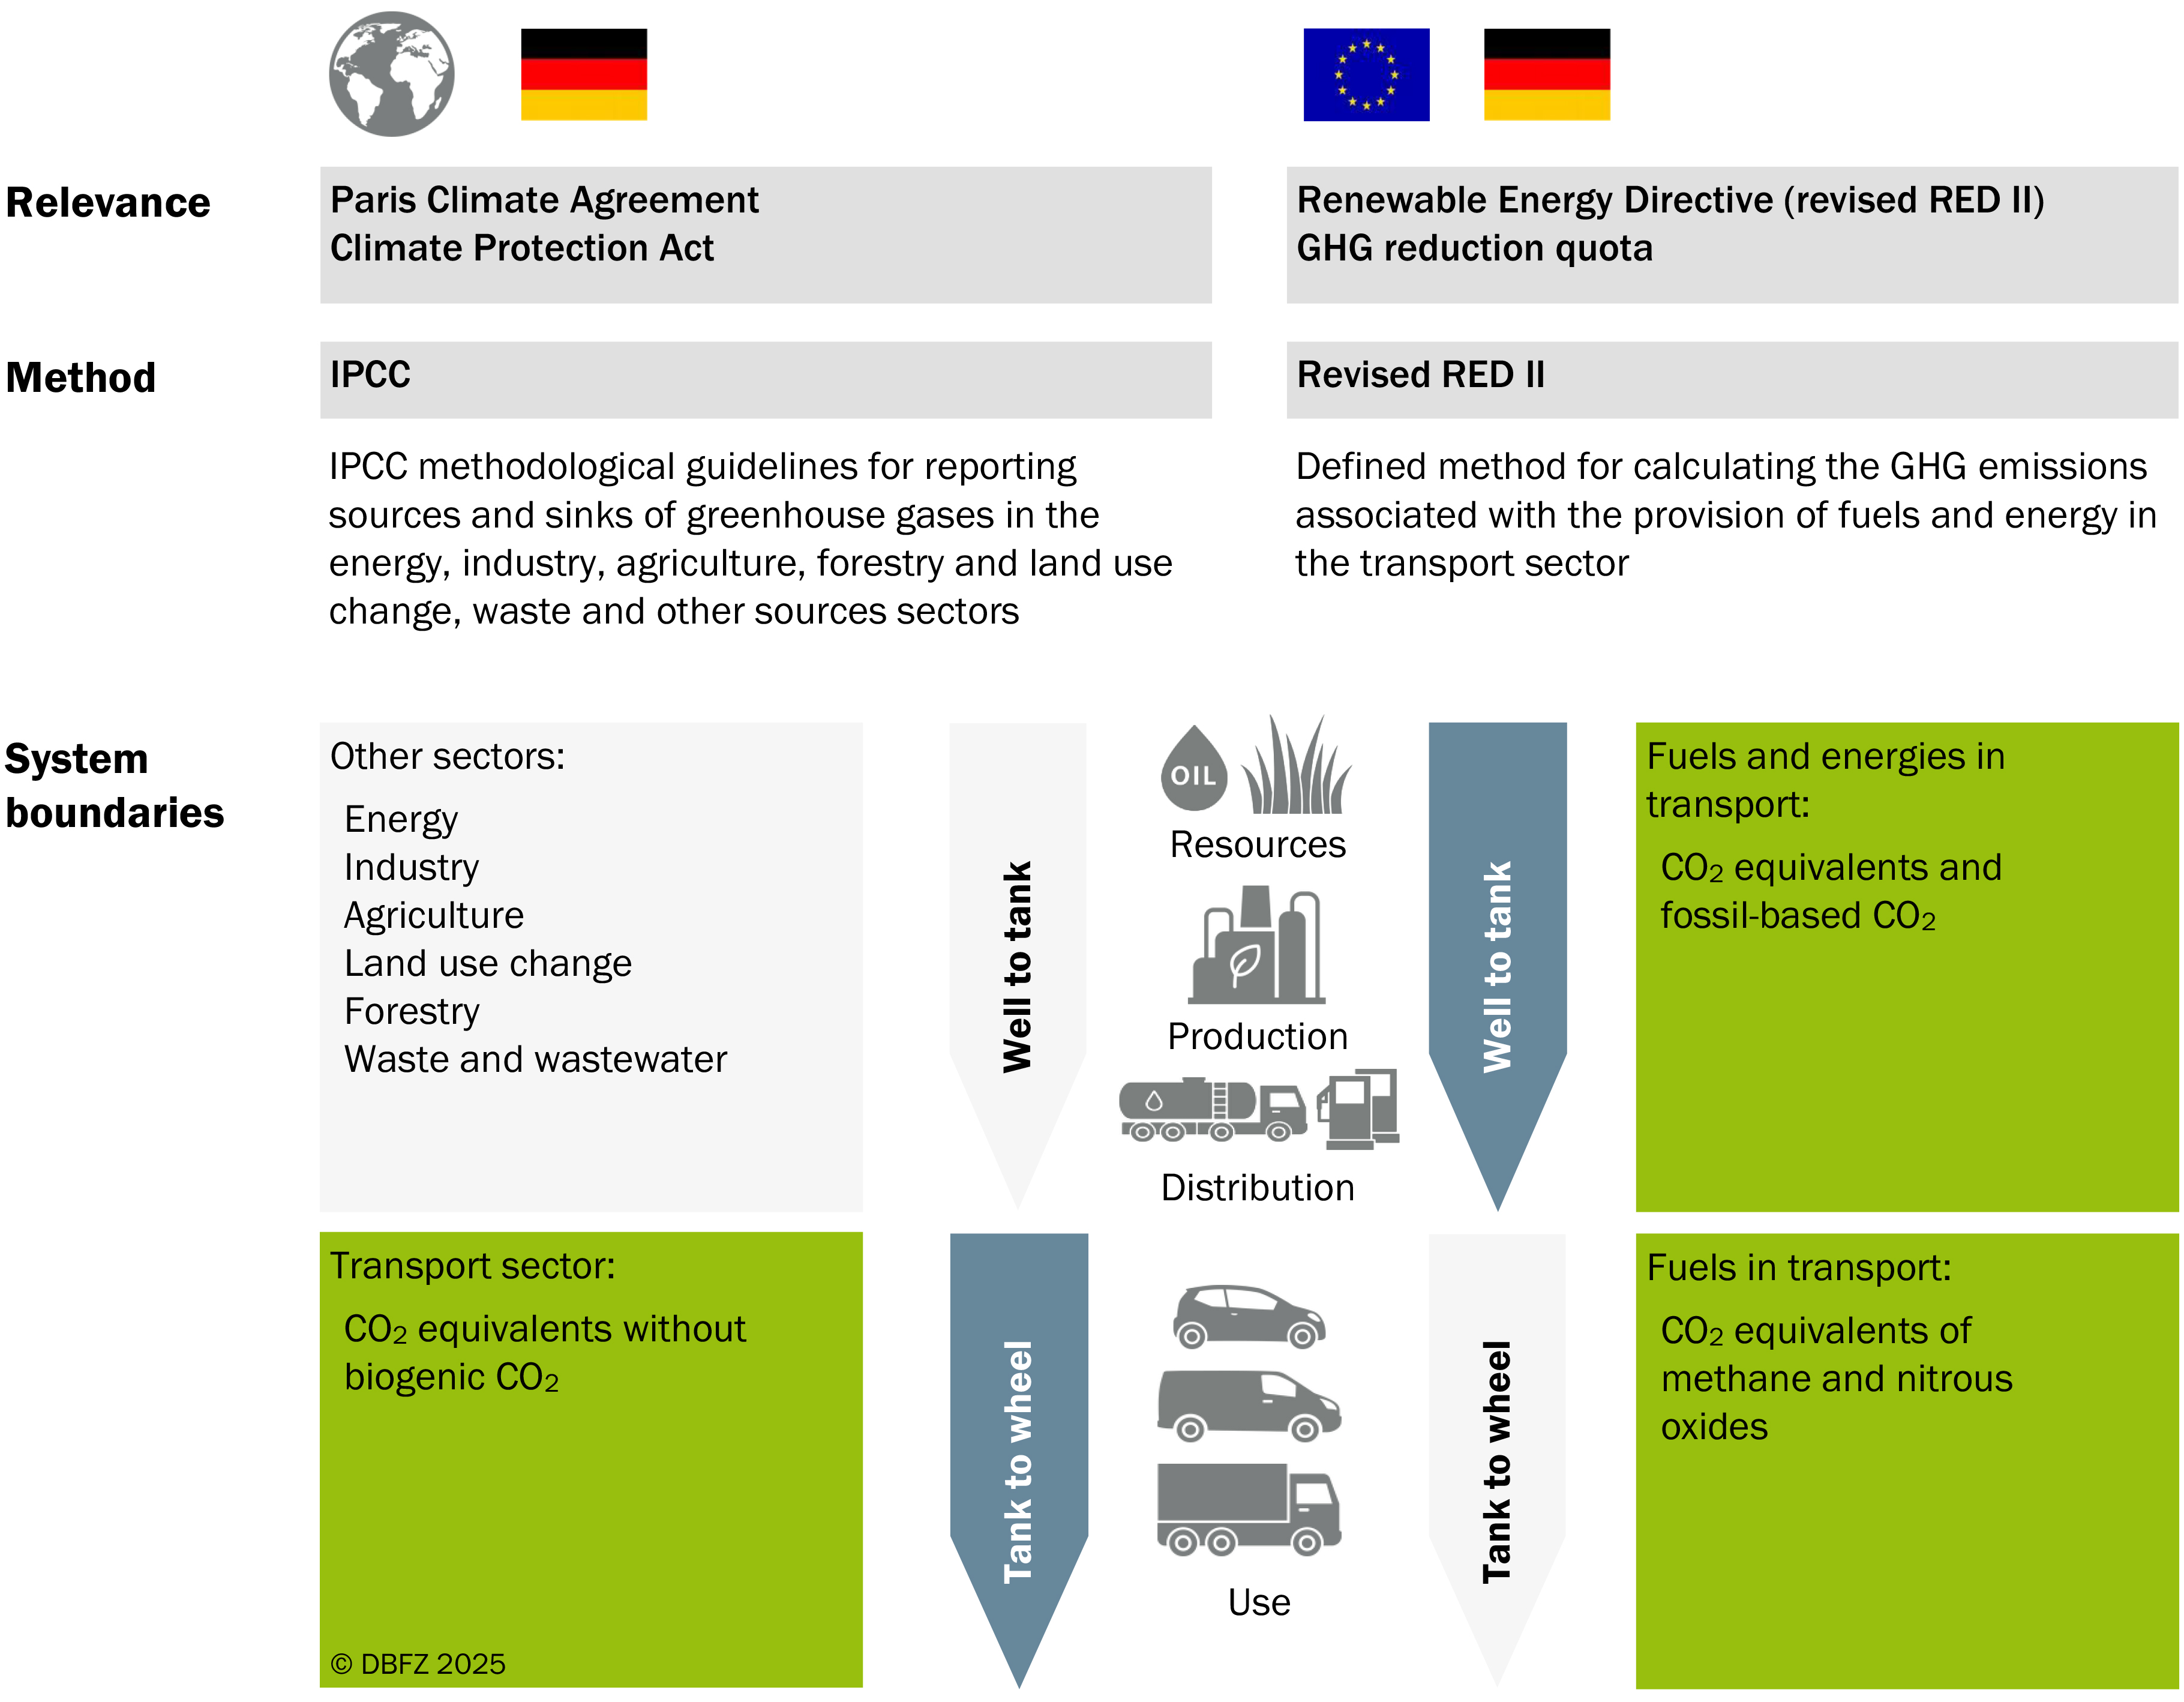
Chapter 3: Political and legal framework
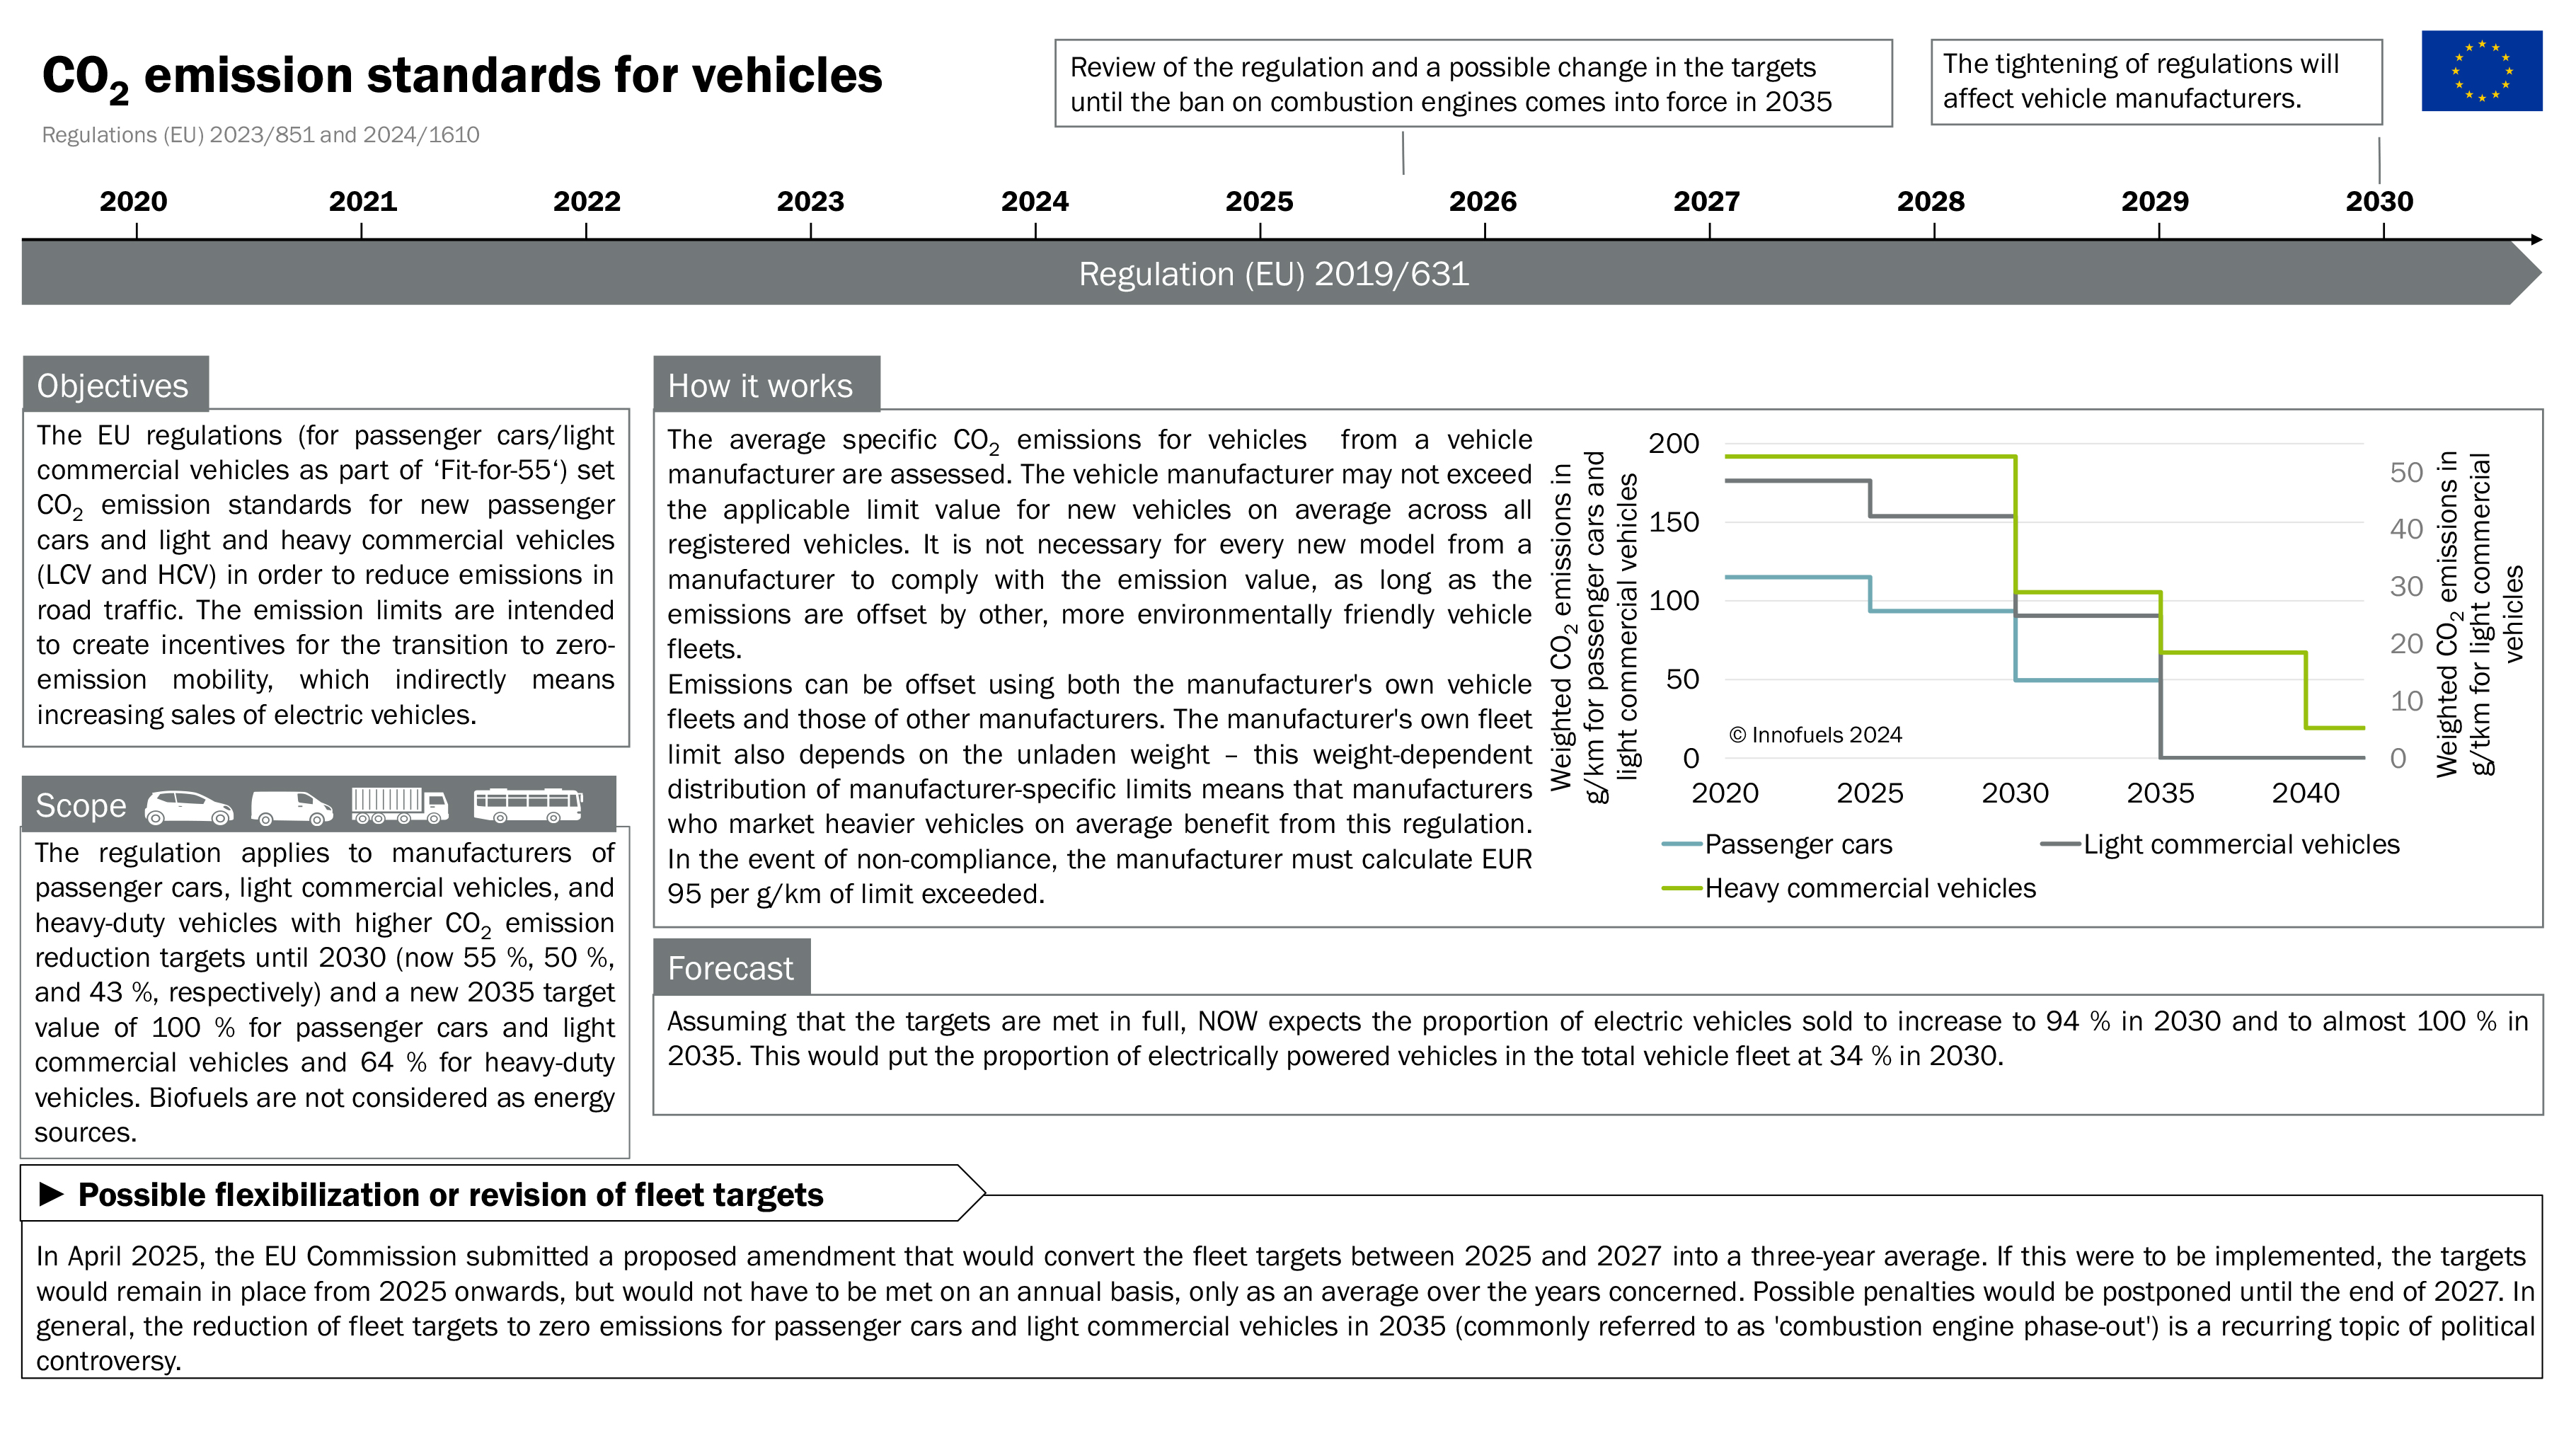
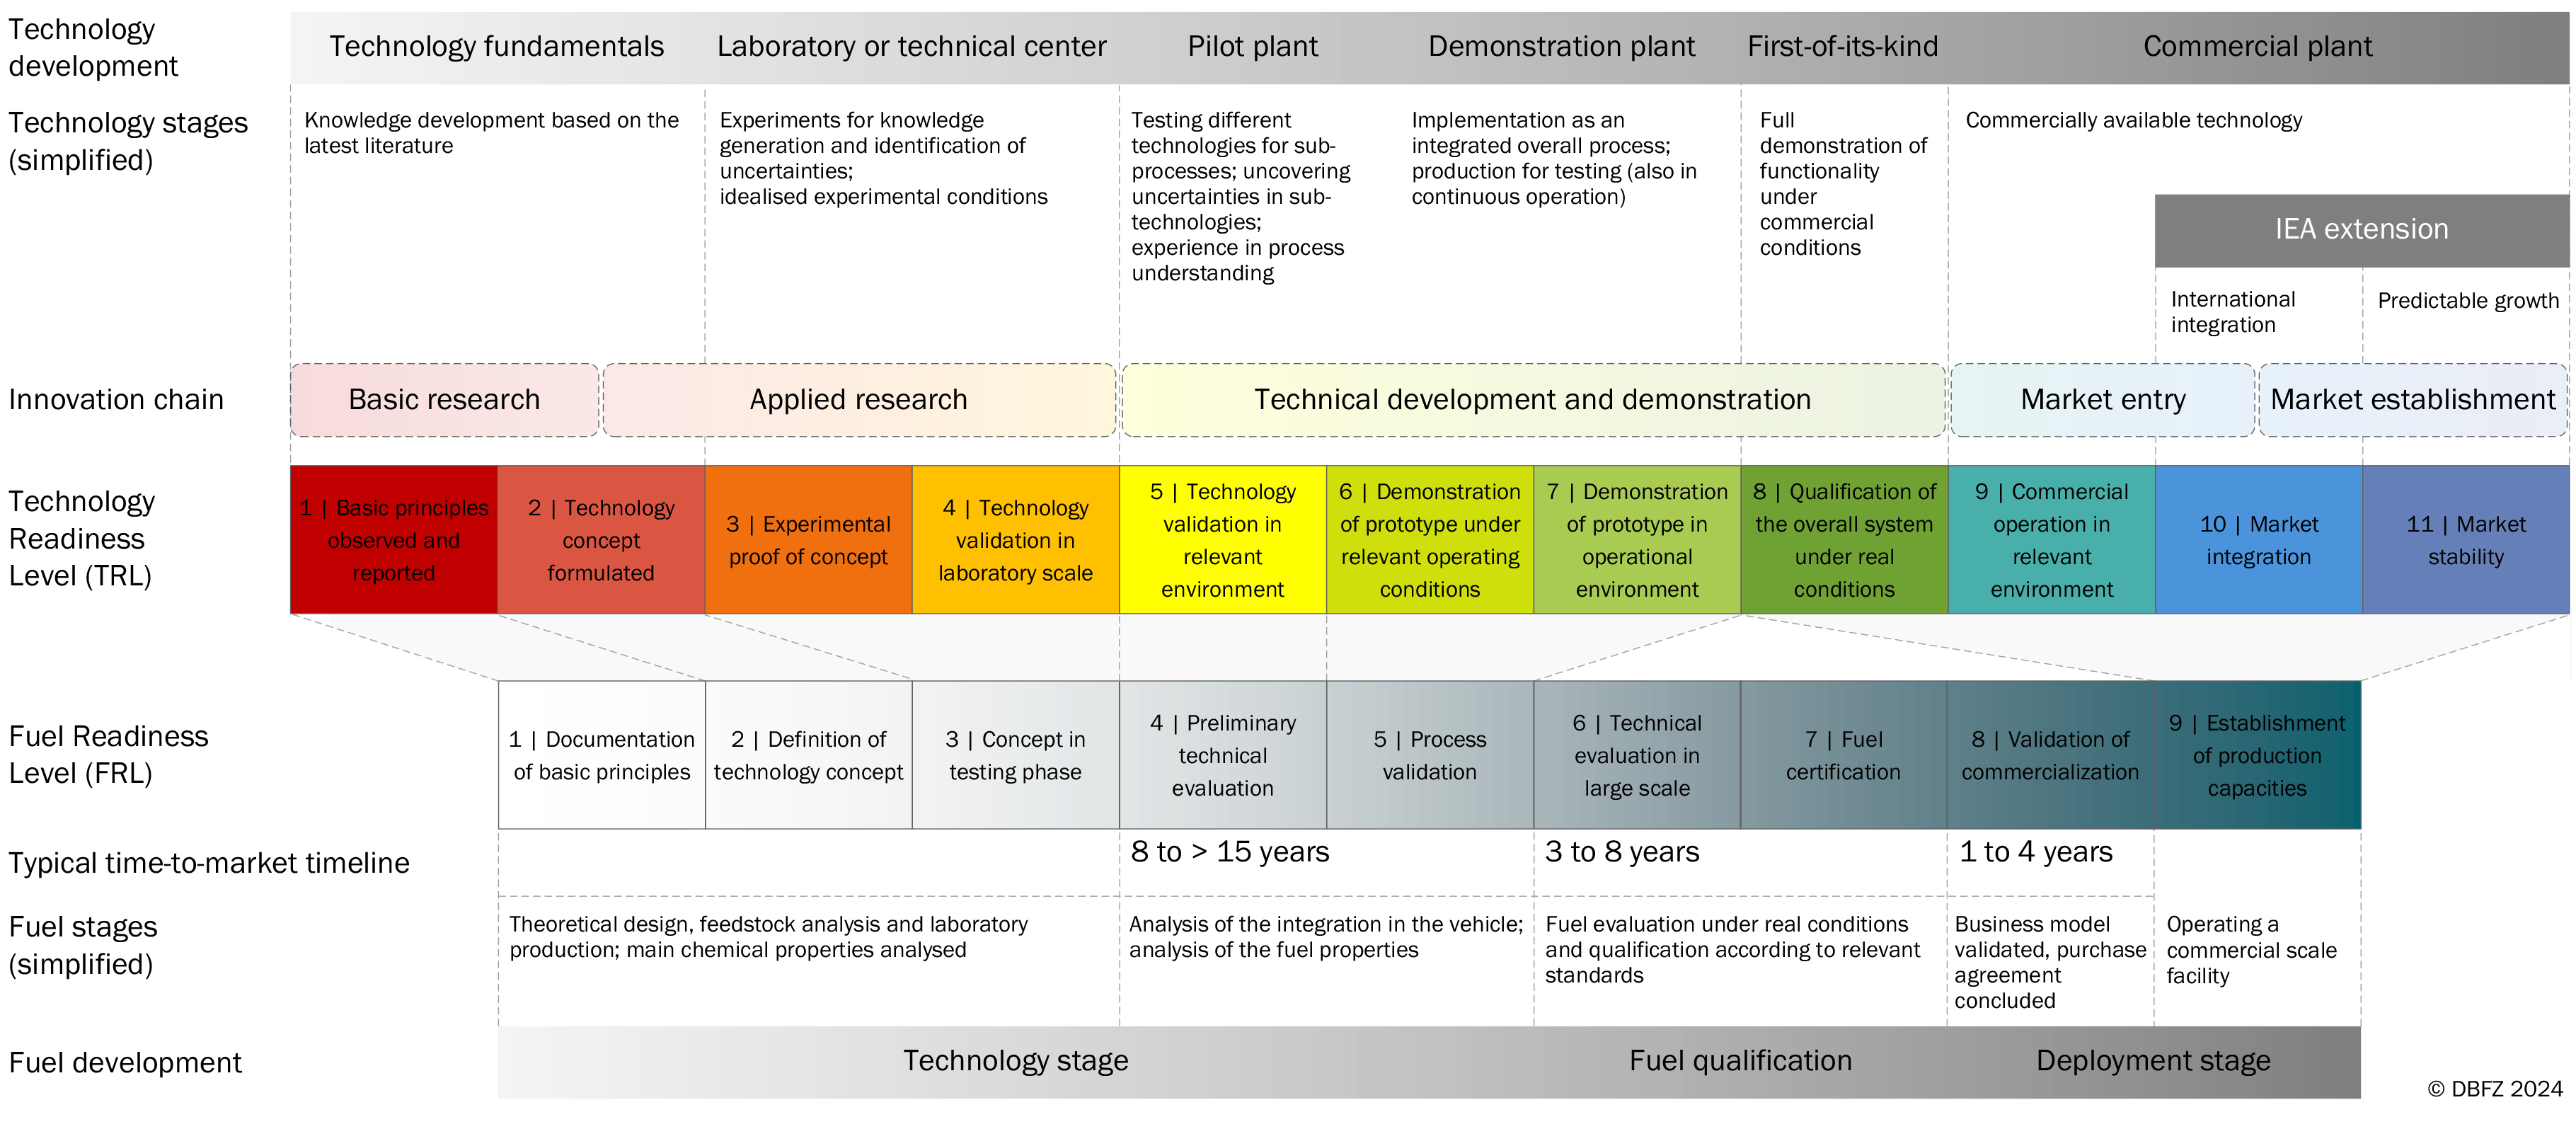
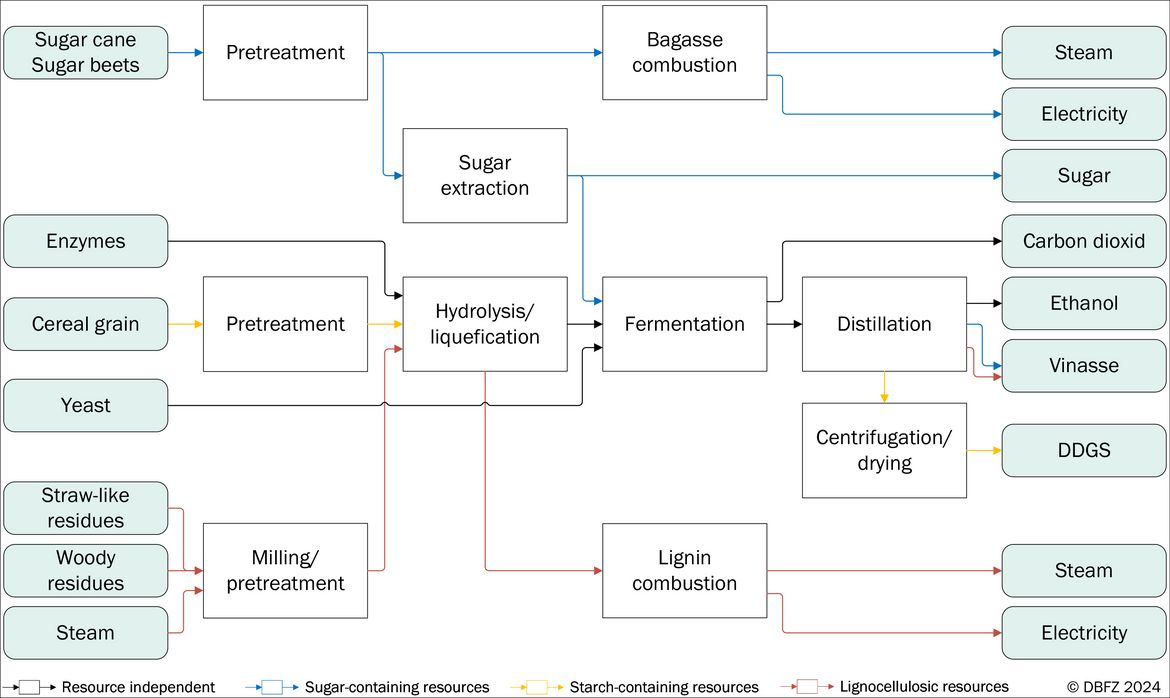
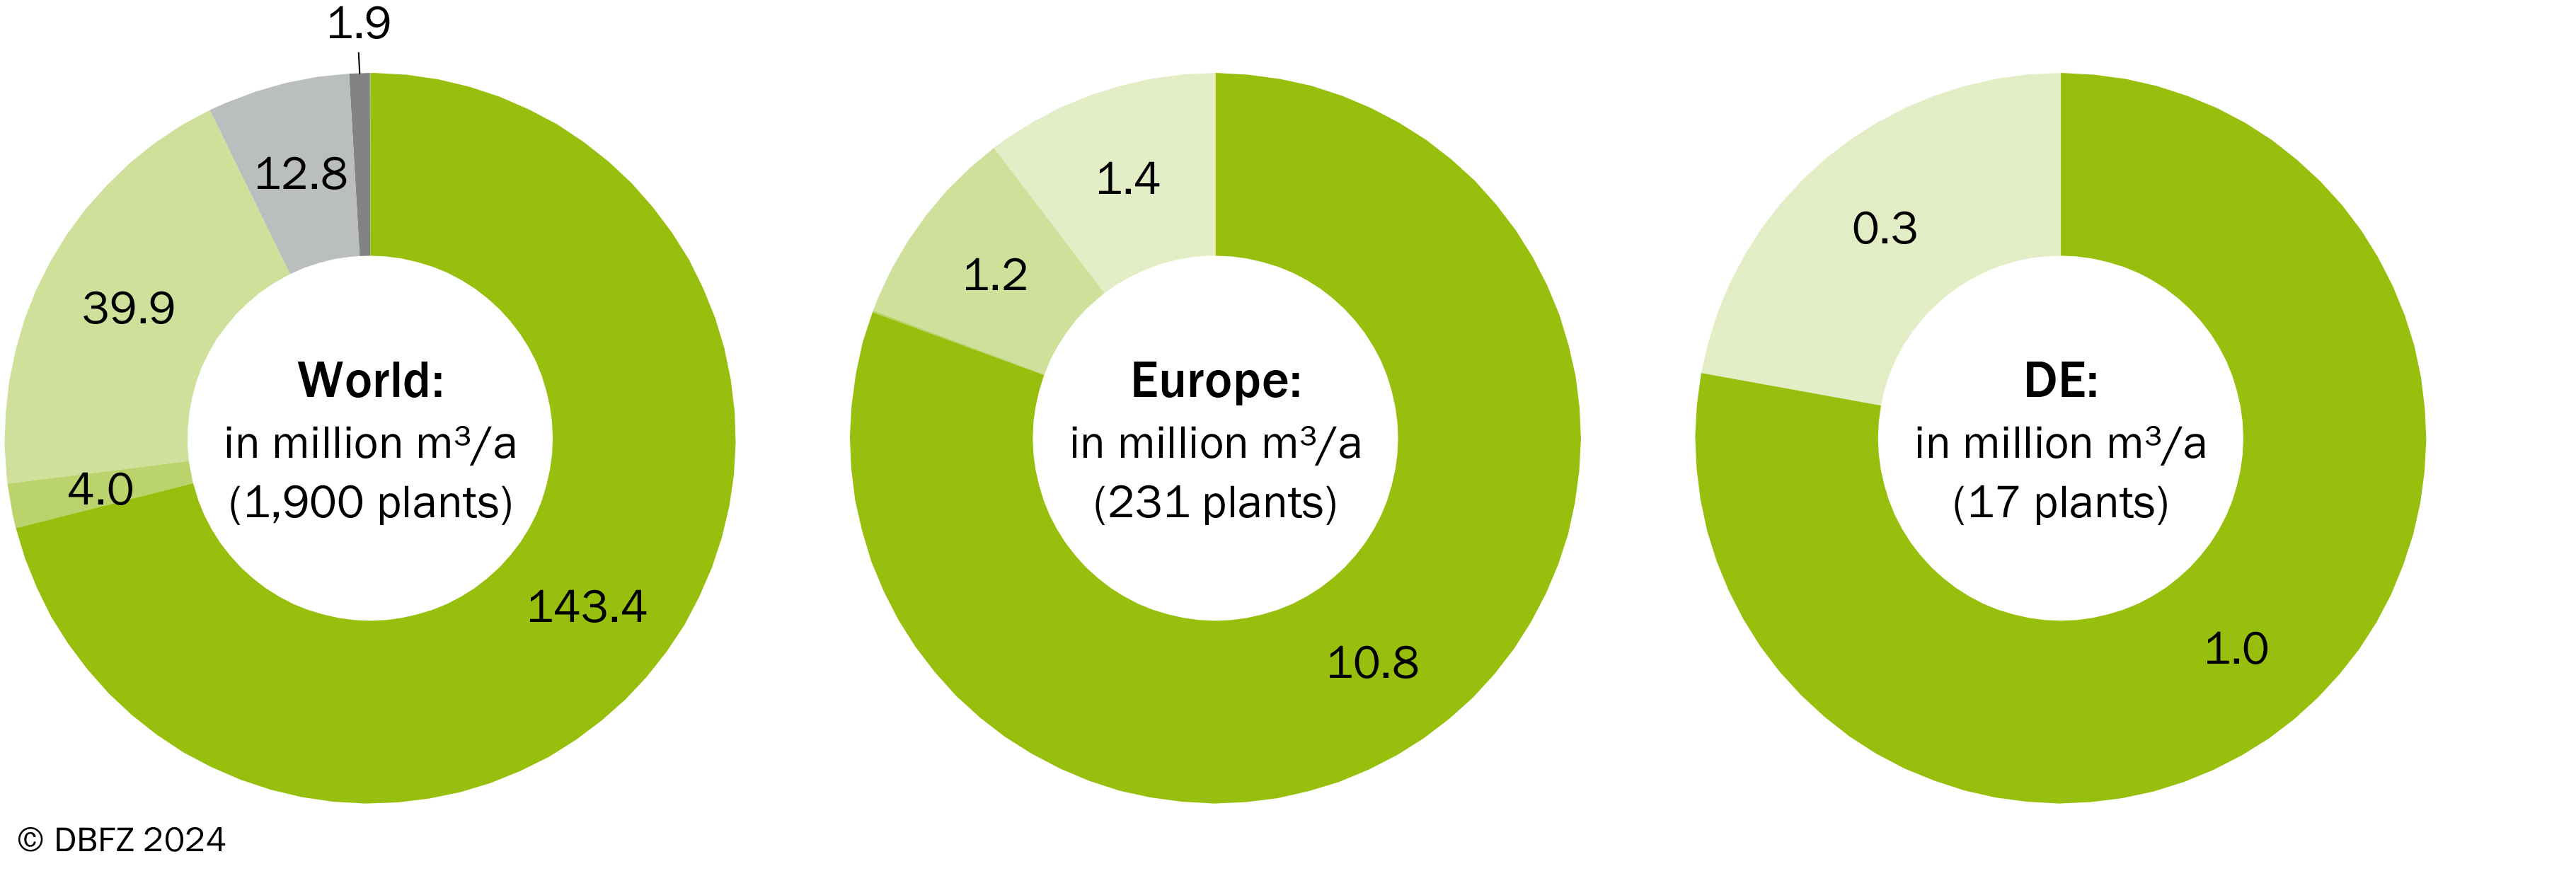
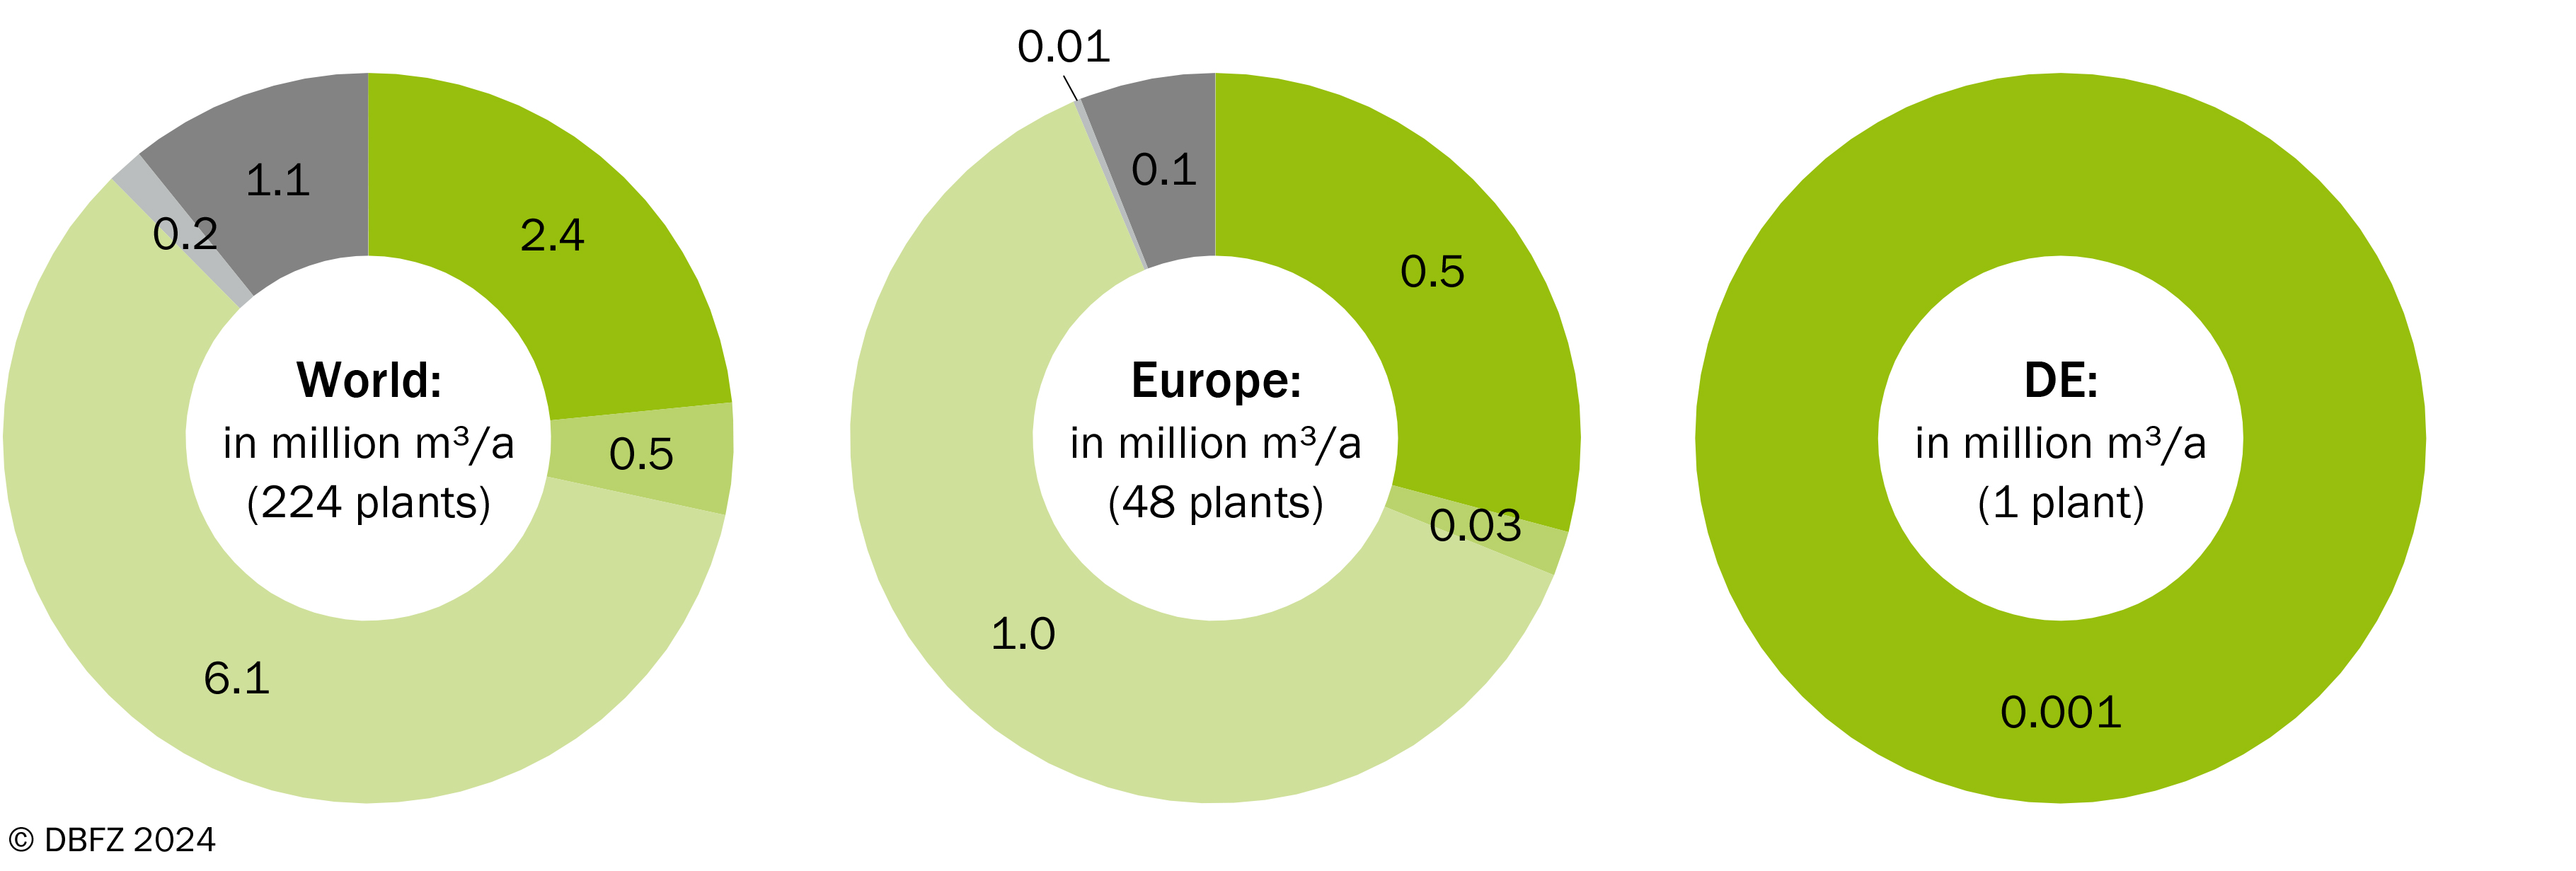
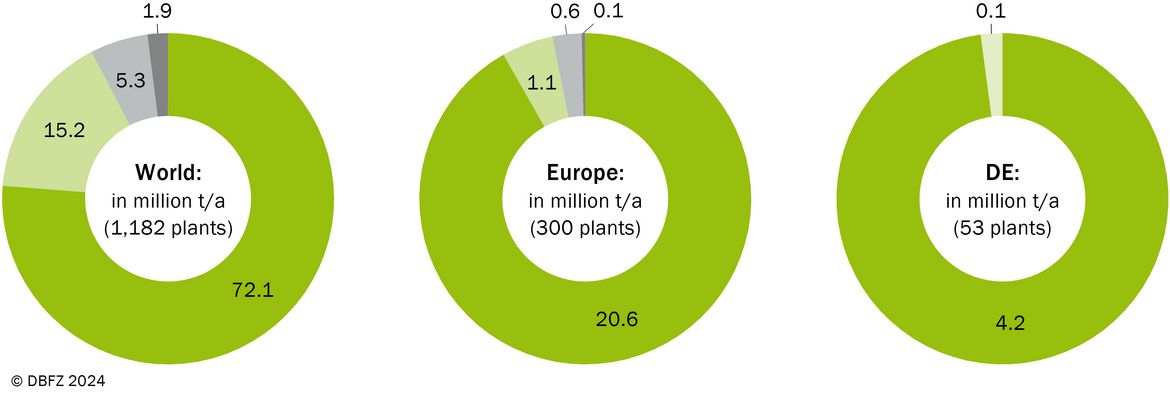
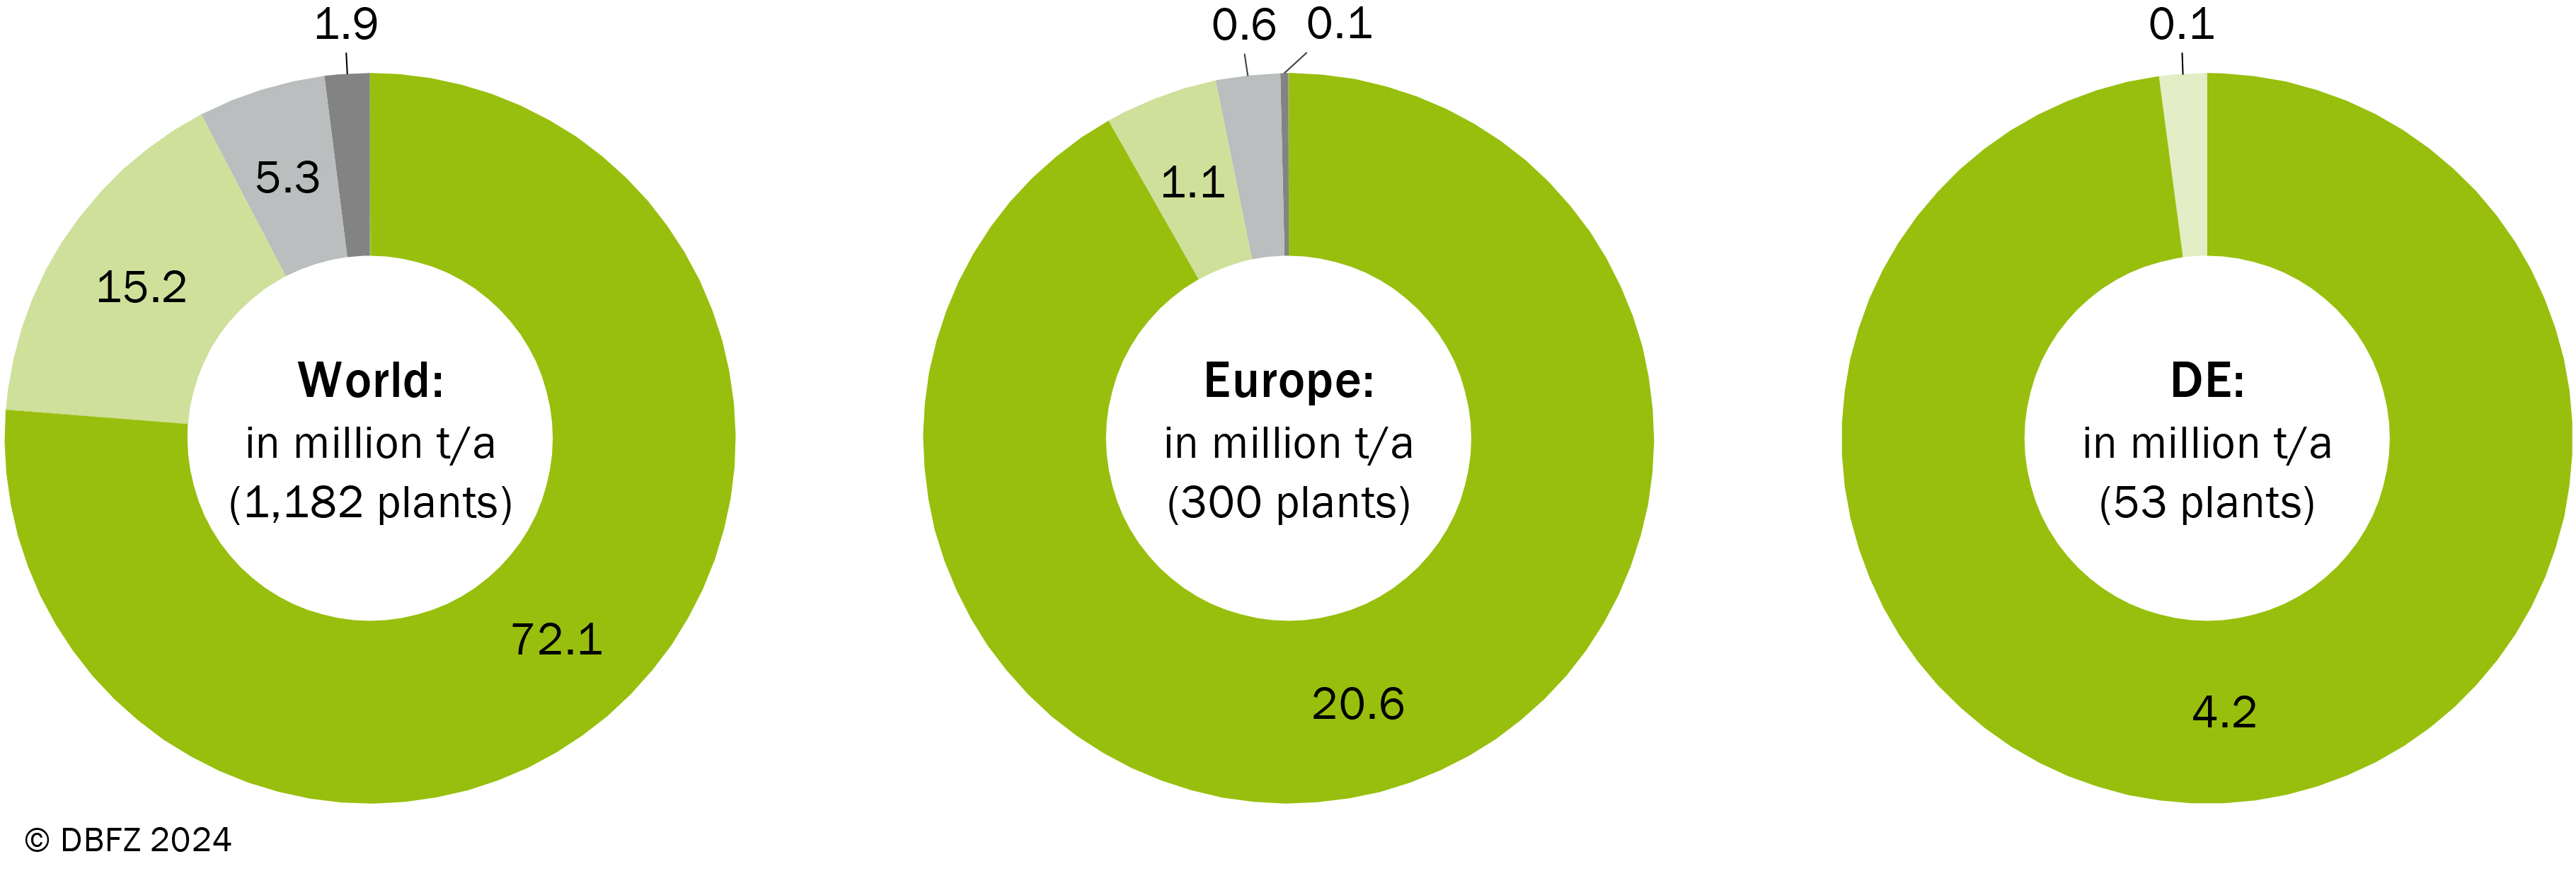
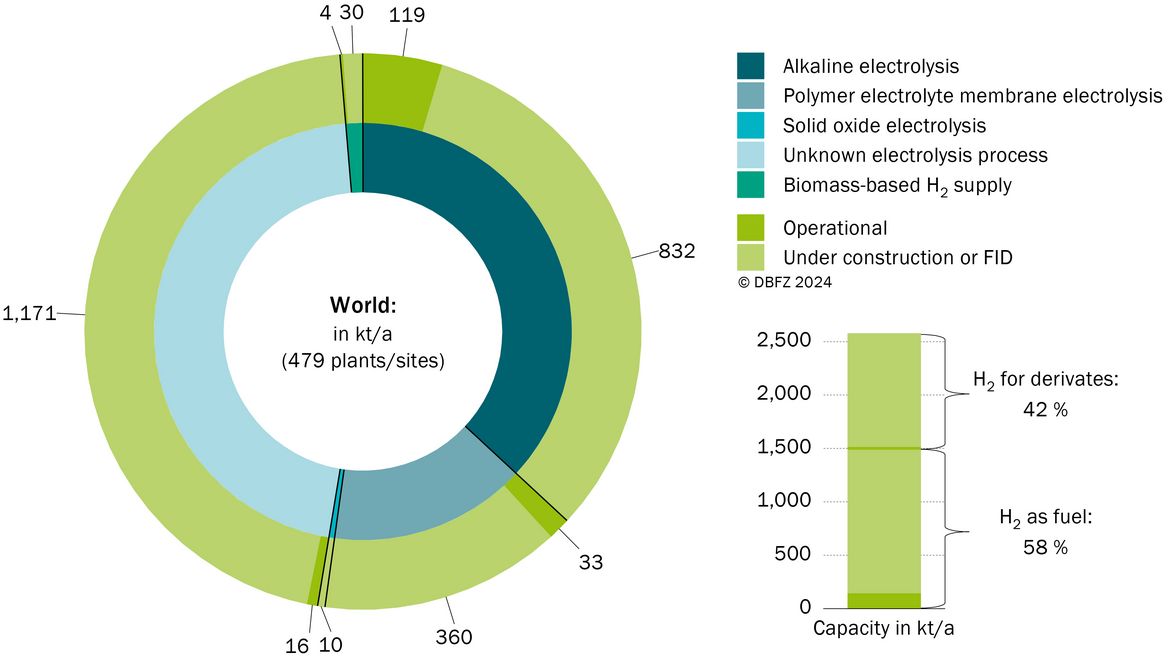
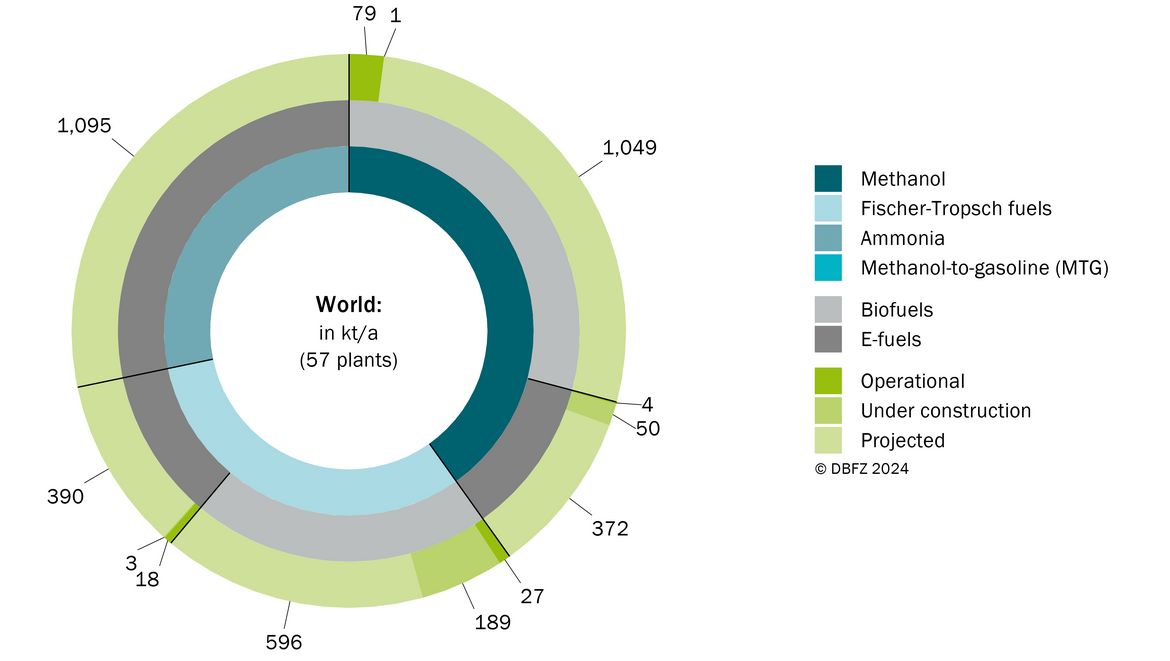
Chapter 4: Production technologies for the provision of renewable fuels
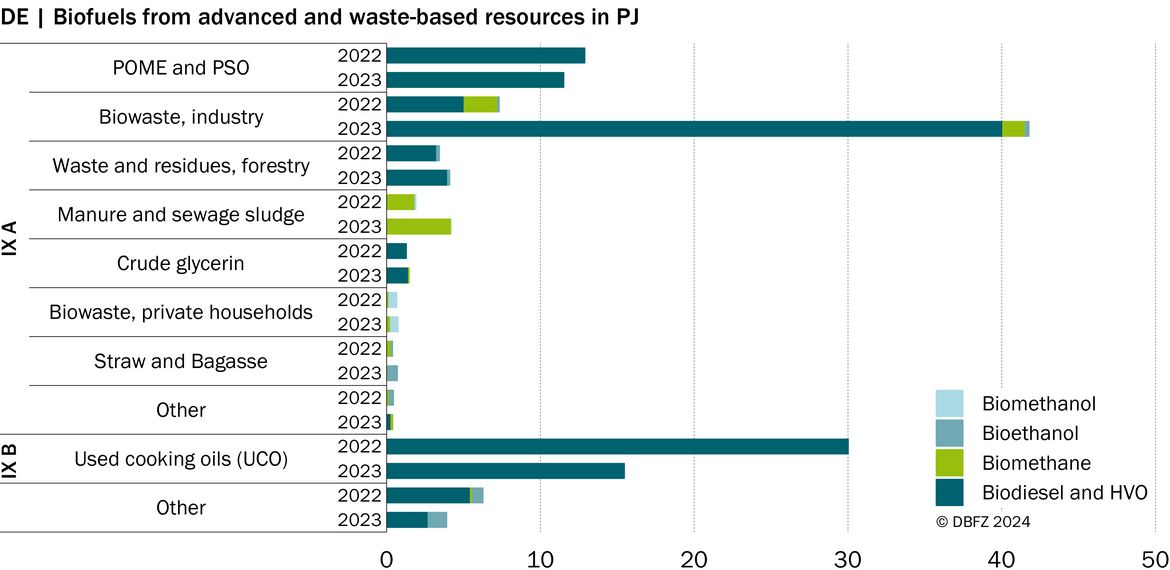
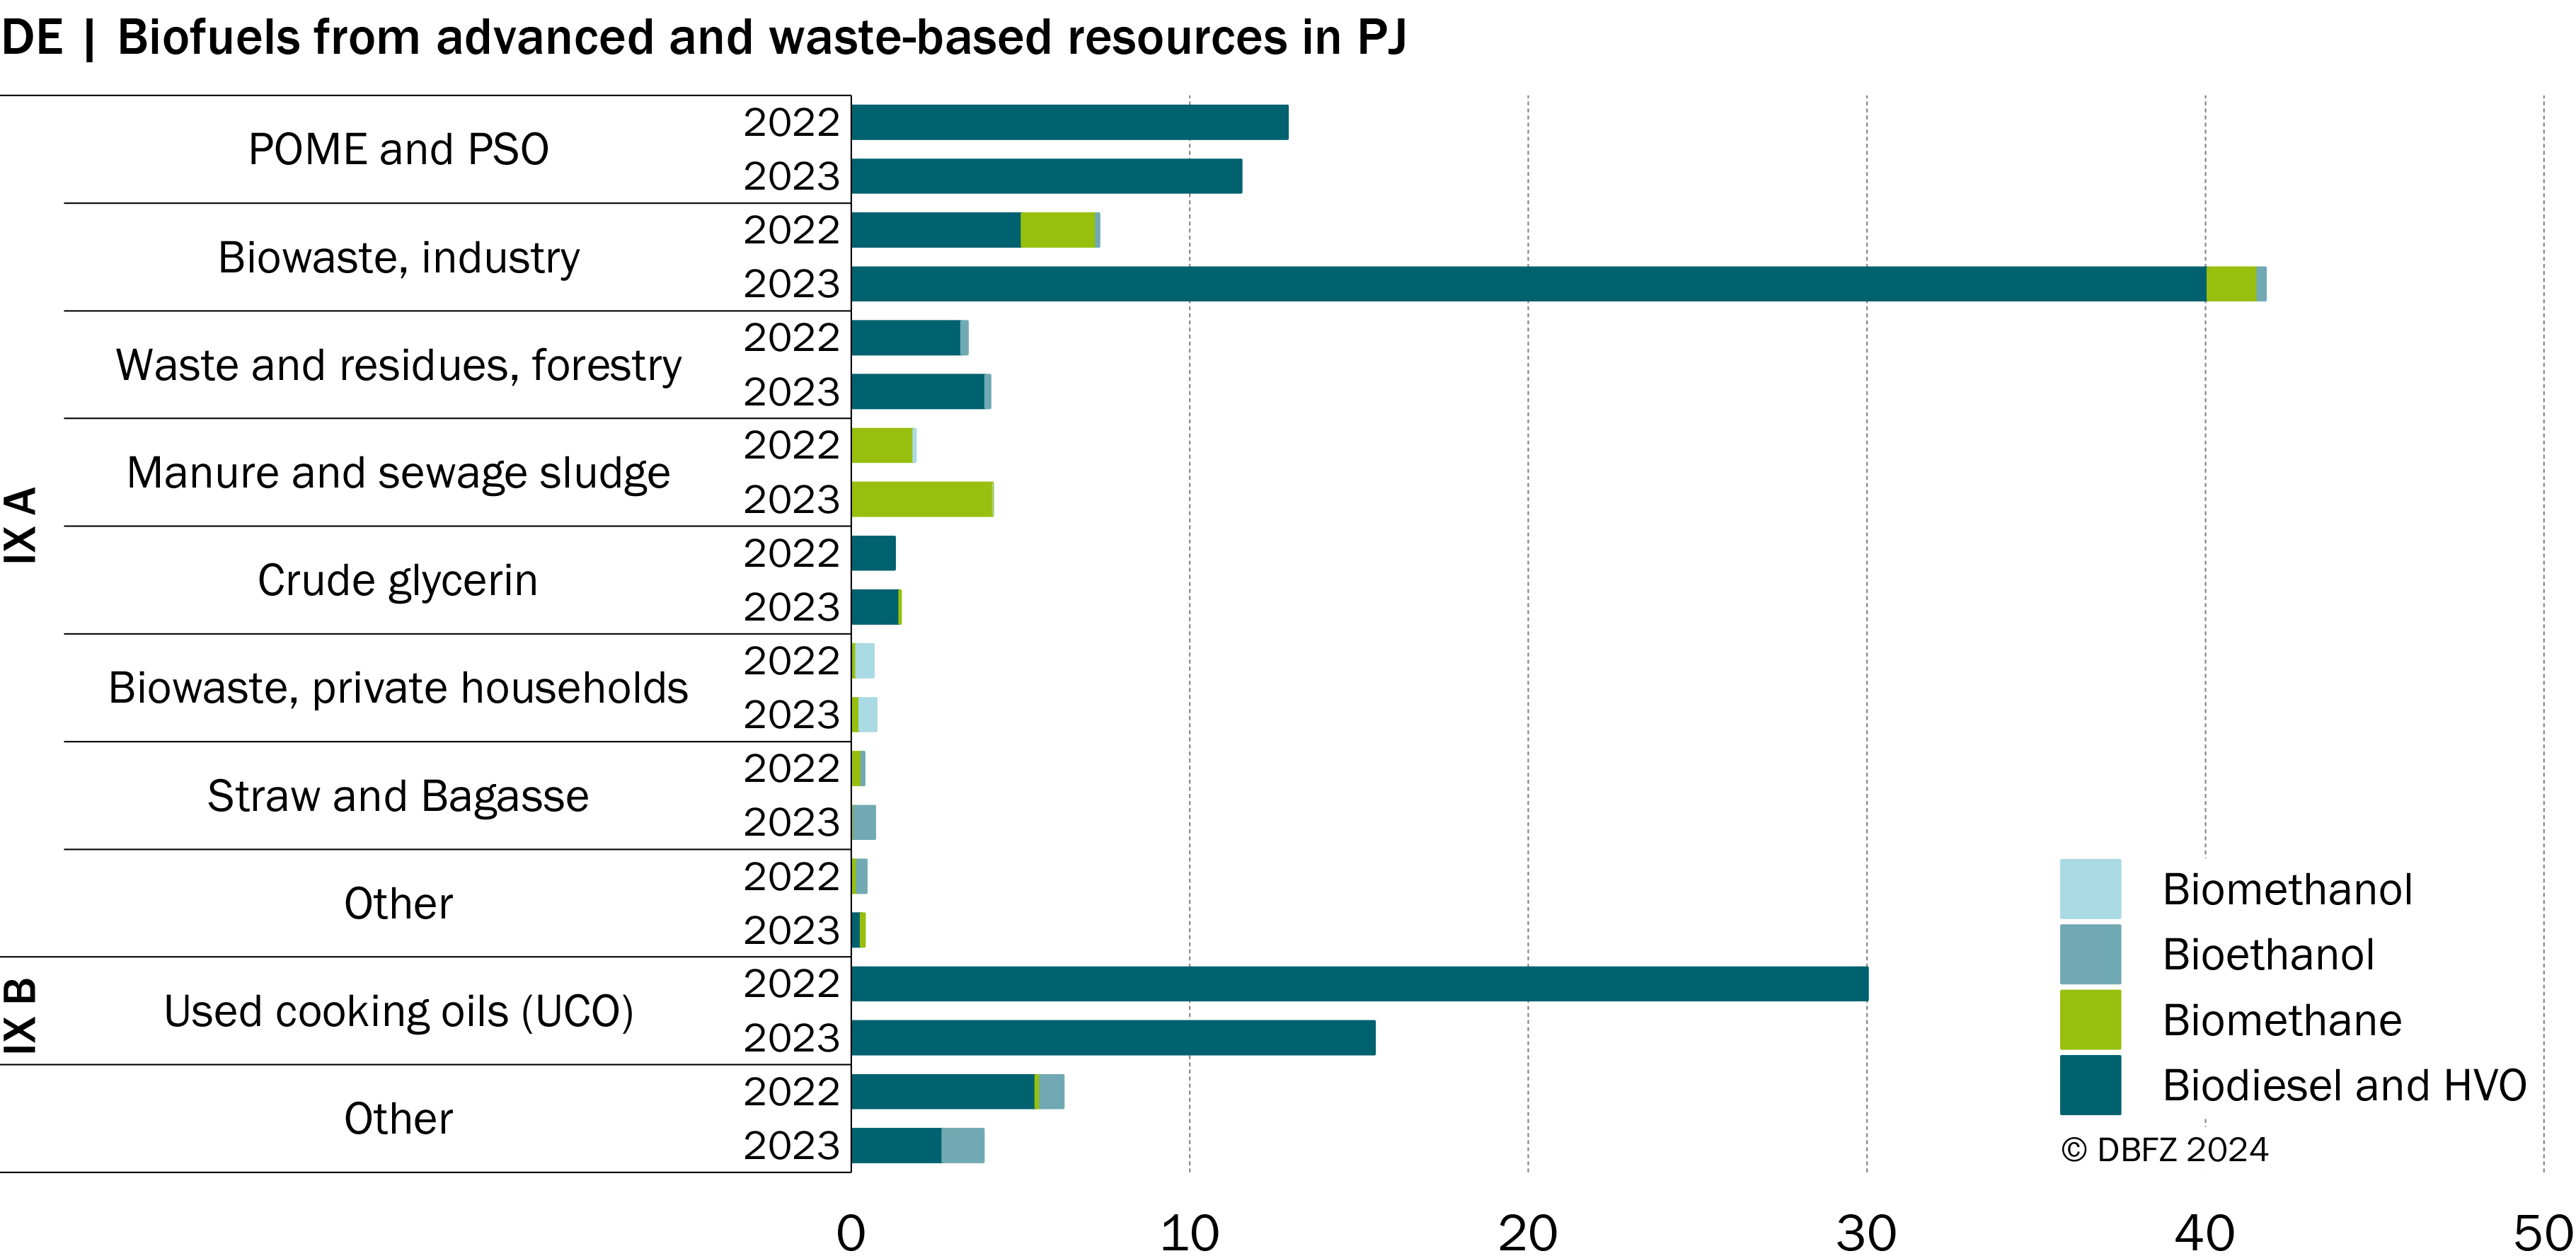
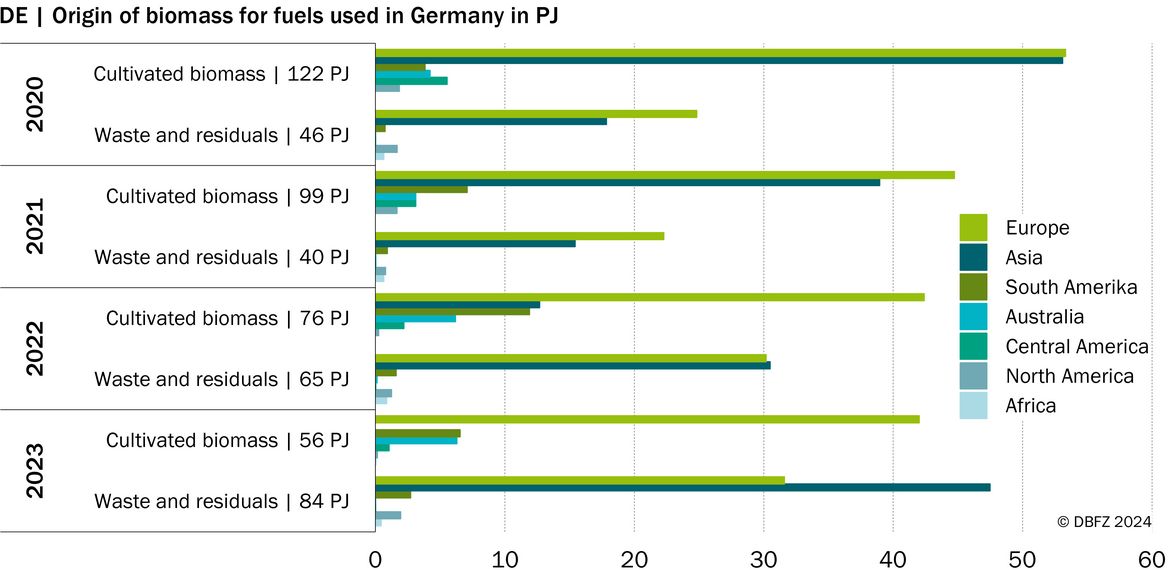
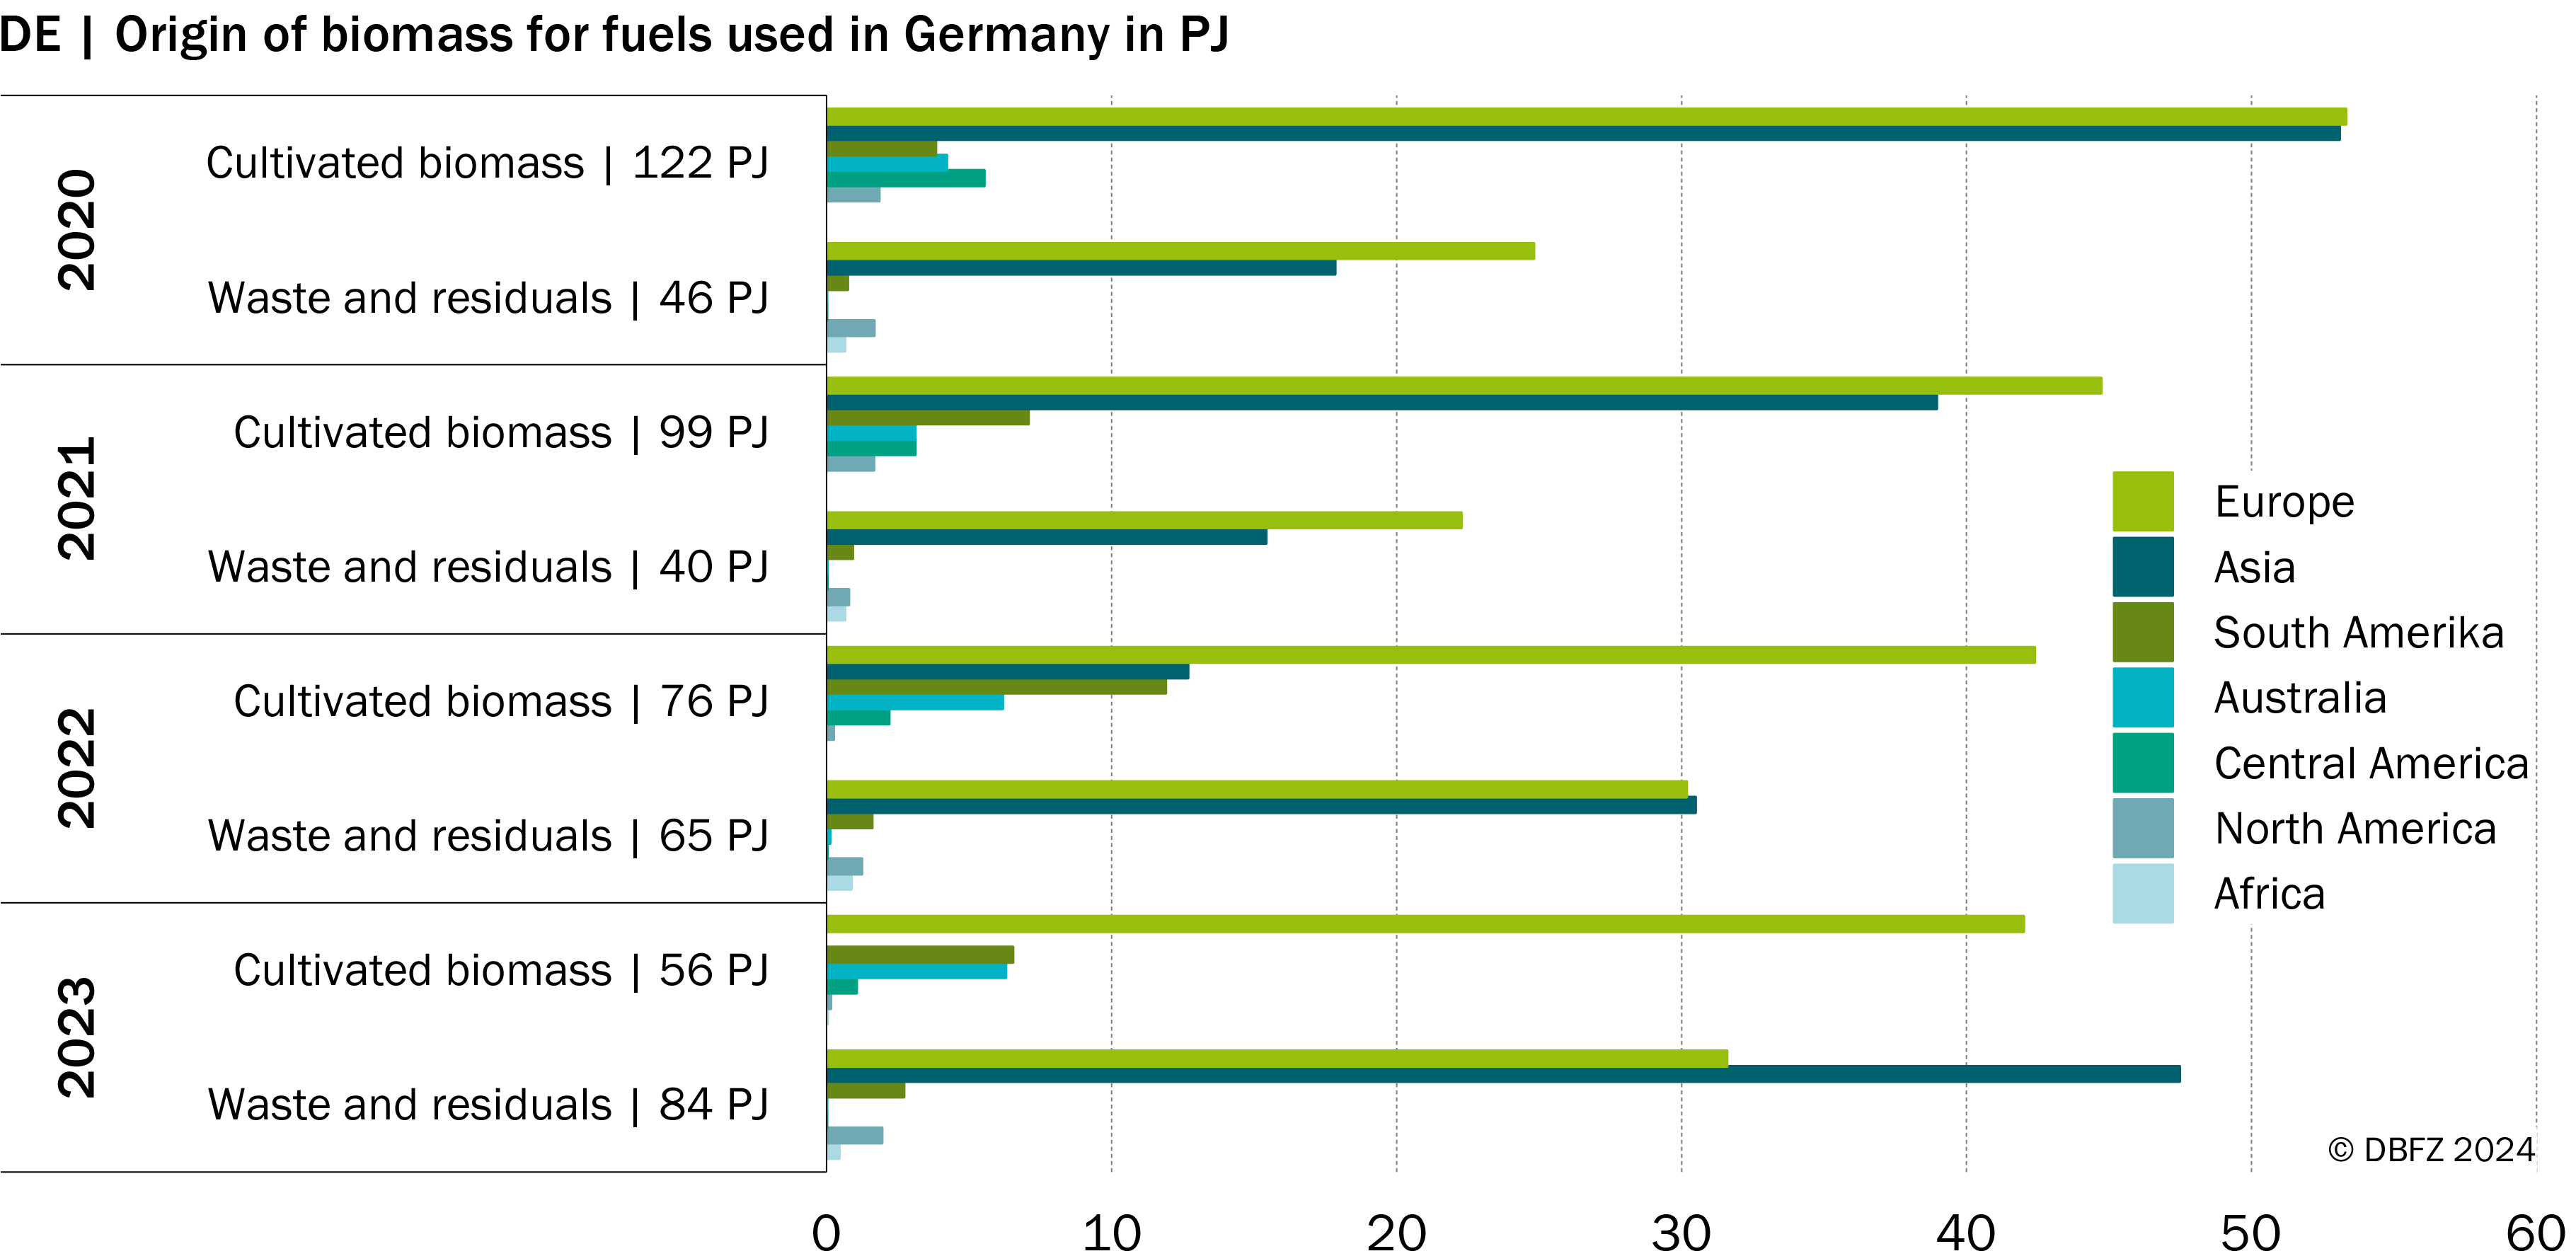
Chapter 5: Resources and their mobilisation
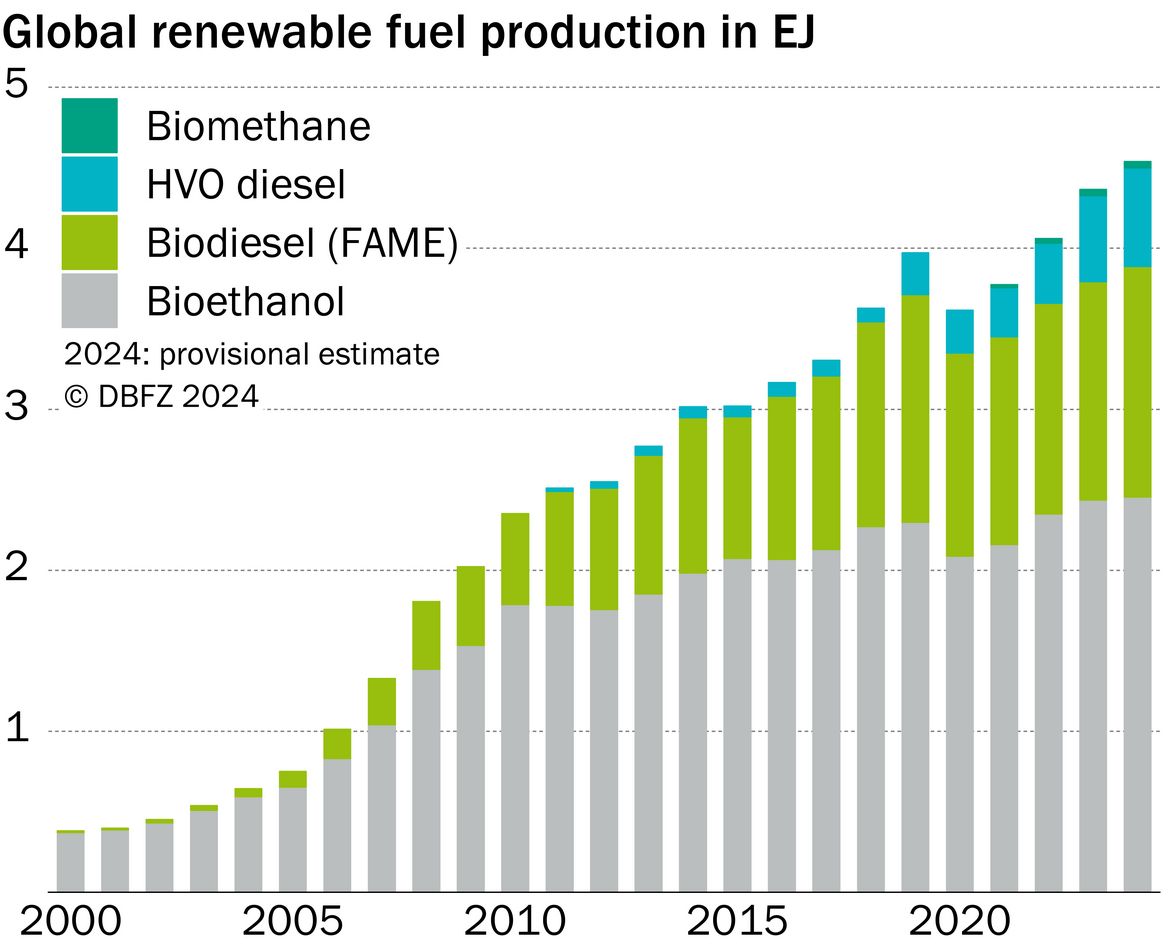
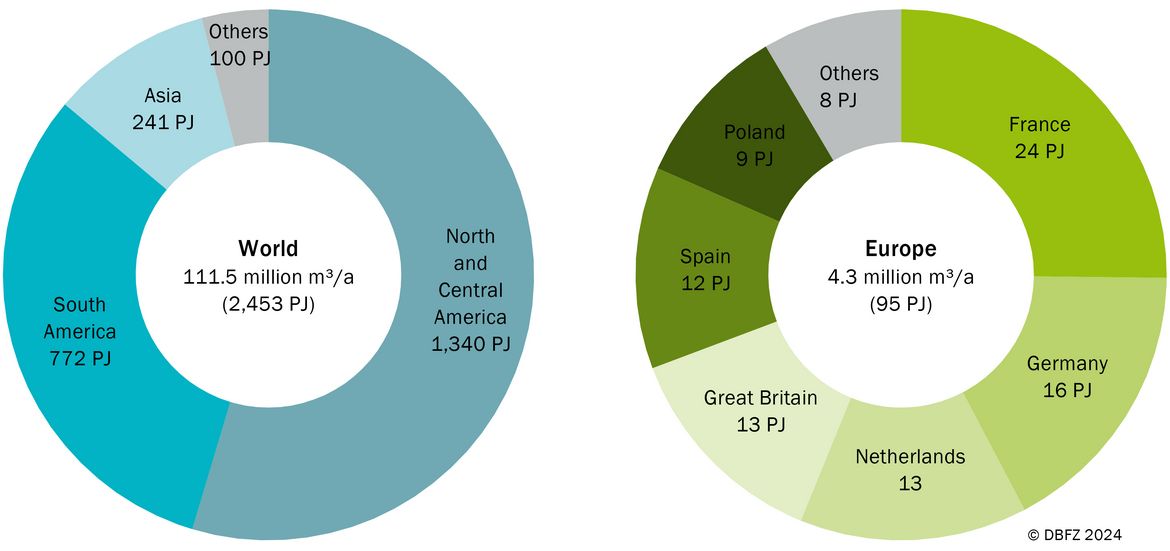
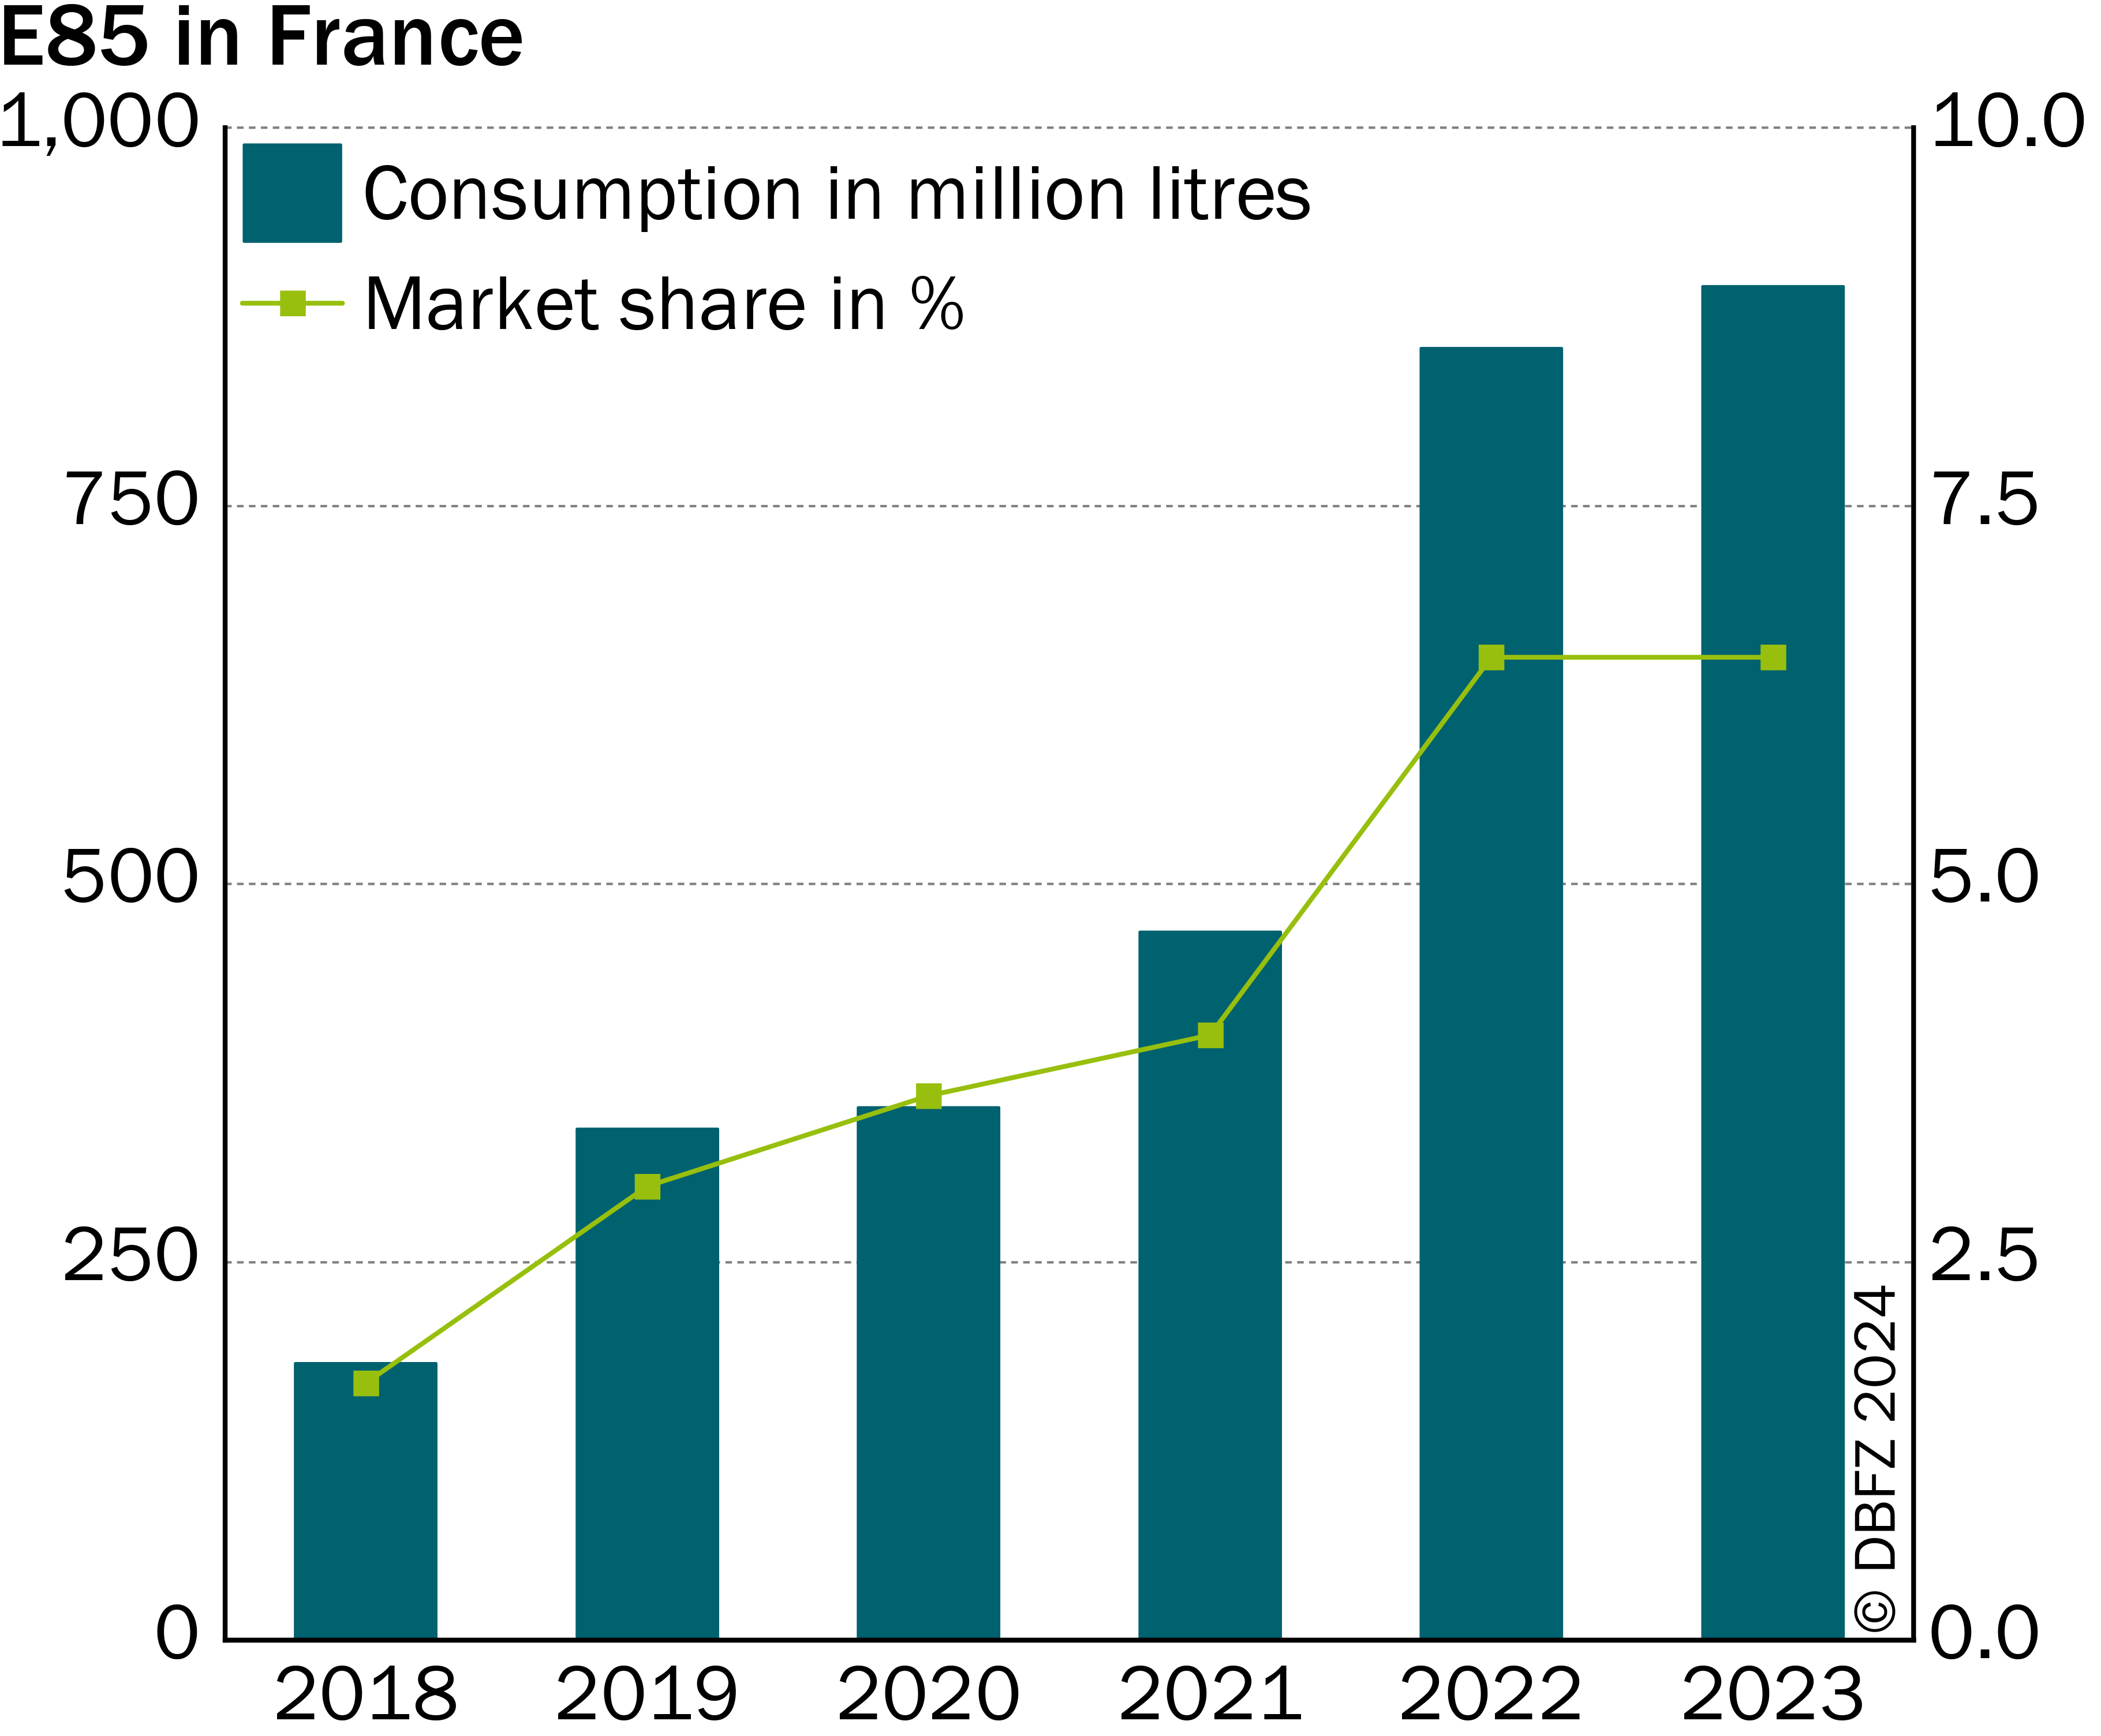
Chapter 6: Market indicators
Chapter 7: Application
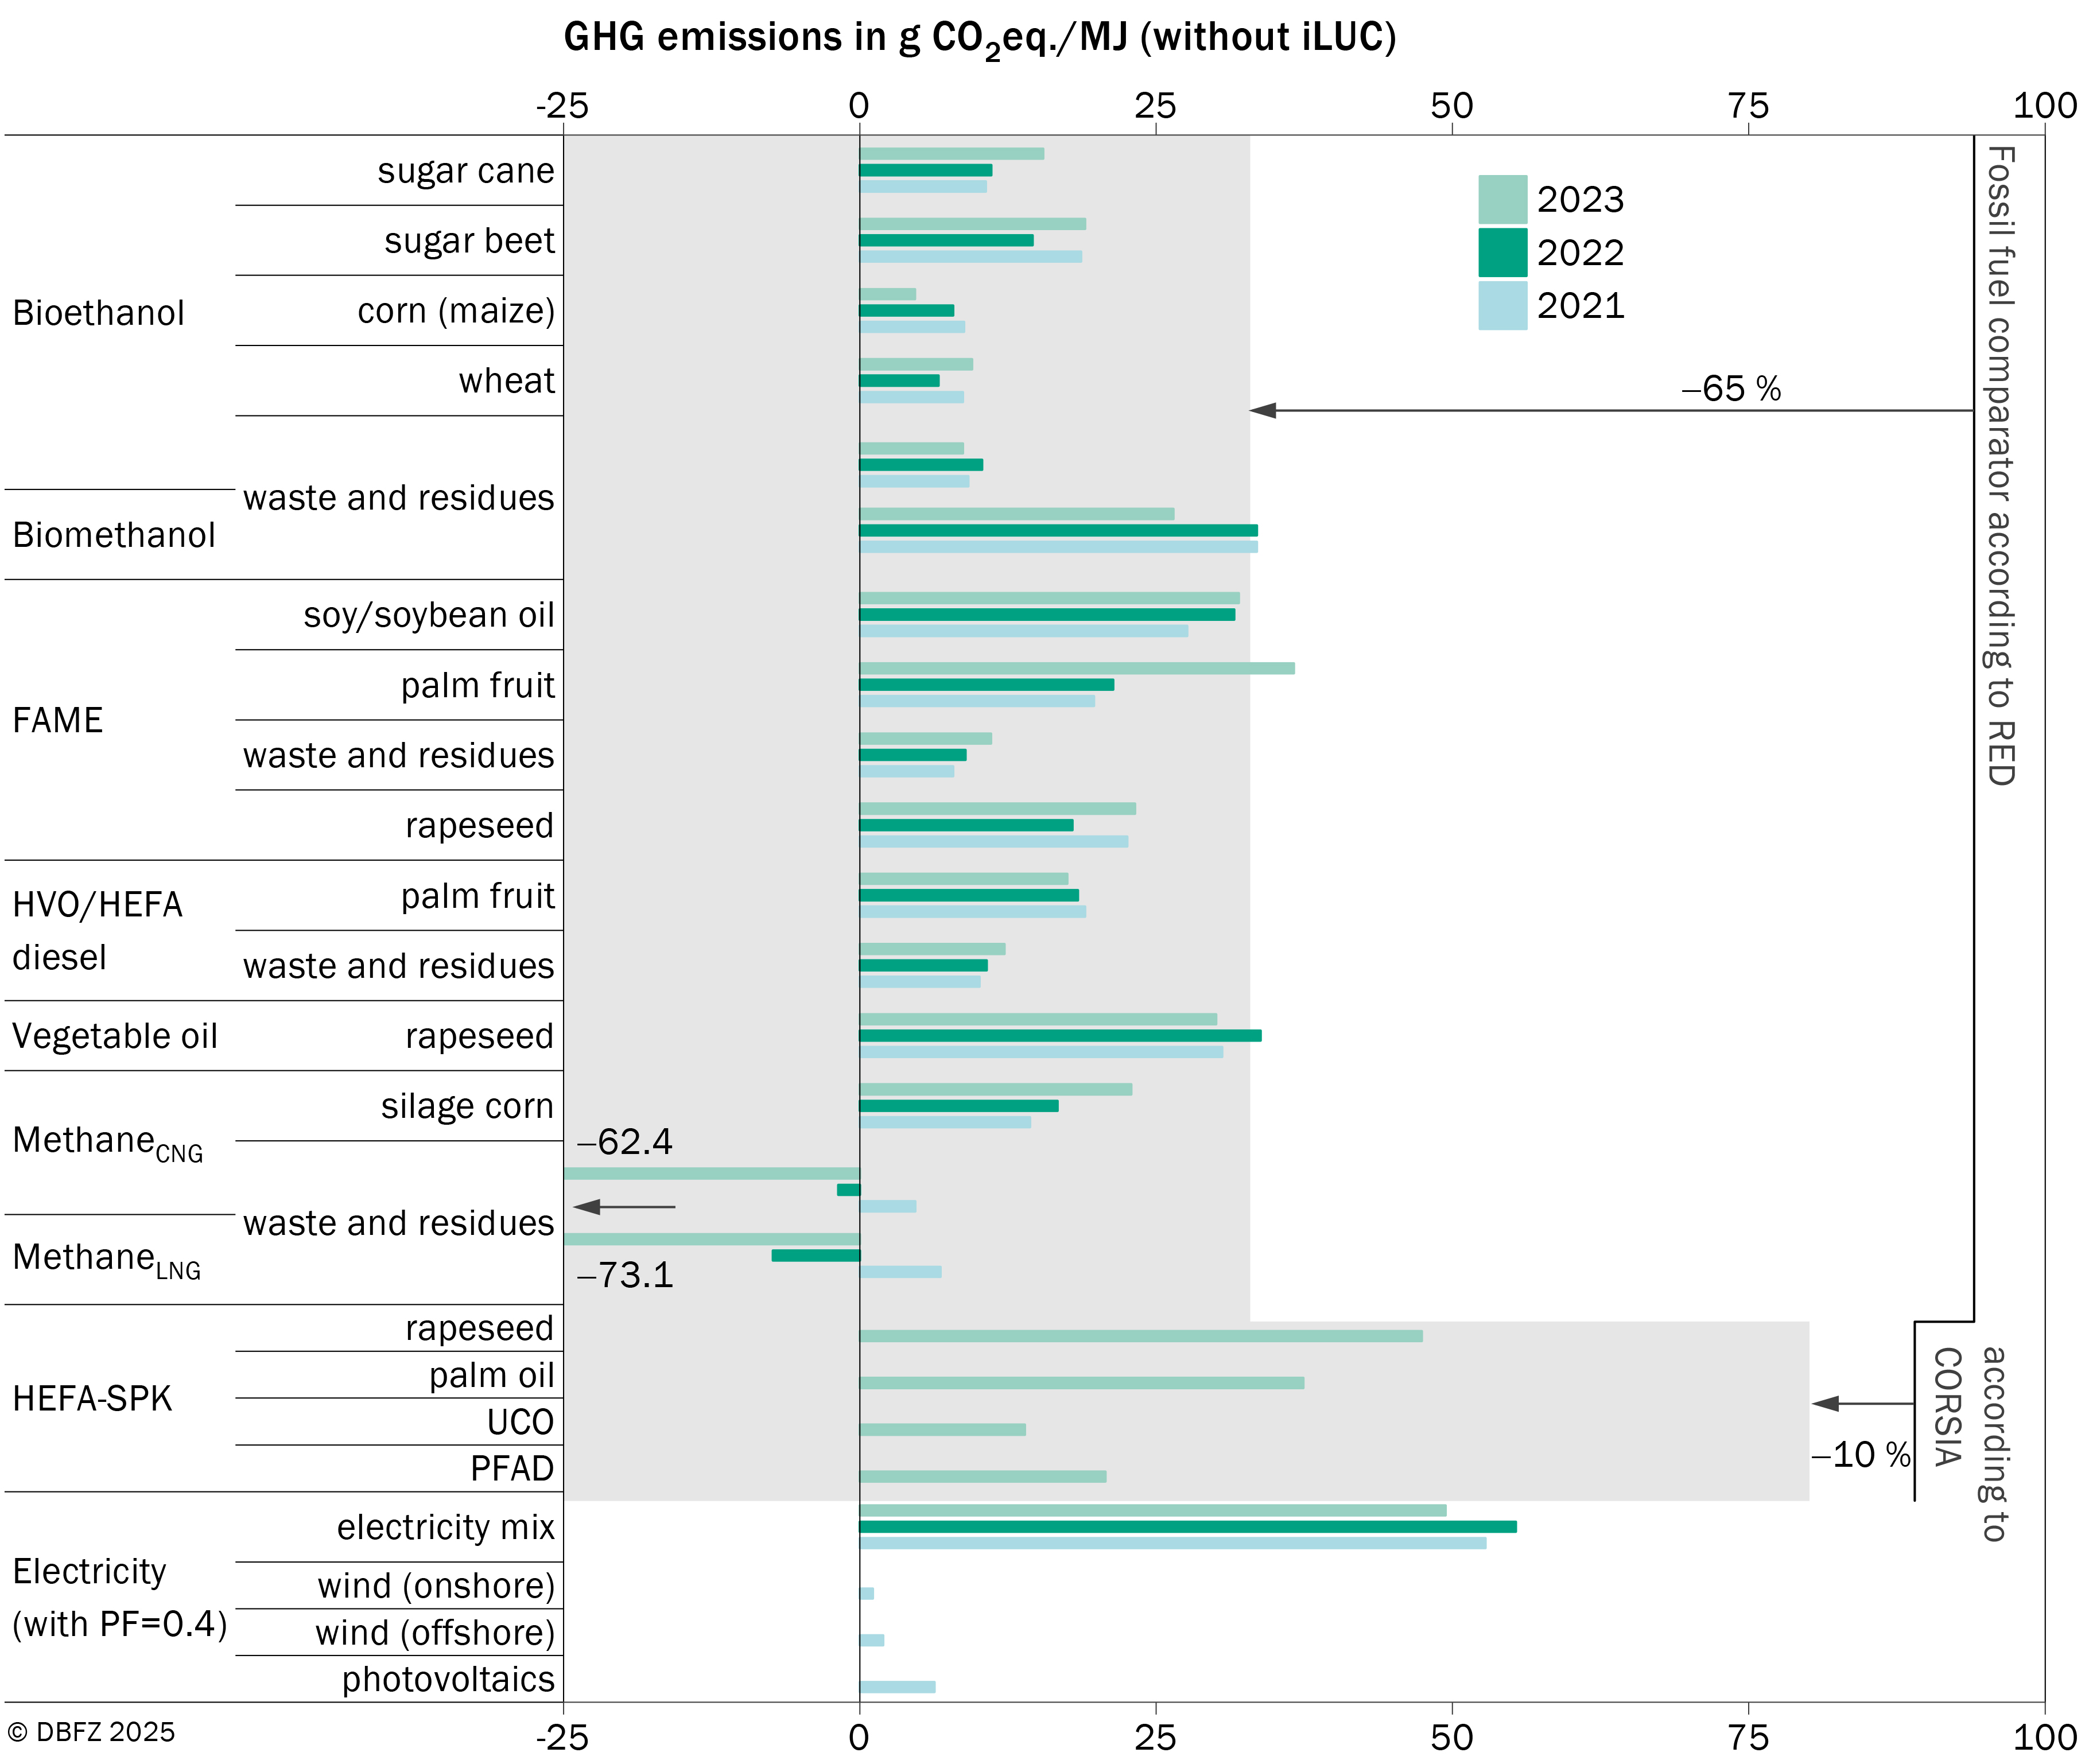
Chapter 8: Environmental assessment
Chapter 9: Economic evaluation and assessment
Summary
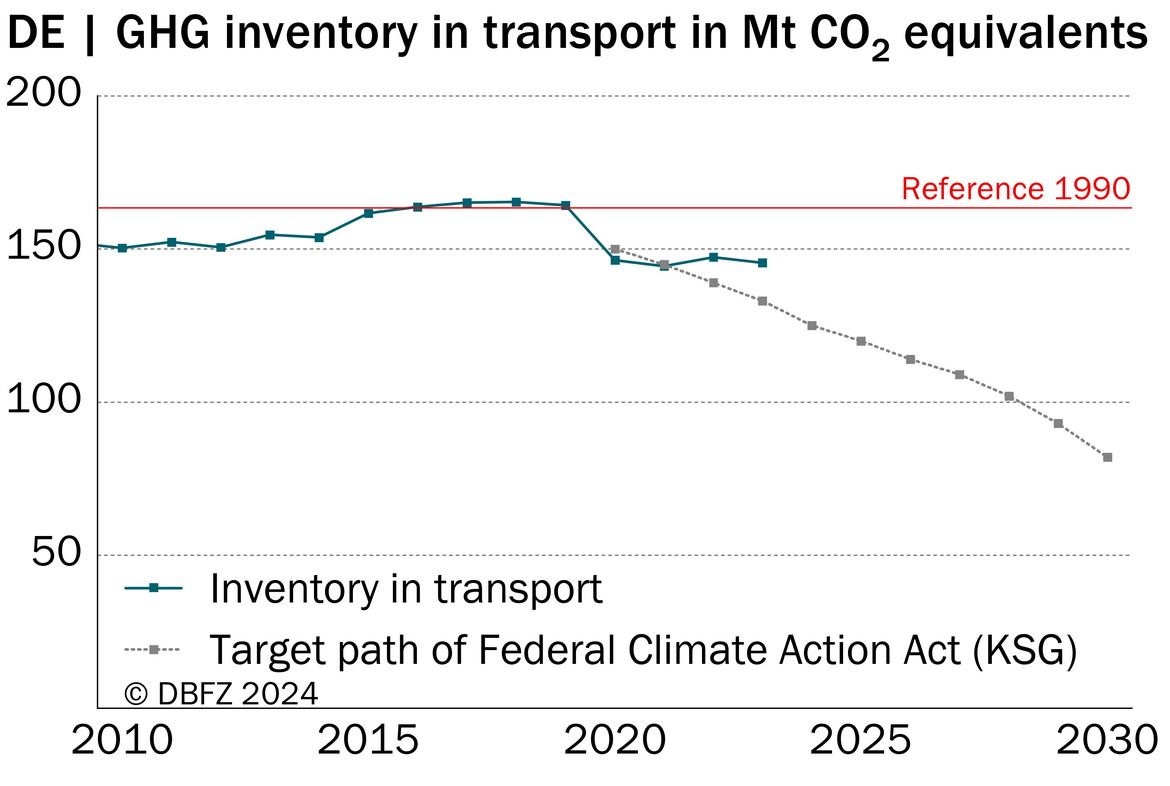
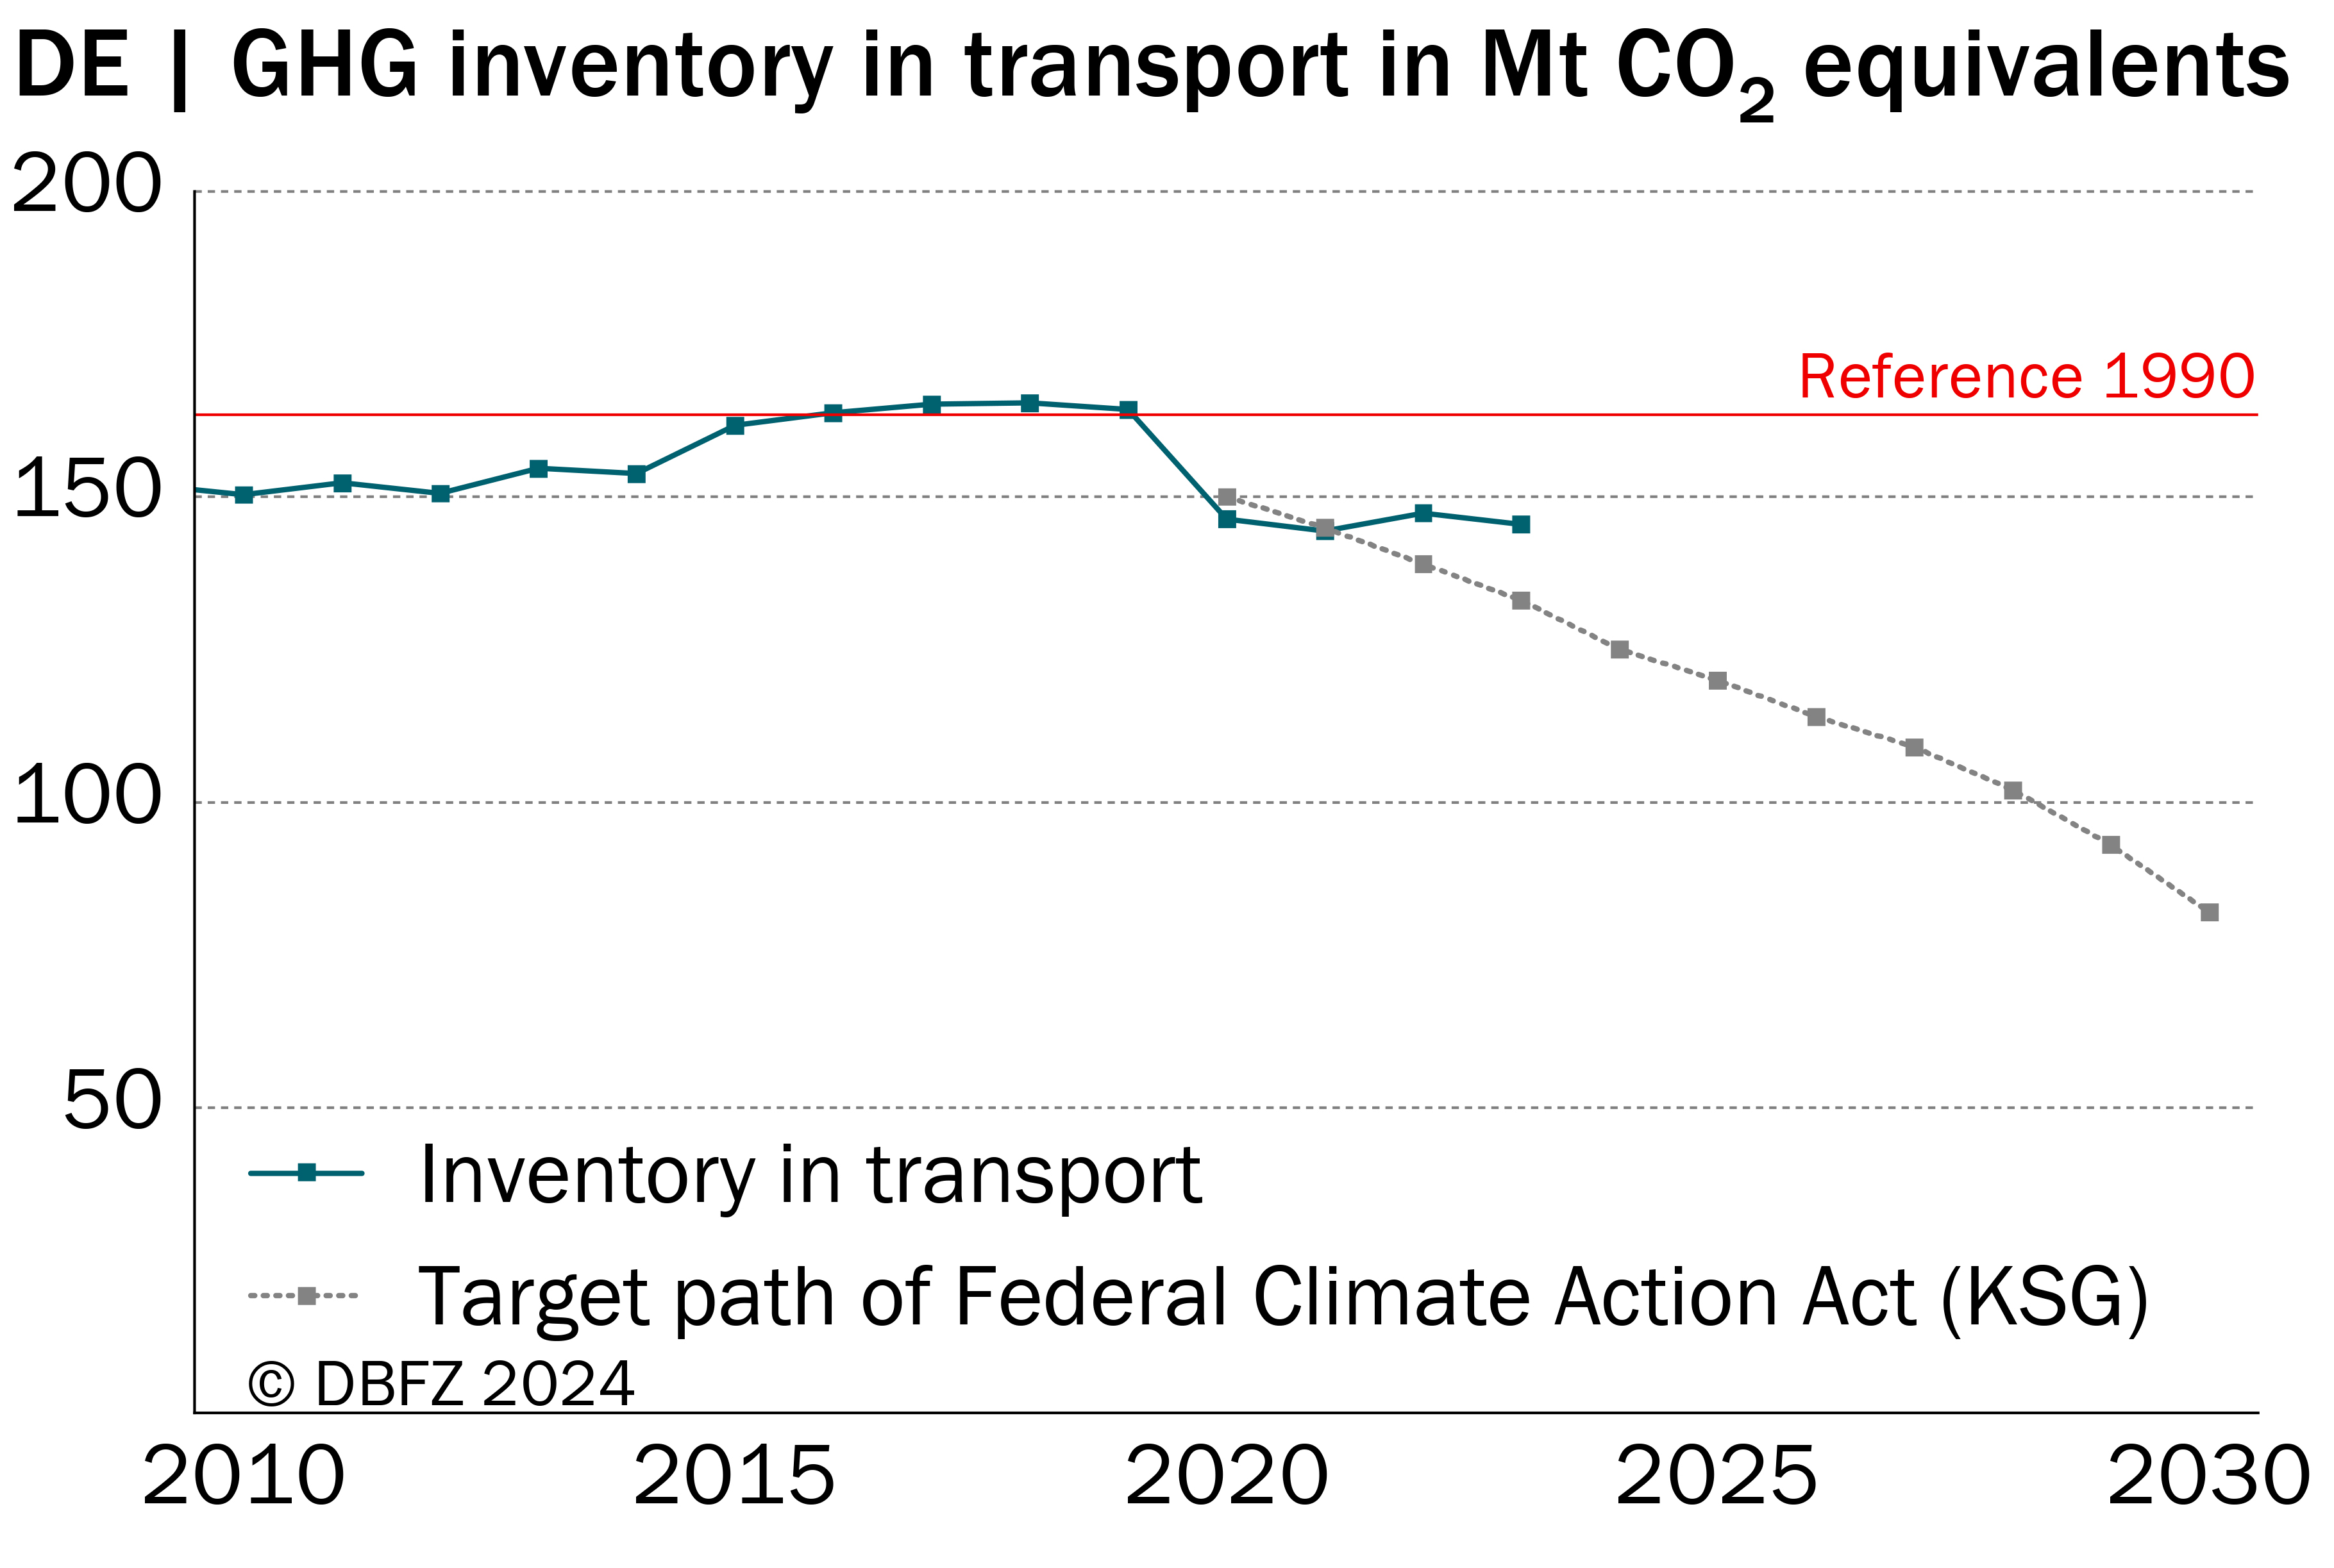
Chapter 1: The challenge of the energy transition in transport
When using the illustrations in Chapter 1, please cite them as follows:
Schröder, J.; Görsch, K.; Lenz, C. N. (2026): The challenge of energy transition in transport. In: Schröder, J.; Görsch, K. (eds.): Renewable Energies in Transport. Monitoring Report. pp. 5-21. Leipzig: DBFZ. ISBN: 978-3-949807-36-7. DOI: 10.48480/45hp-x131


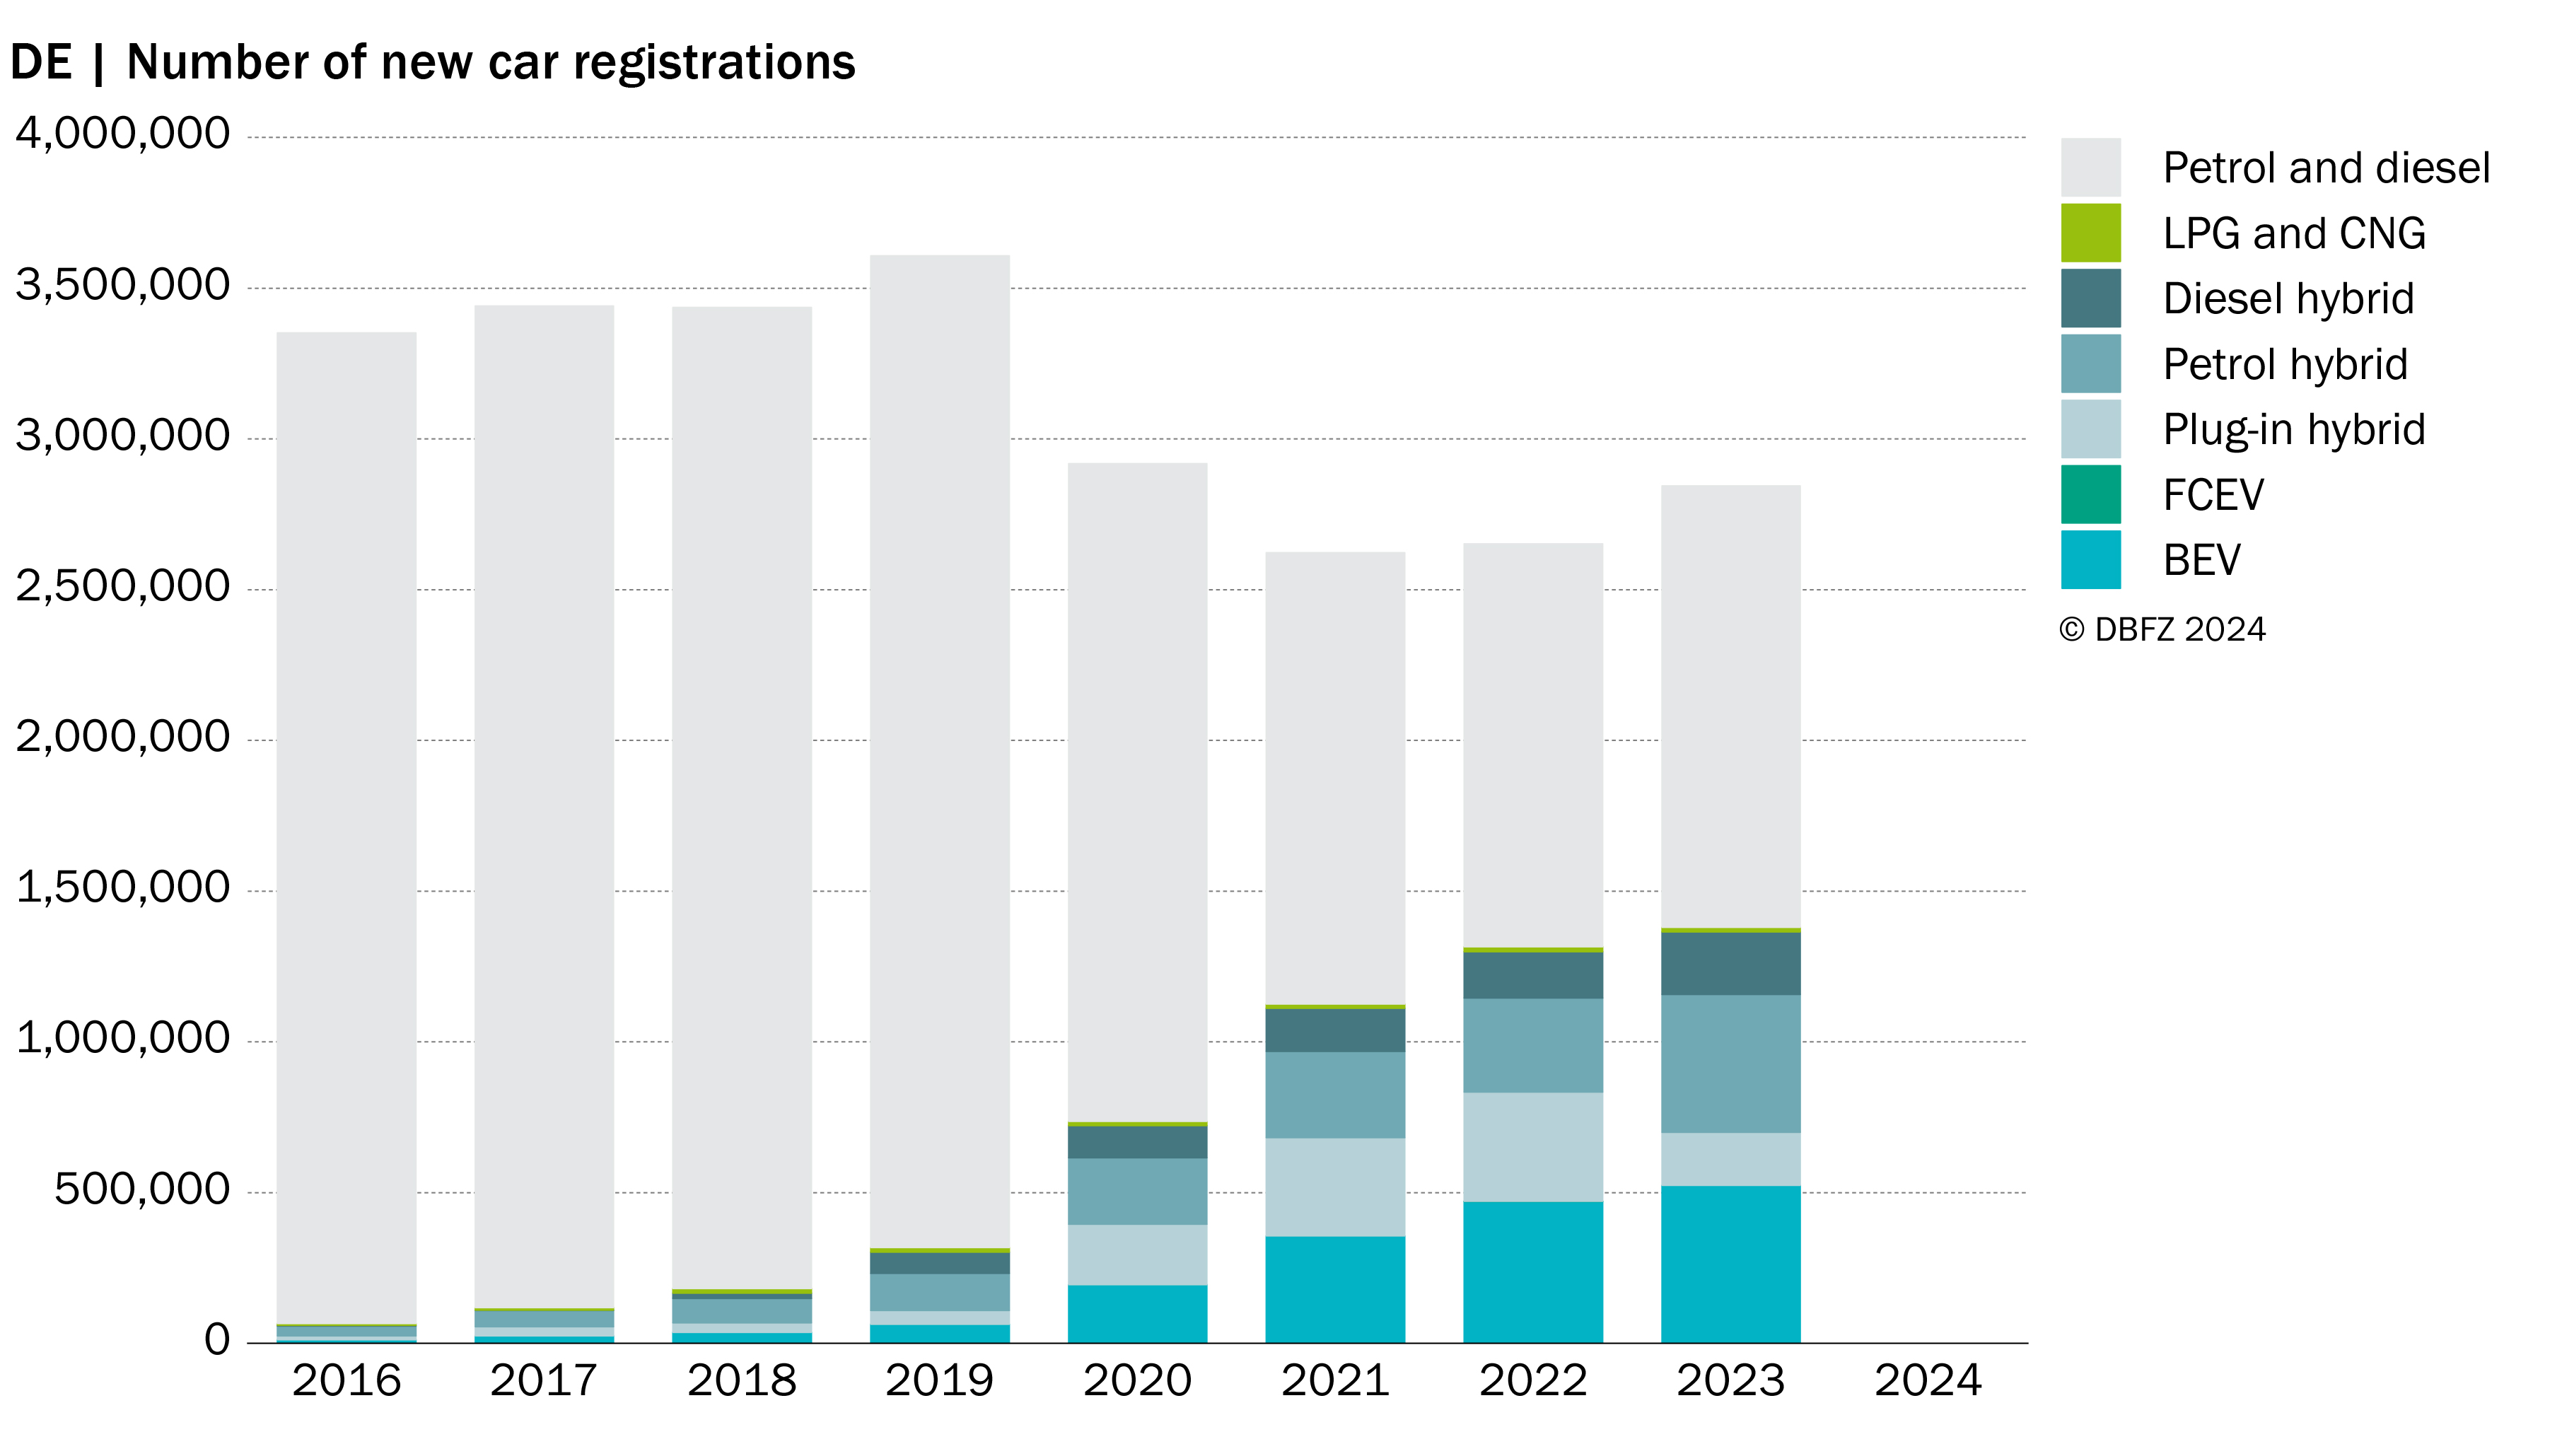
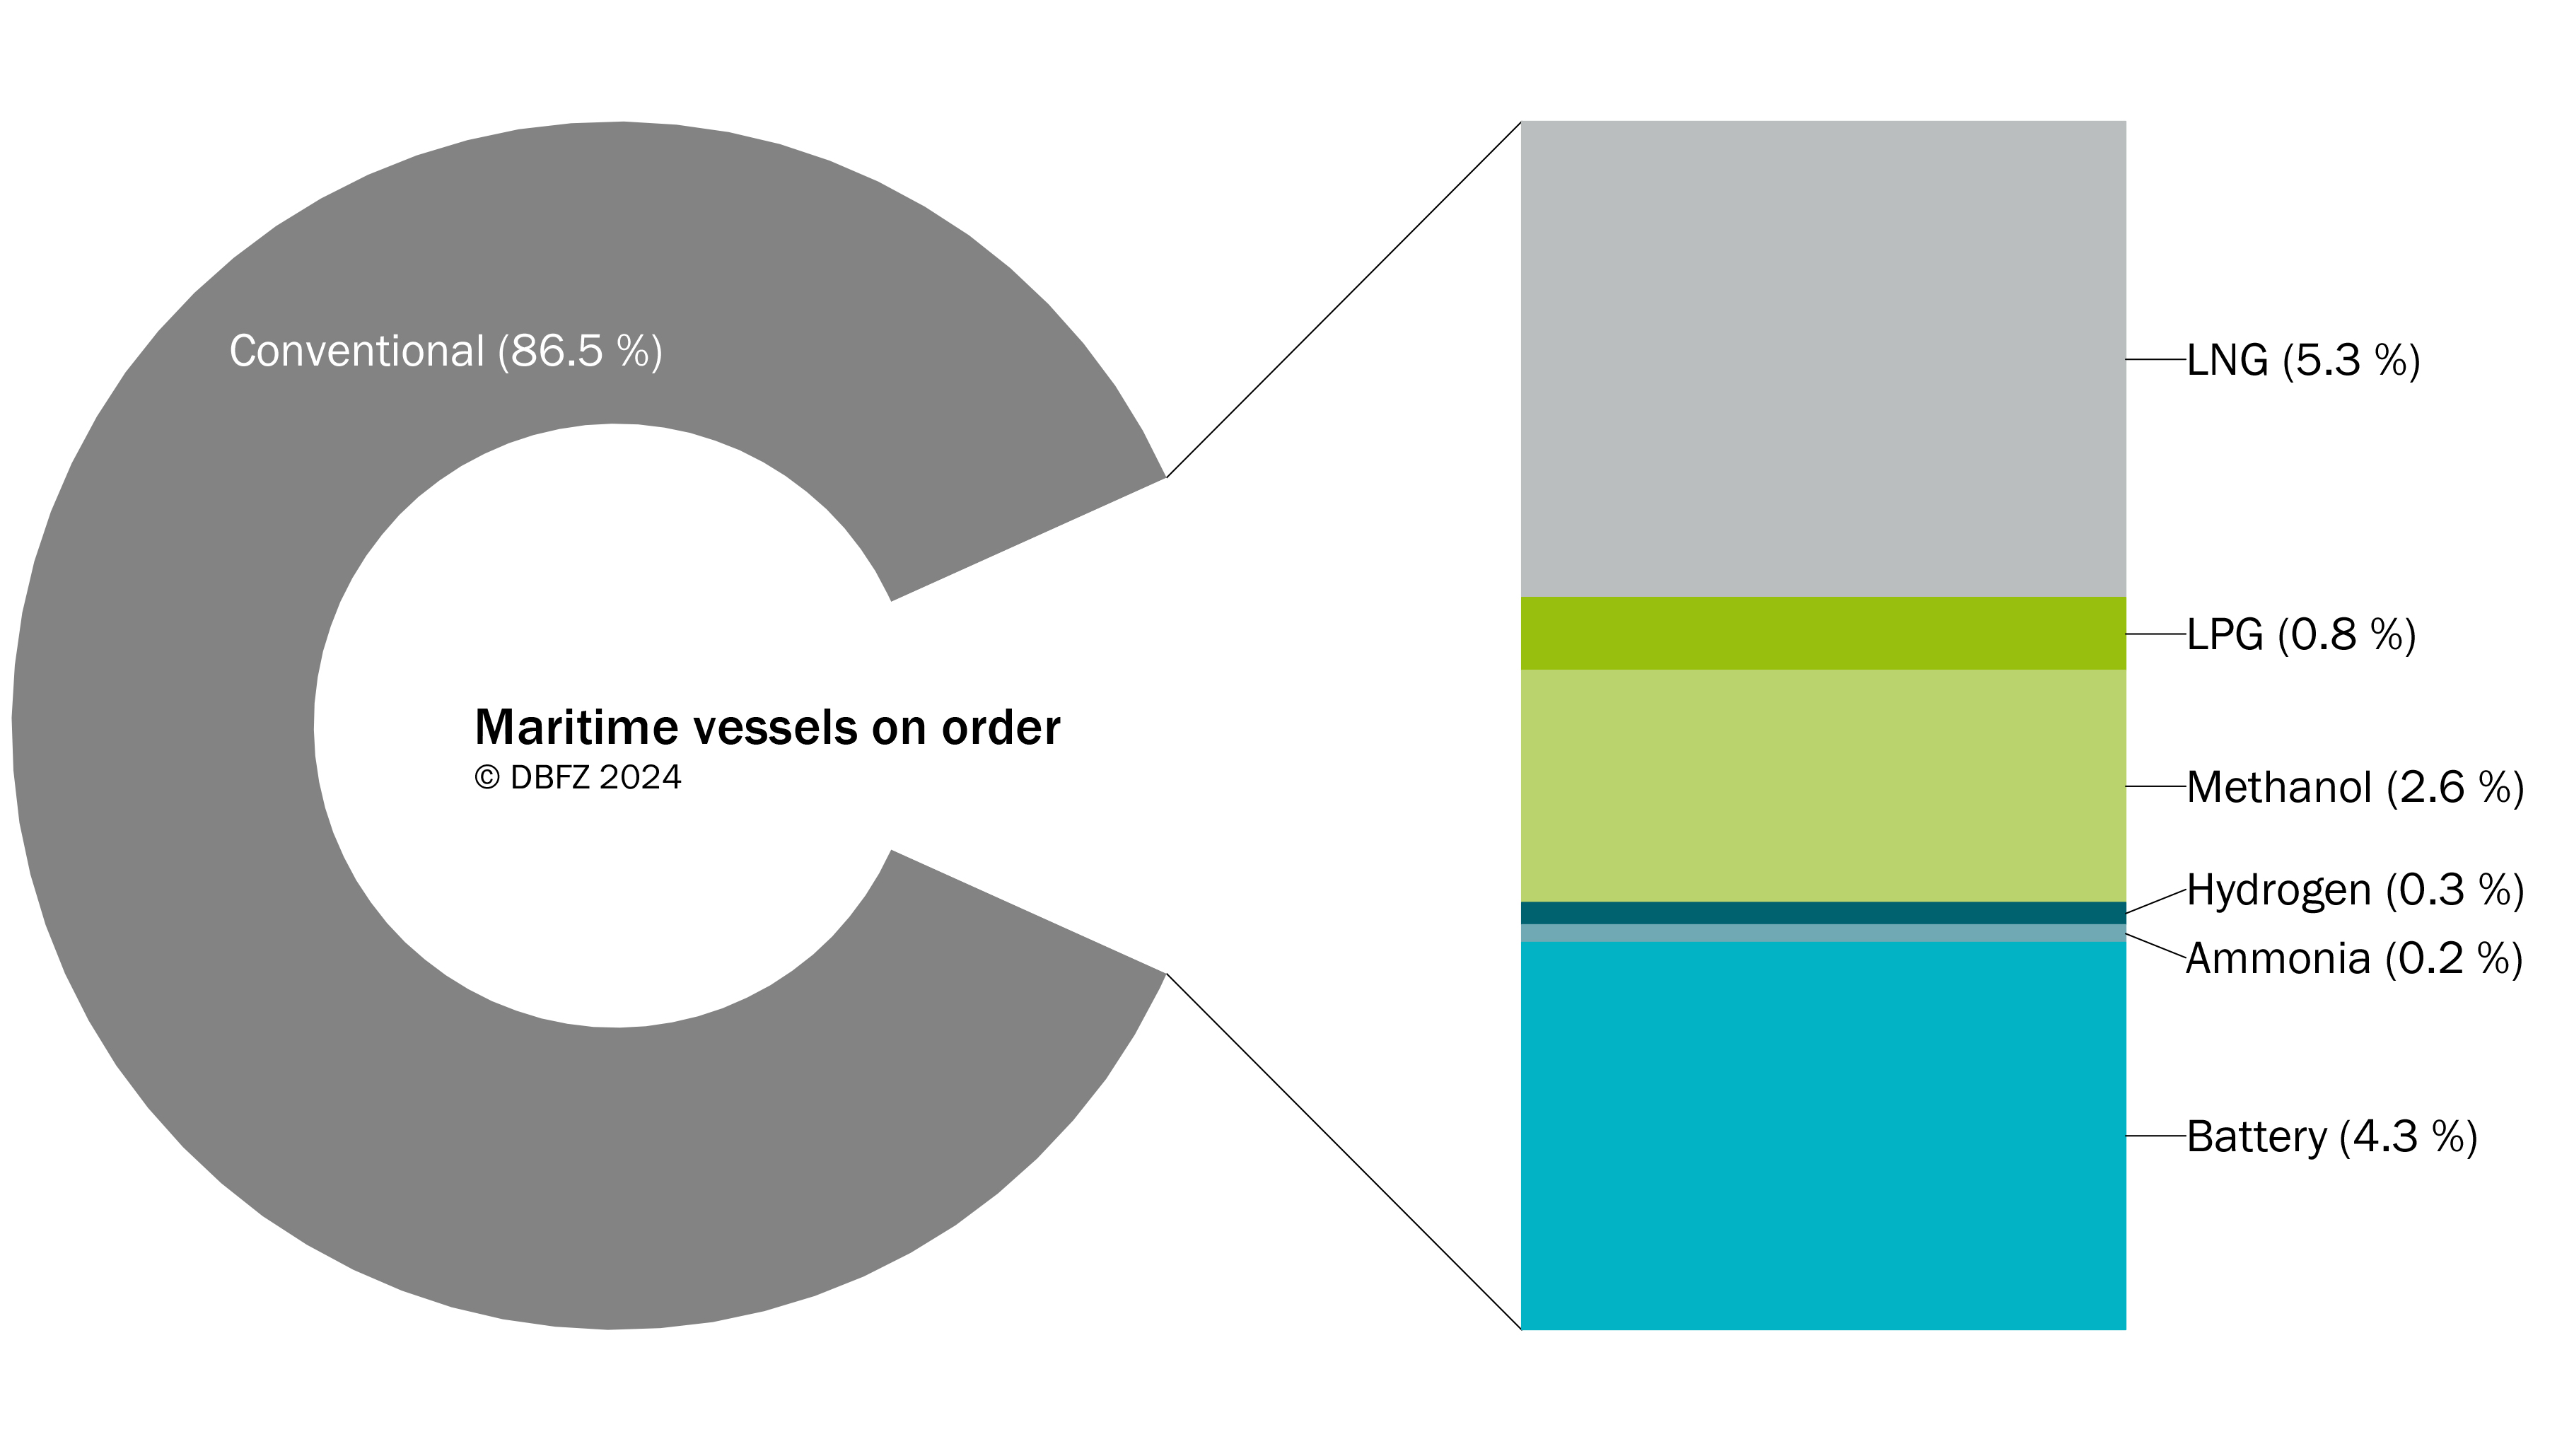
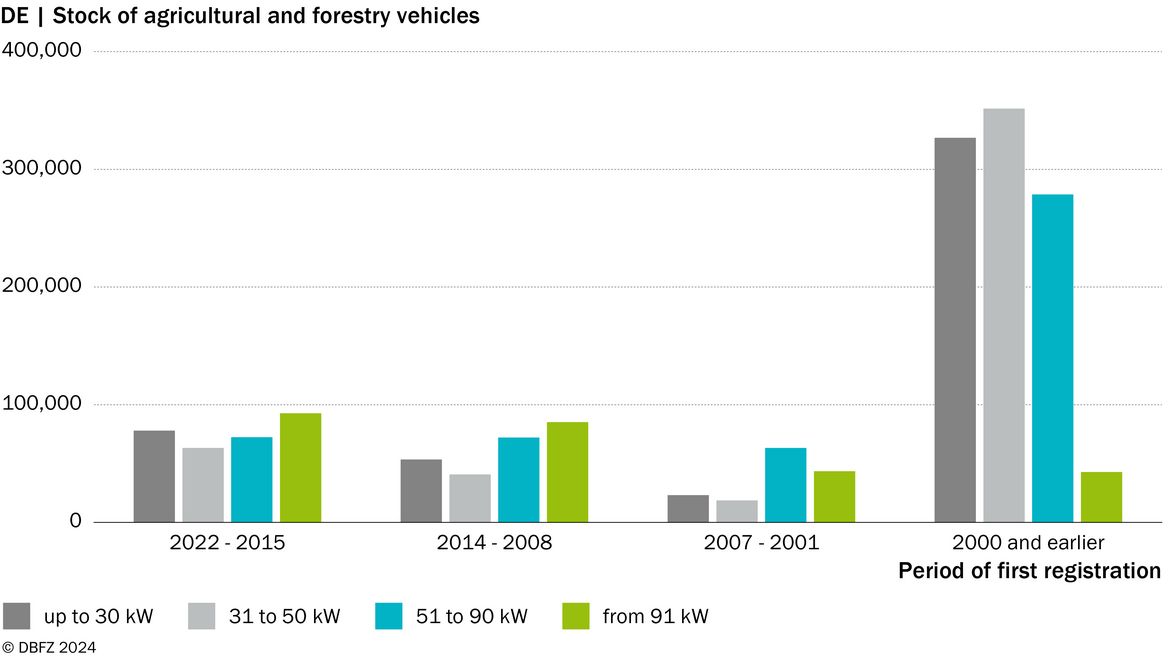
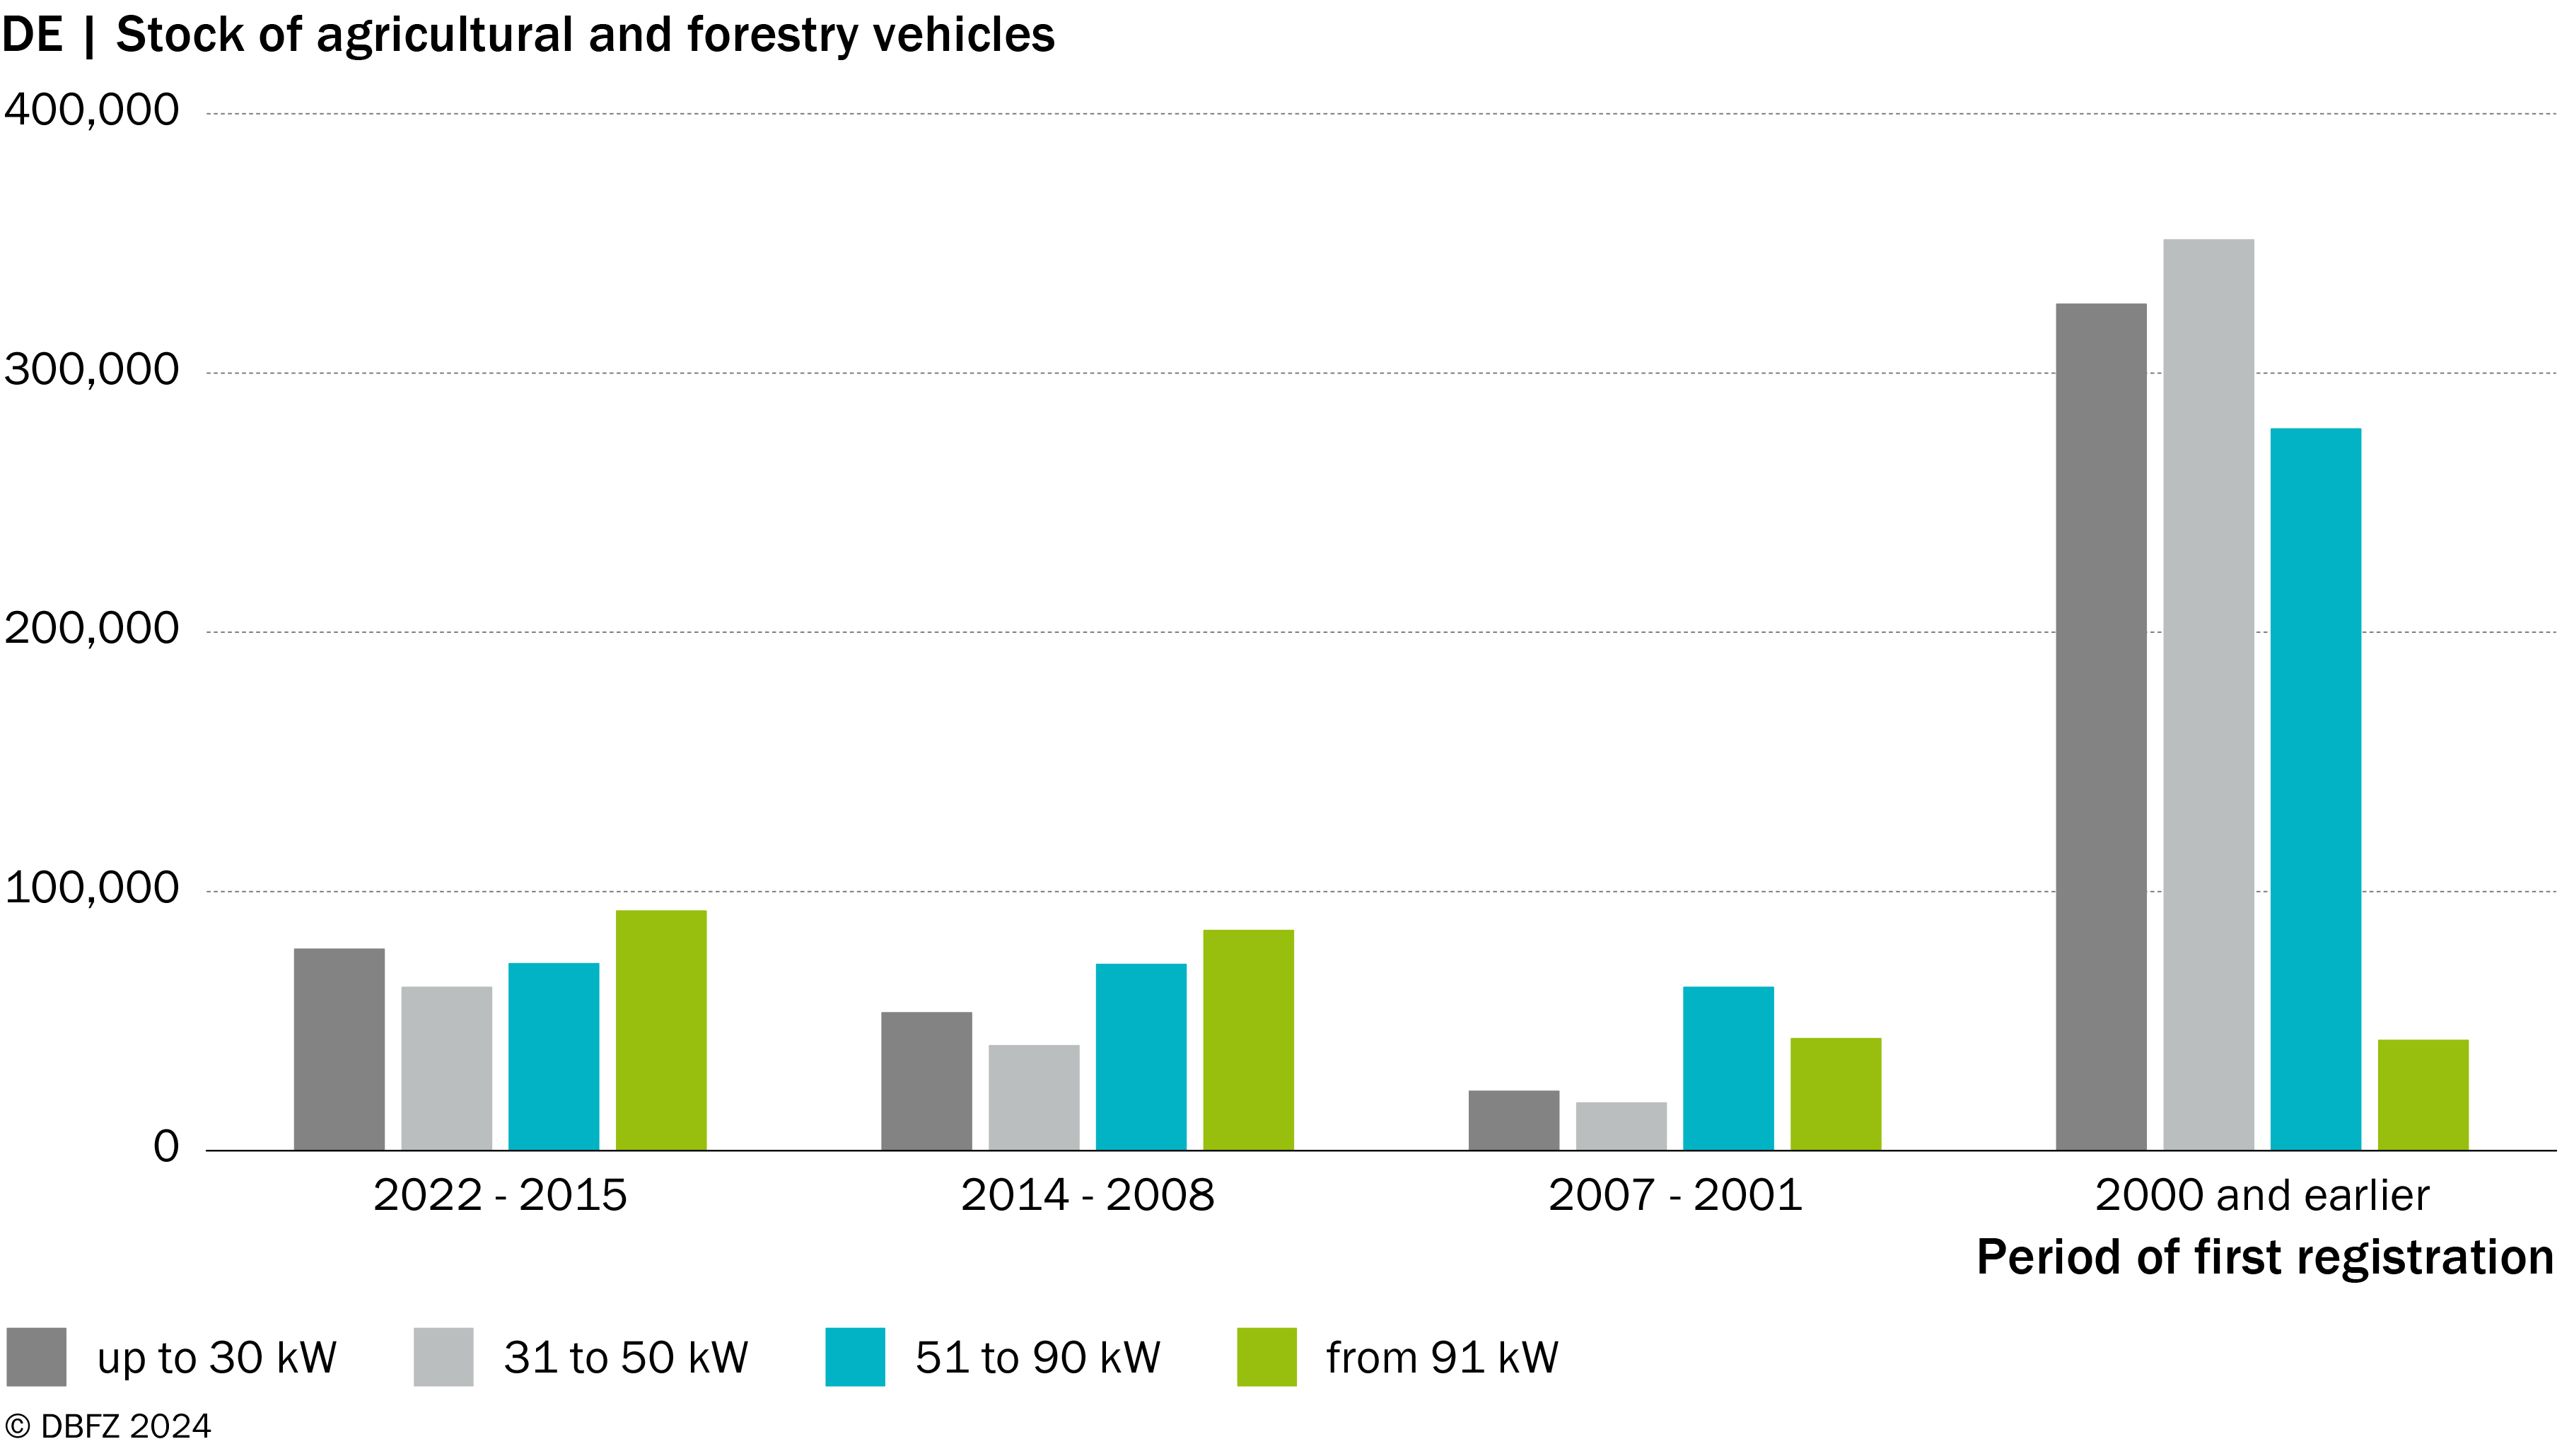
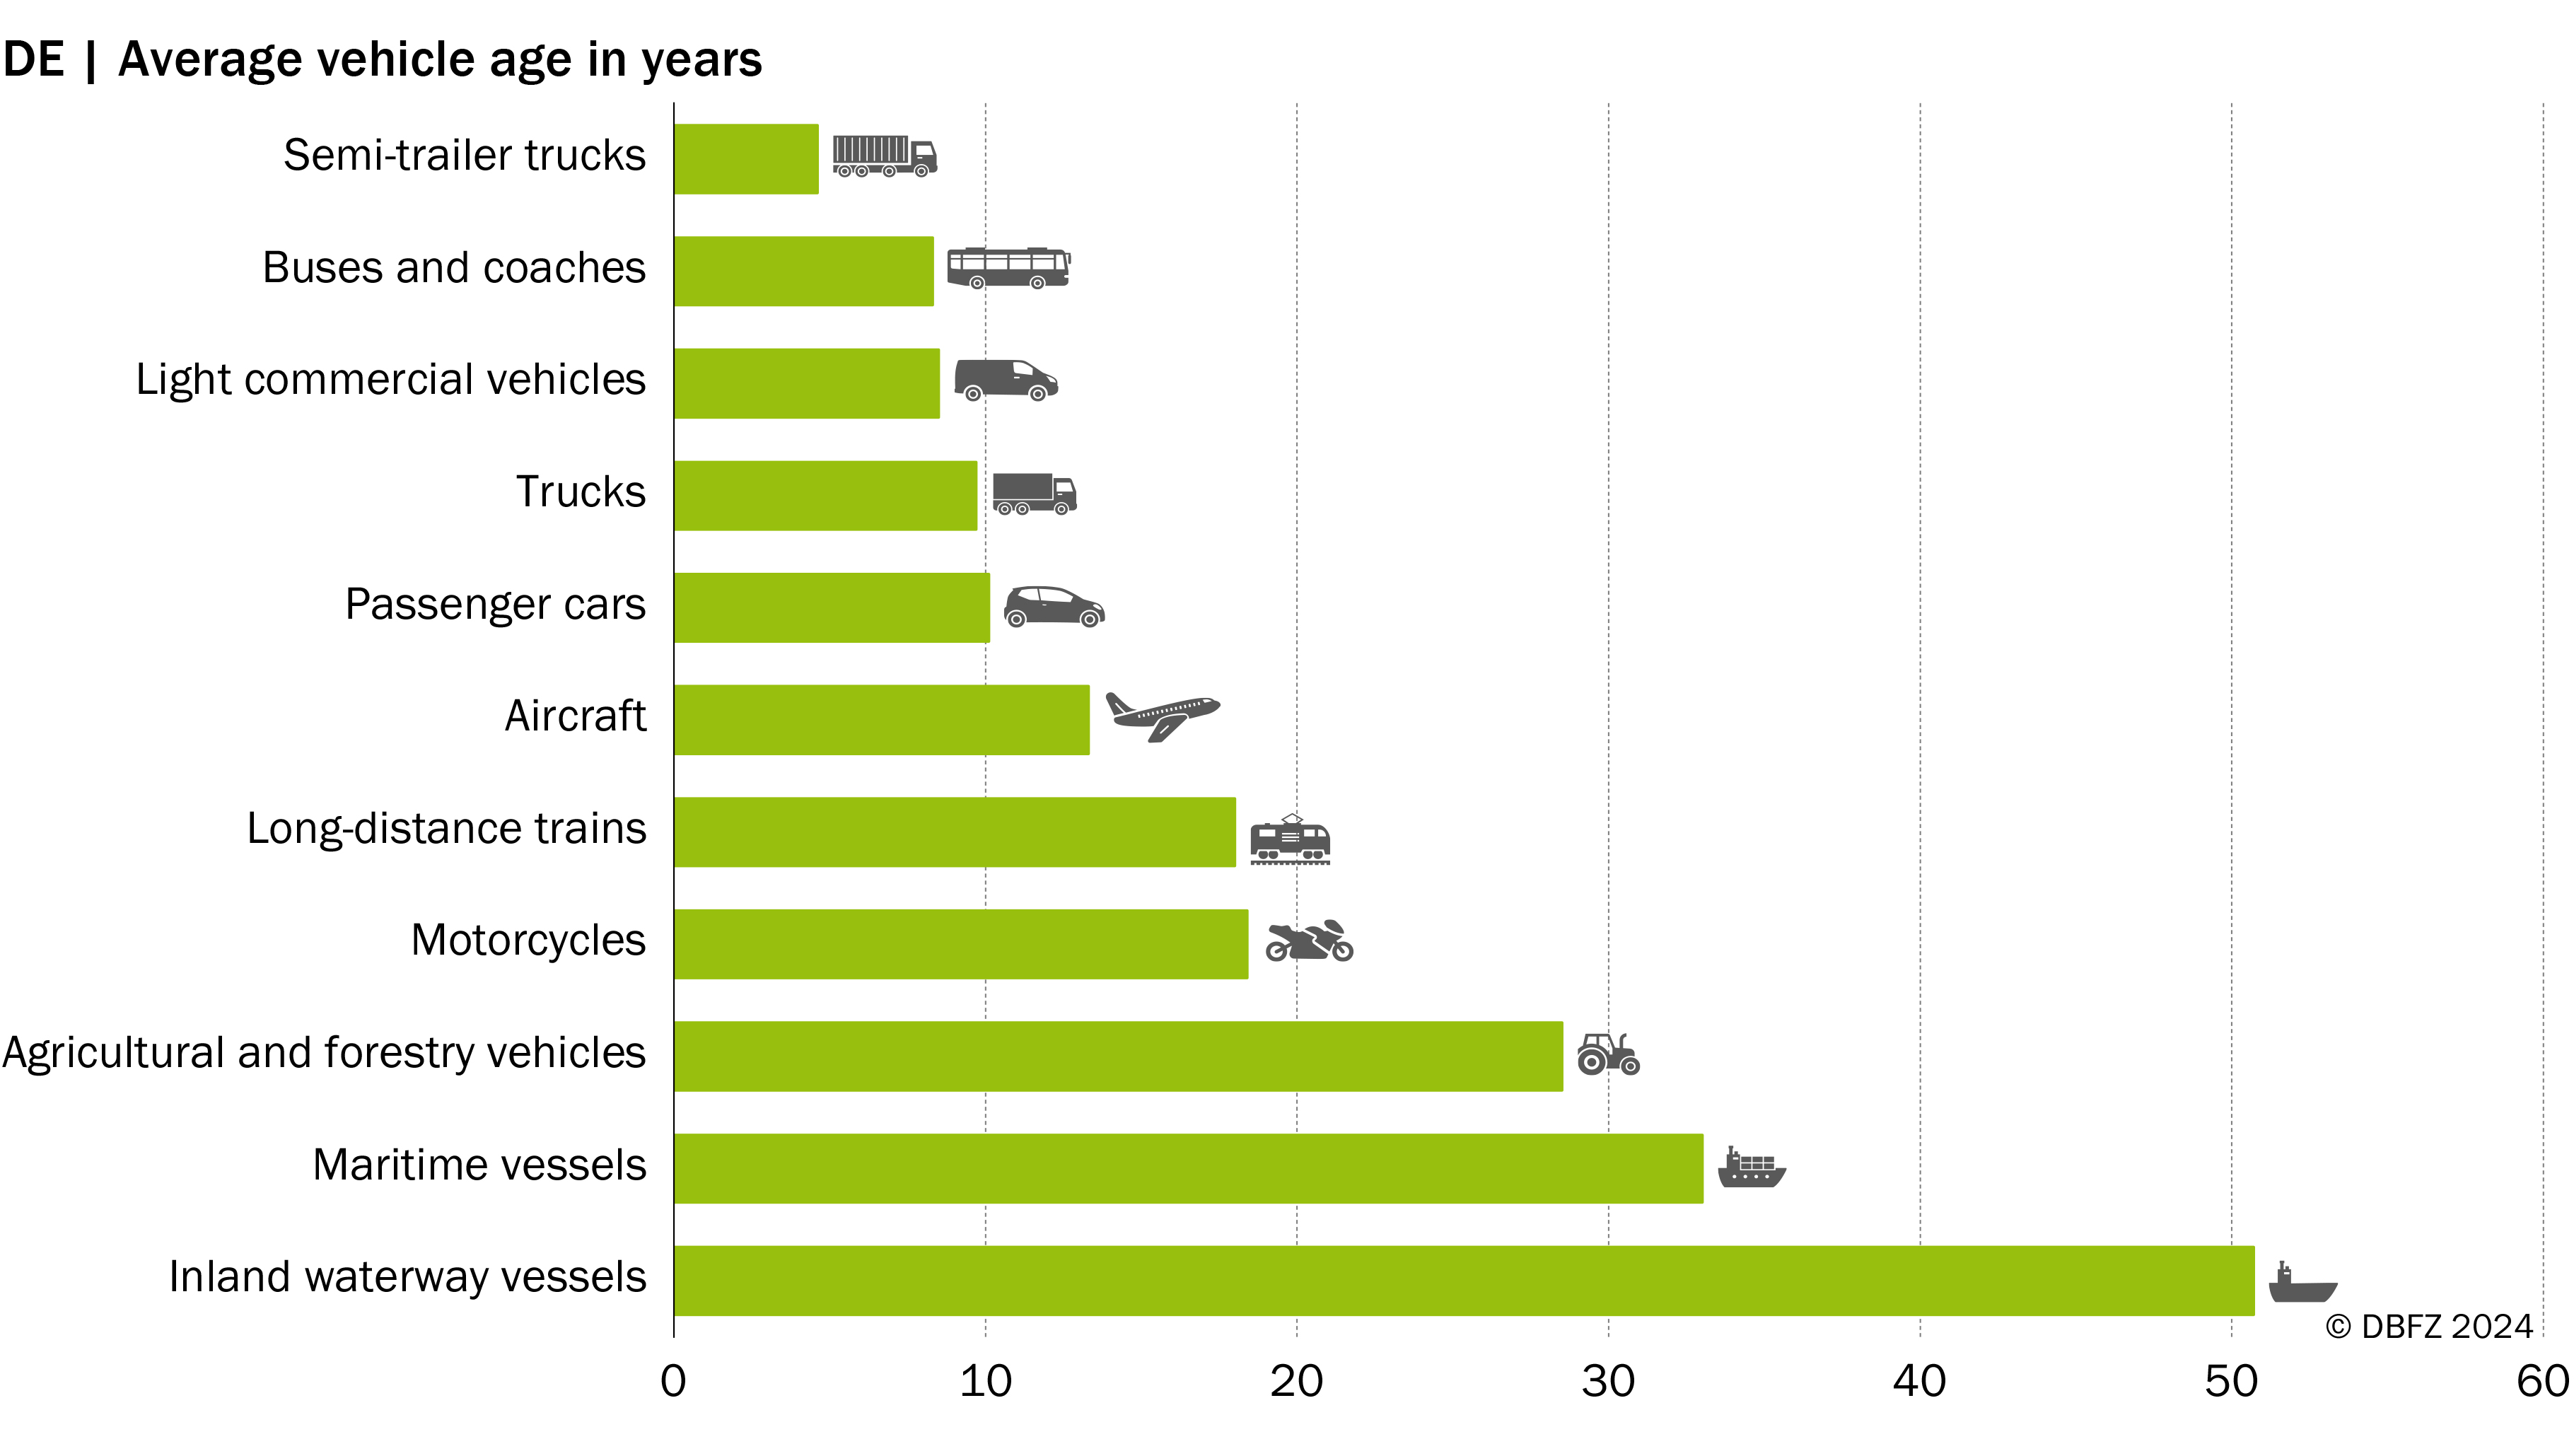
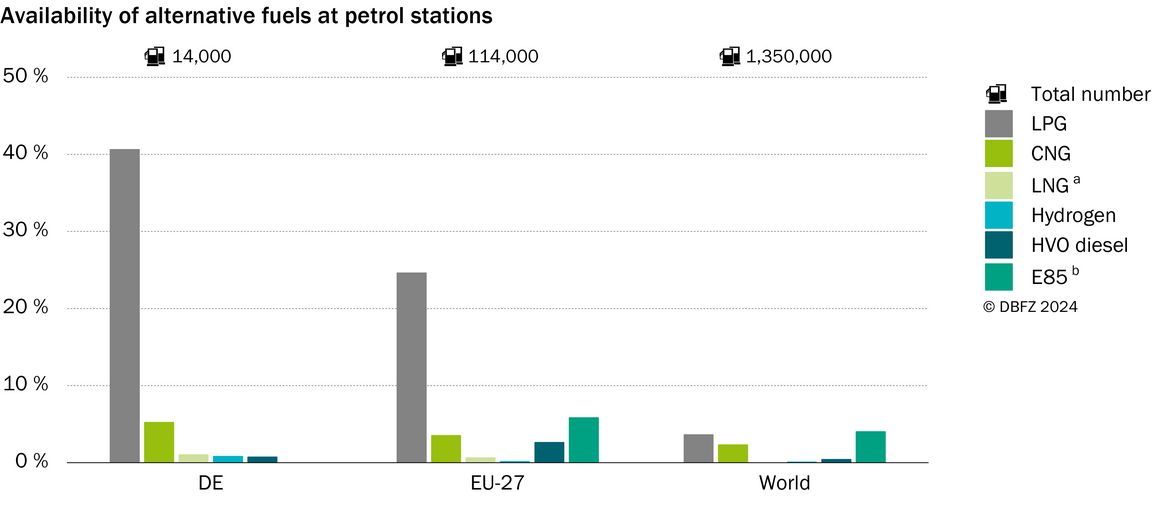
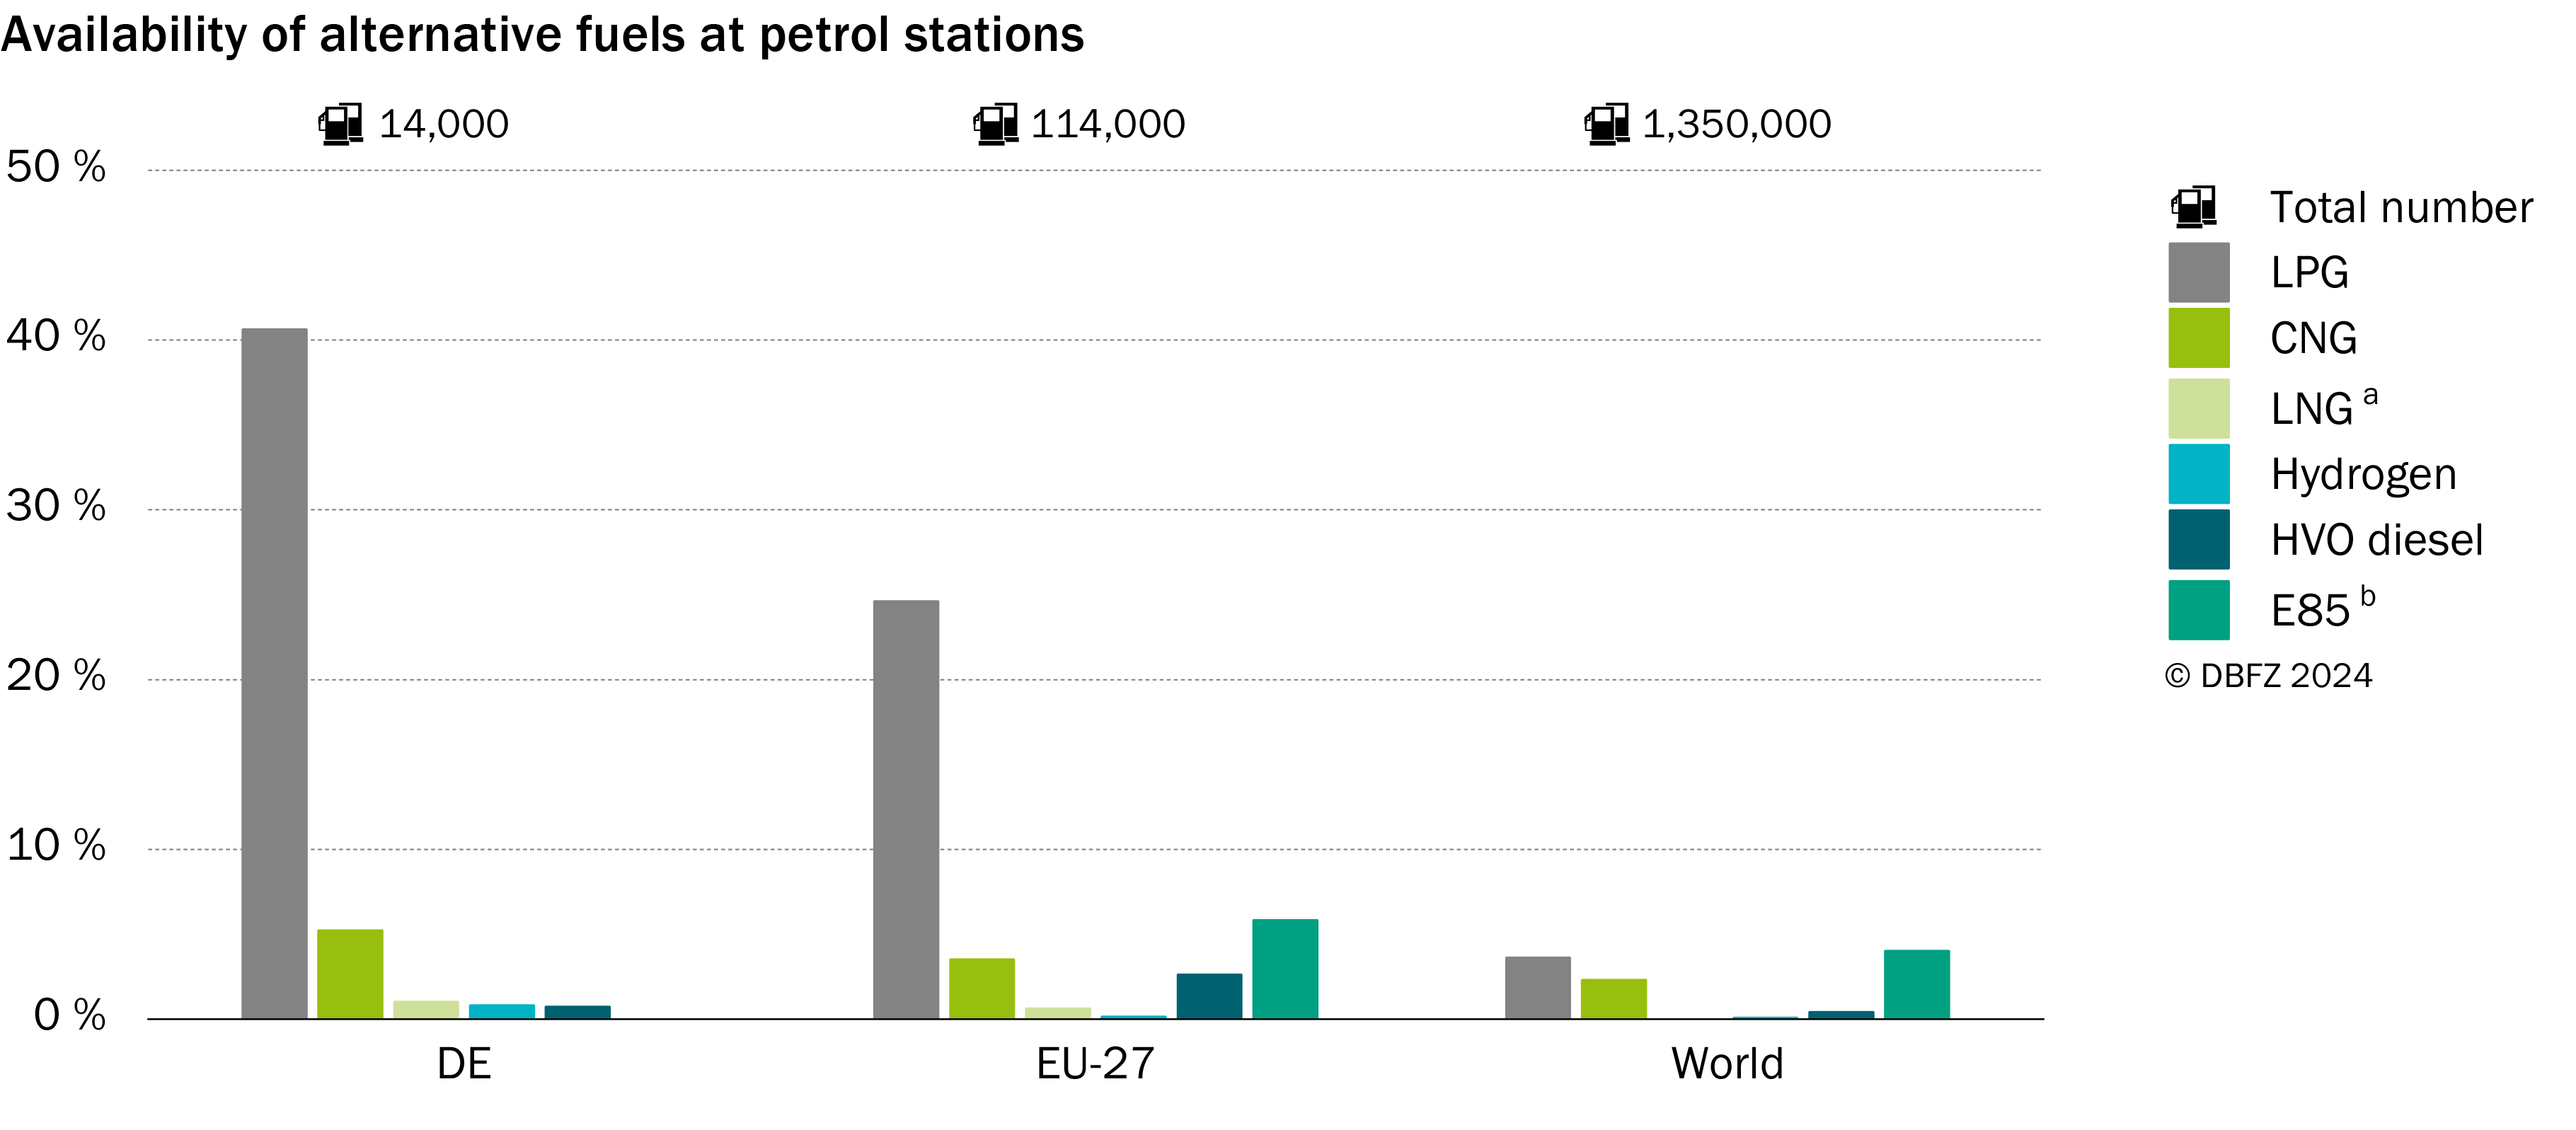
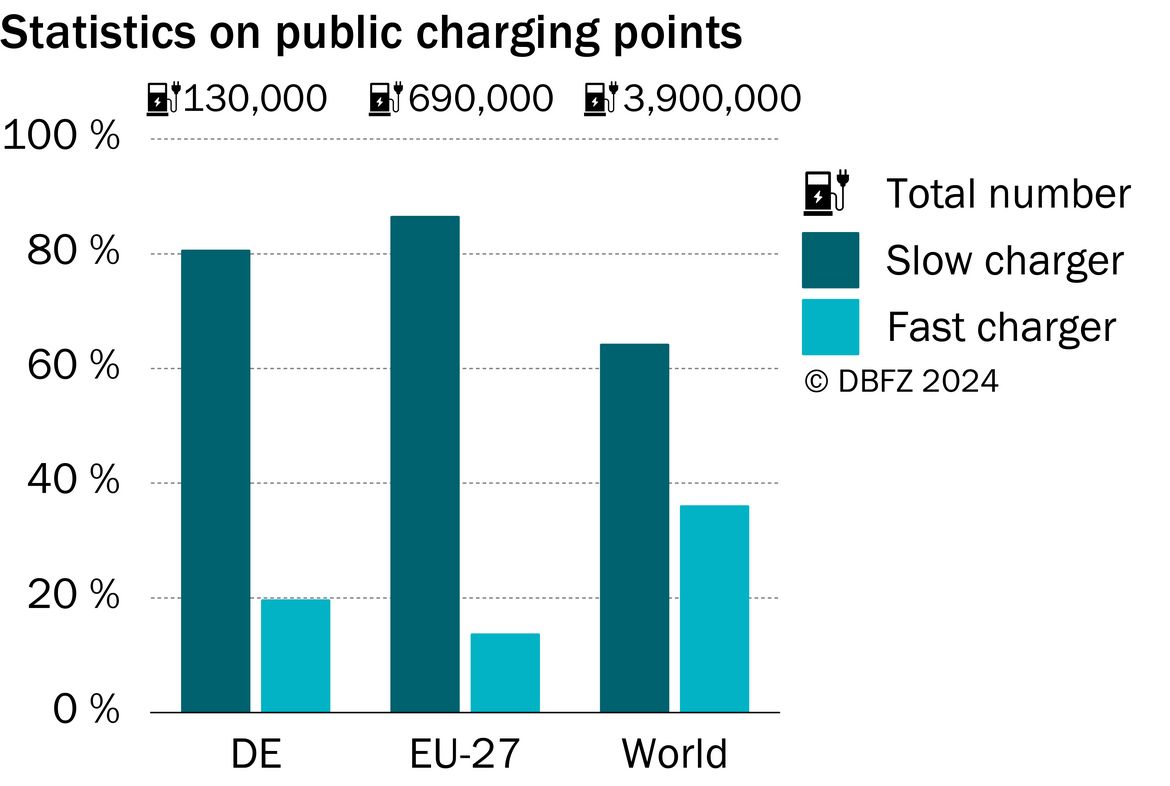
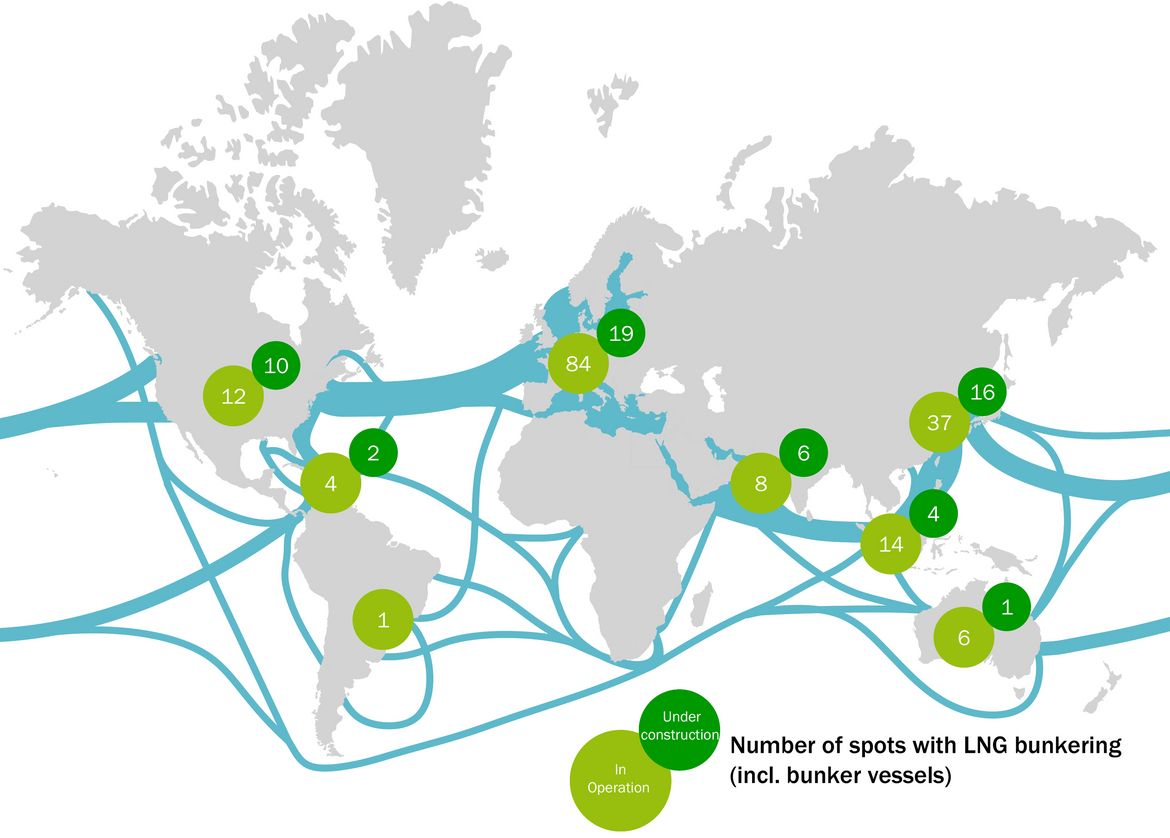
Chapter 2: Transport and its infrastructure
When using the illustrations in Chapter 2, please cite them as follows:
Schröder, J.; Görsch, K. (2026): Transport and its infrastructure. In: Schröder, J.; Görsch, K. (eds.): Renewable Energies in Transport. Monitoring Report. pp. 22-32. Leipzig: DBFZ. ISBN: 978-3-949807-36-7. DOI: 10.48480/45hp-x131


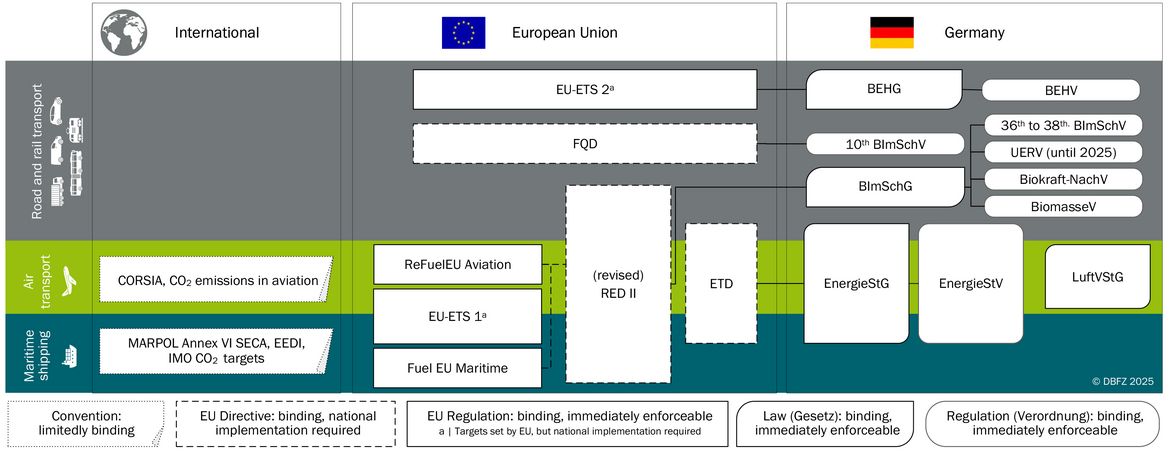
Chapter 3: Political and legal framework
When using the illustrations in Chapter 3, please cite them as follows:
Dögnitz, N.; Görsch, K.; Naumann, K. (2026): Political and legal framework. In: Schröder, J.; Görsch, K. (eds.): Renewable Energies in Transport. Monitoring Report. pp. 33-53. Leipzig: DBFZ. ISBN: 978-3-949807-36-7. DOI: 10.48480/45hp-x131

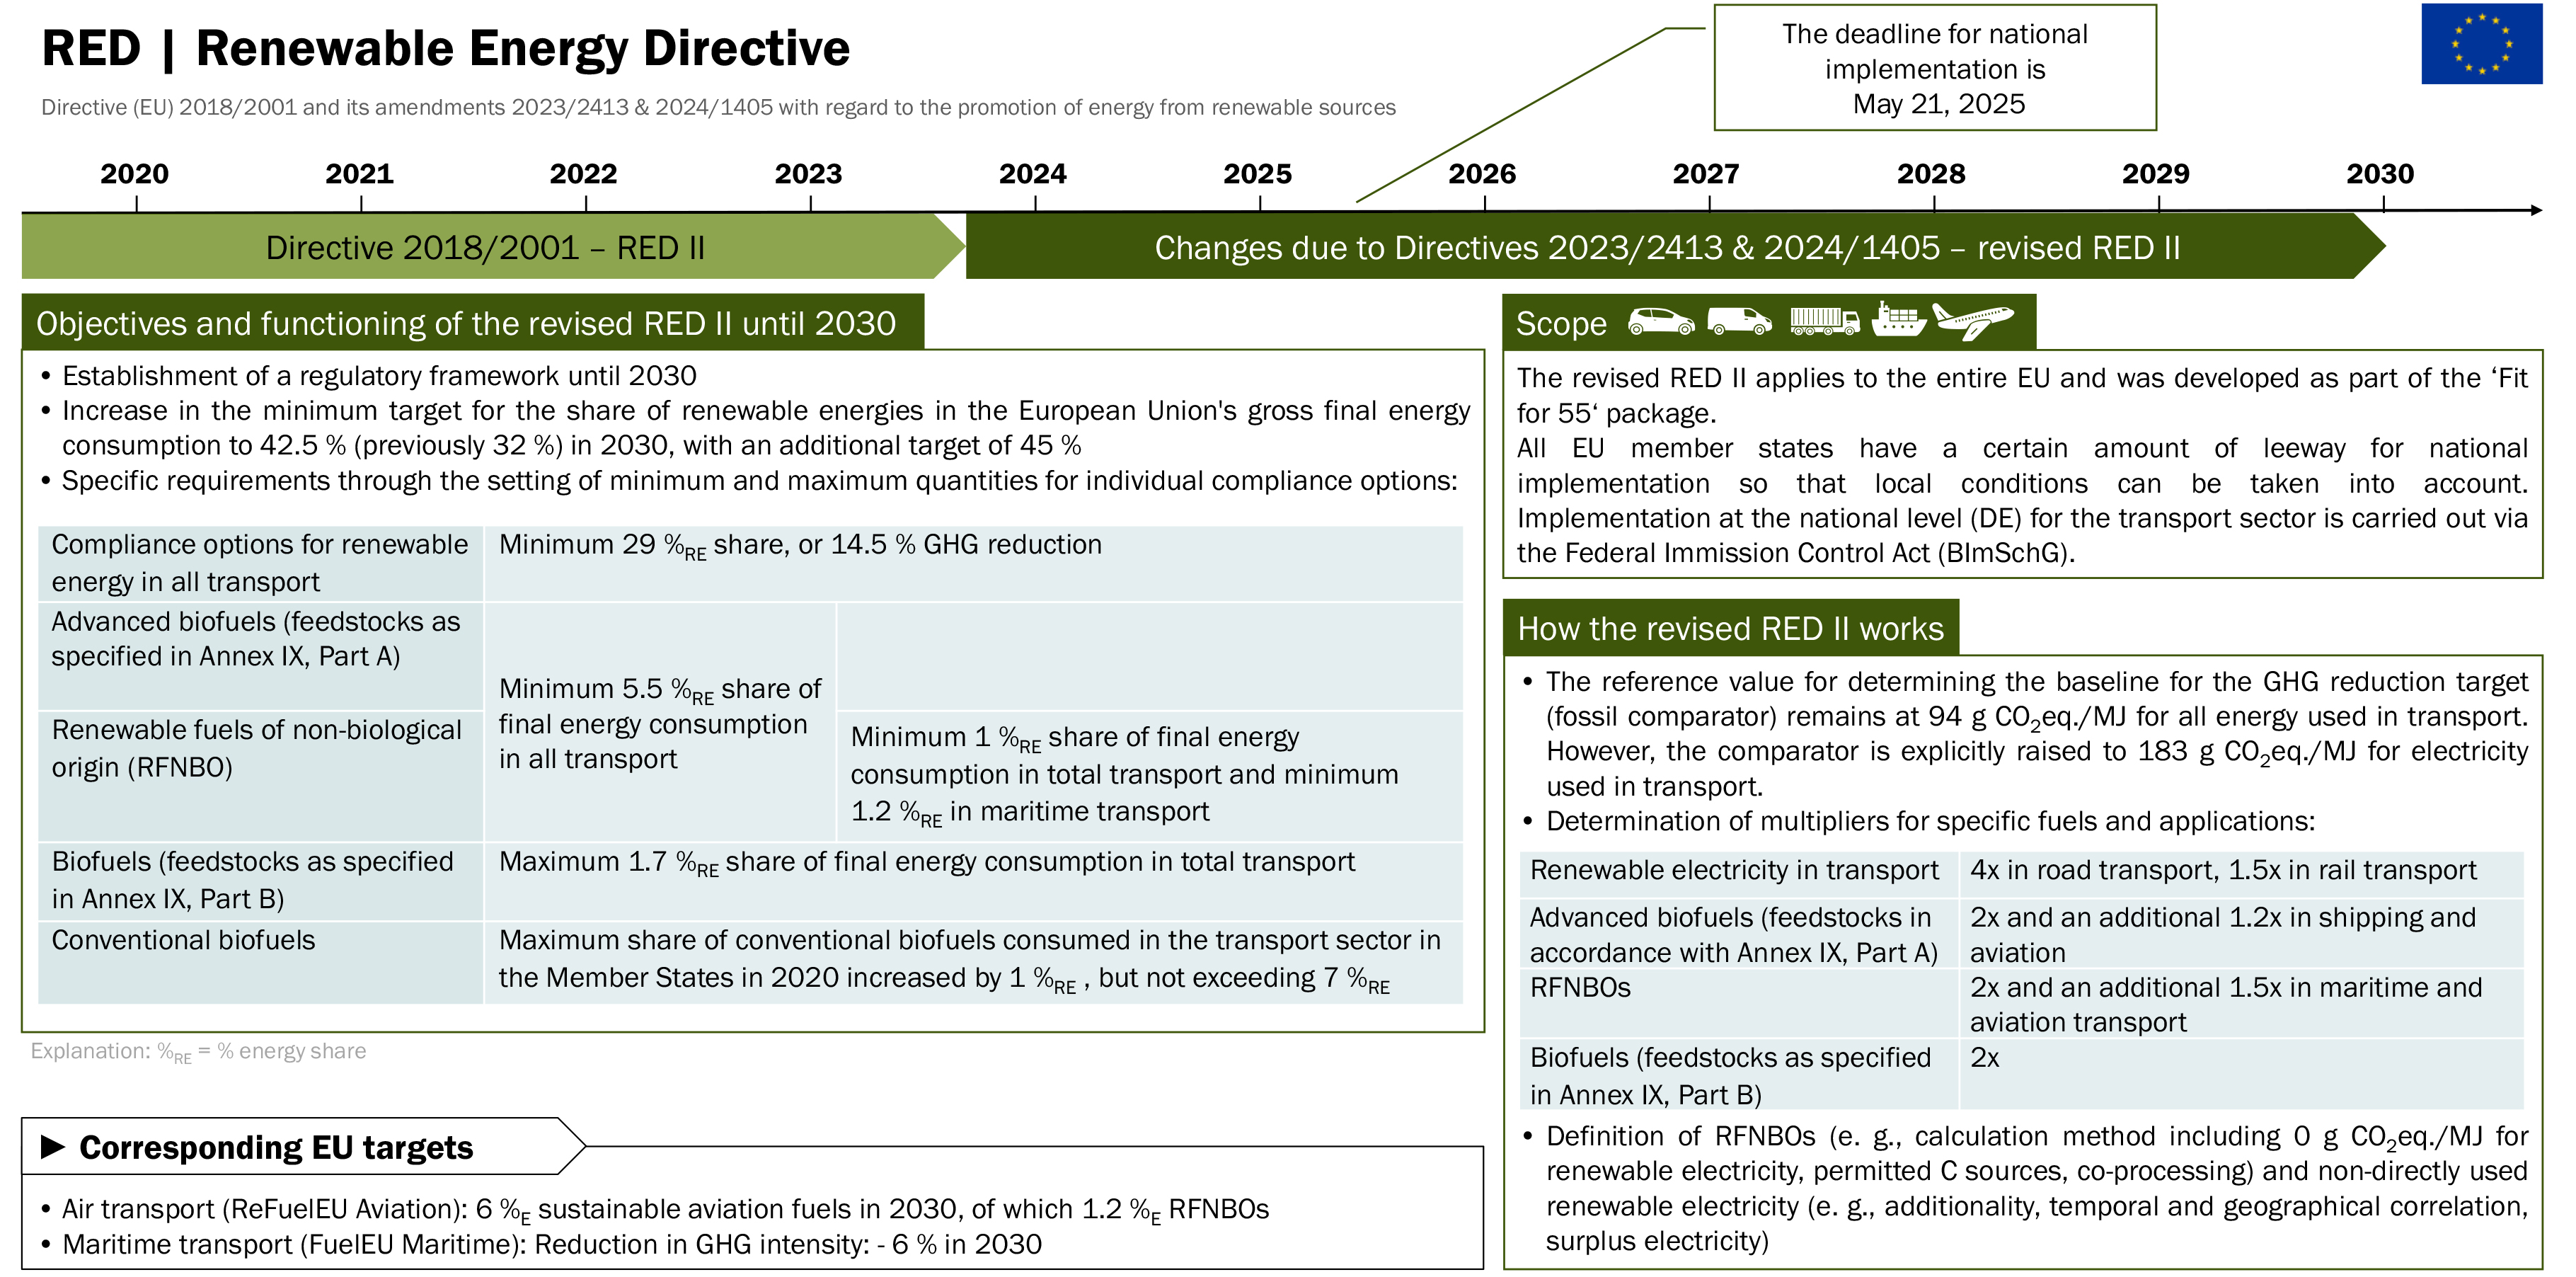
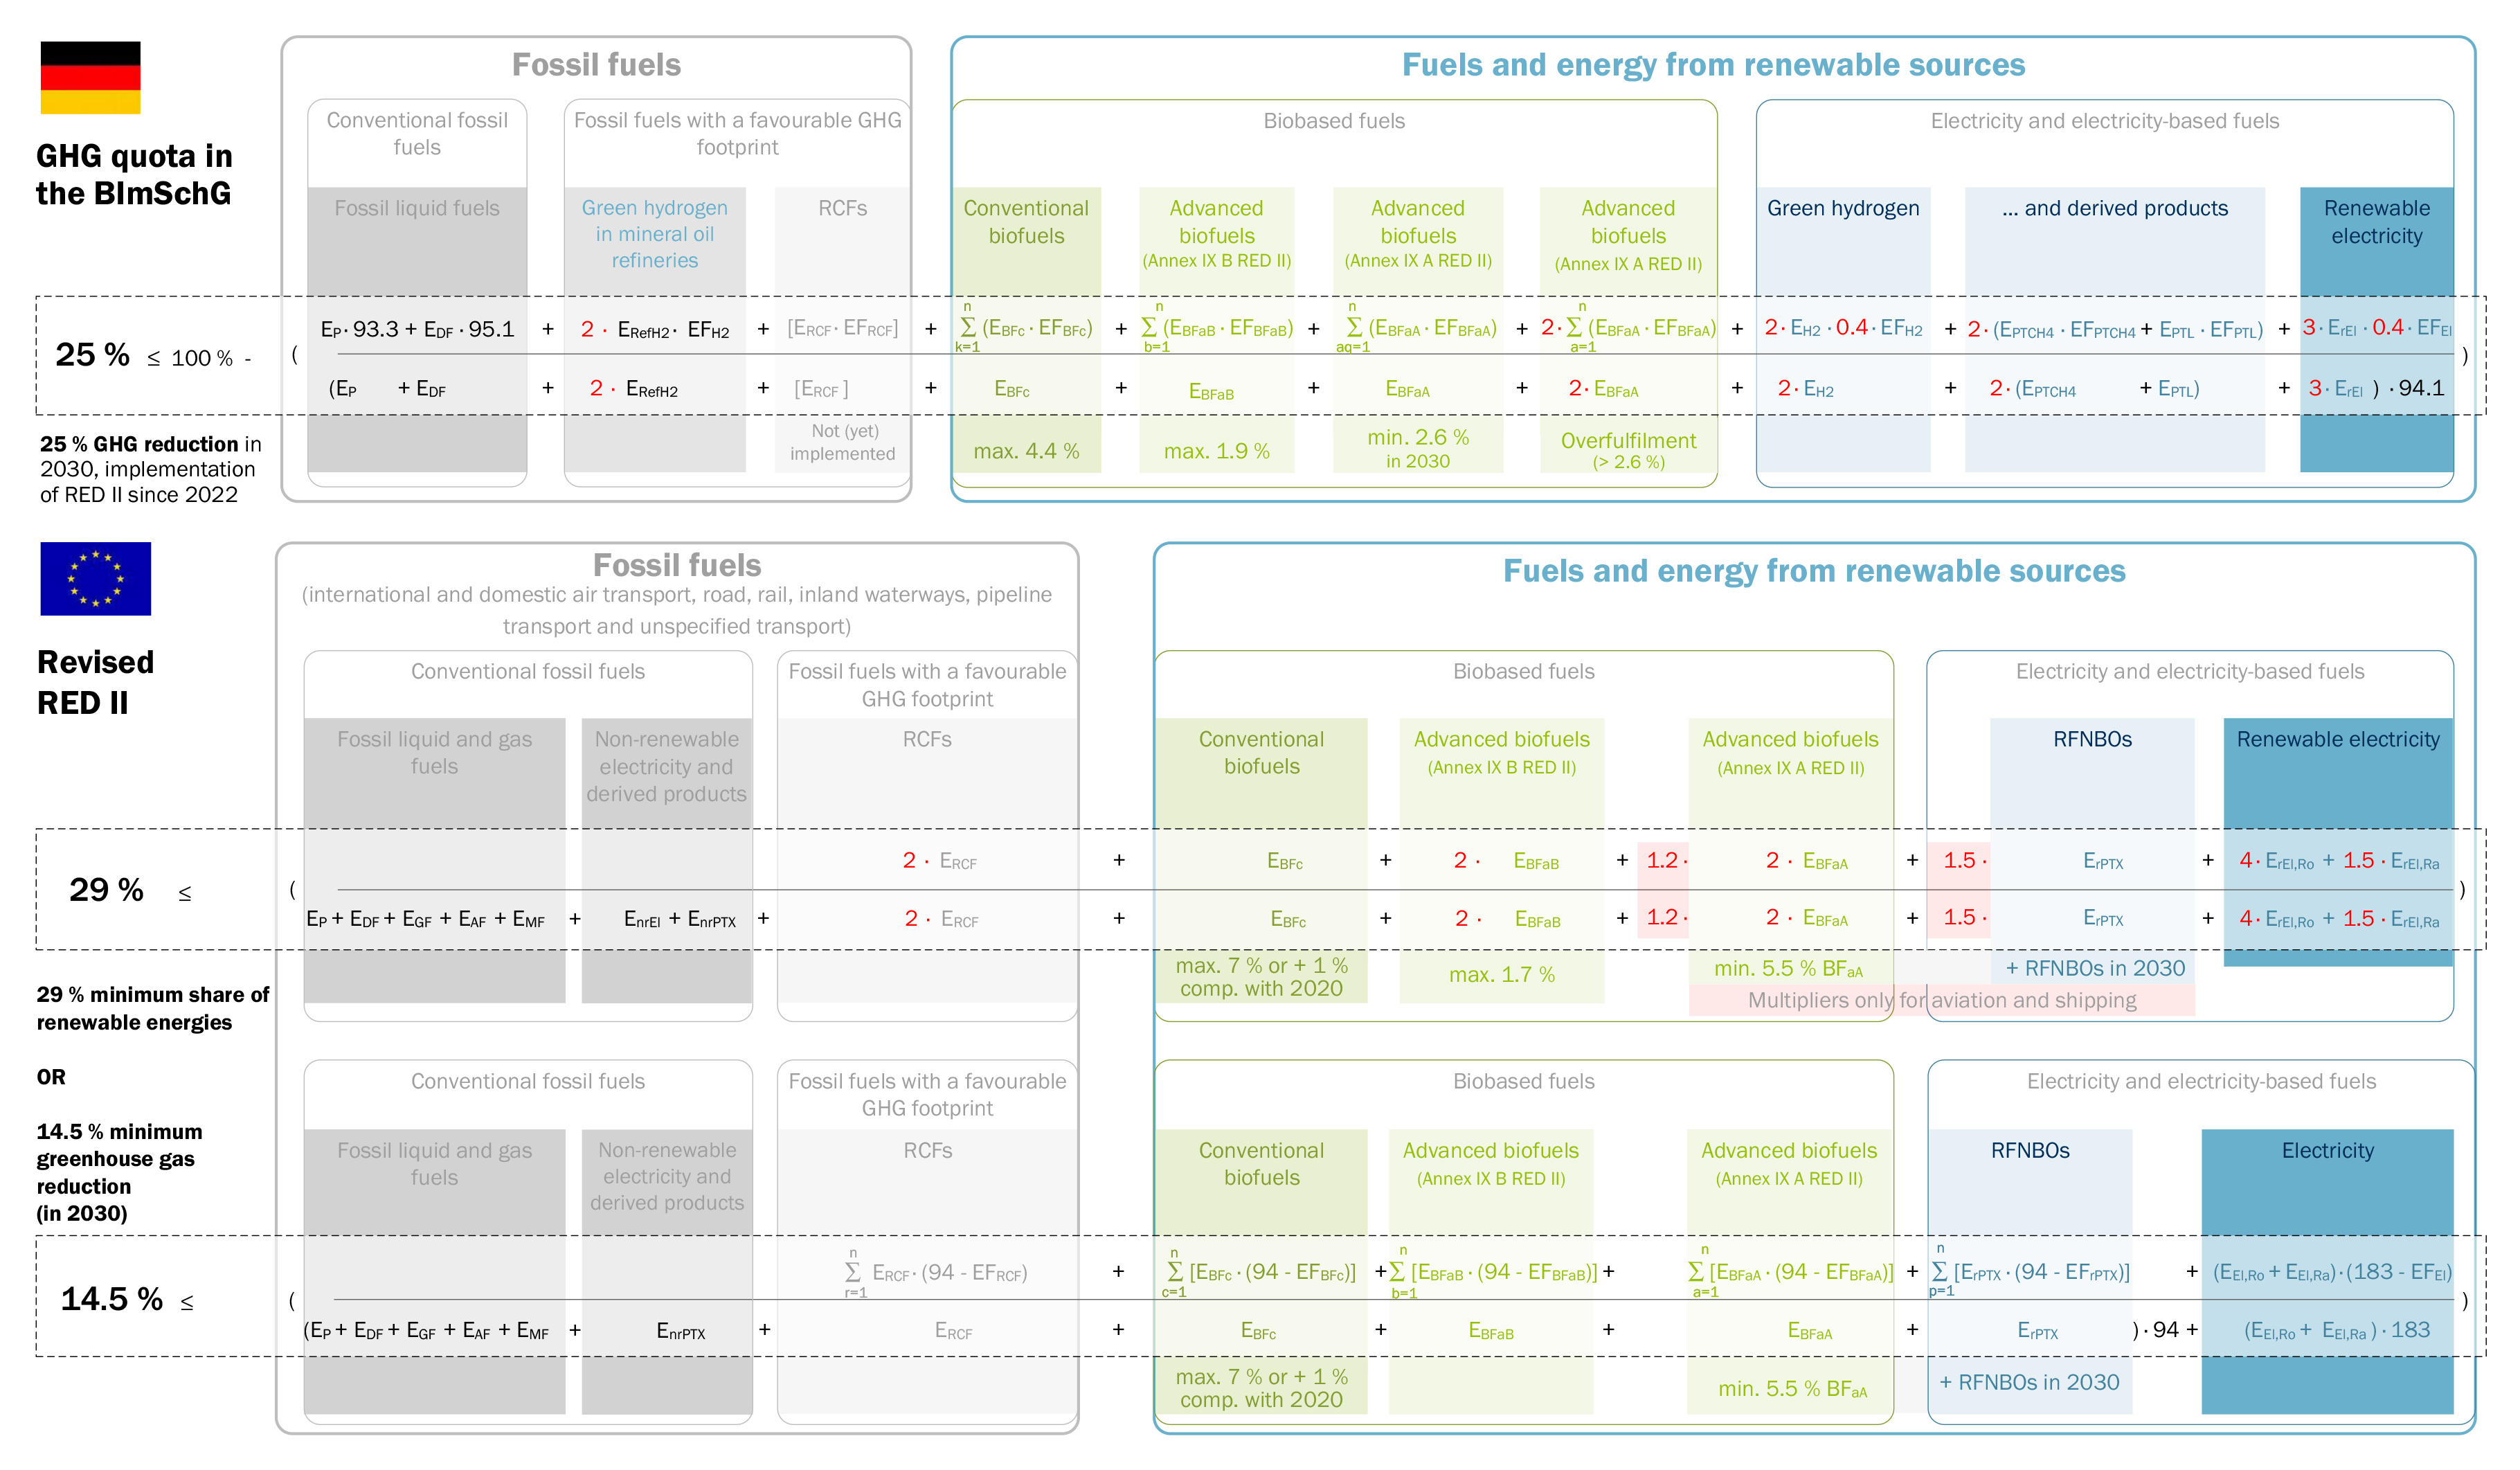
Overview of the revised Renewable Energy Directive, drawn up in the Innofuels project, updated version on the (InnoFuels-Website)
Fig. 3-3 on page 37
Download [JPG, 2,3 MB]


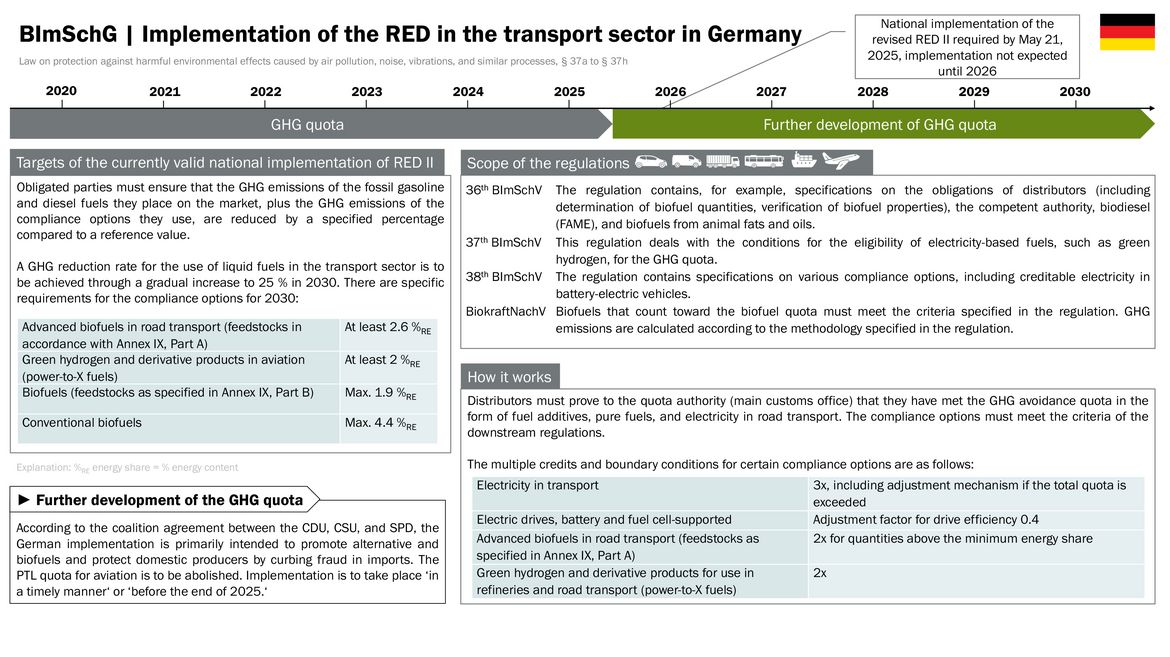
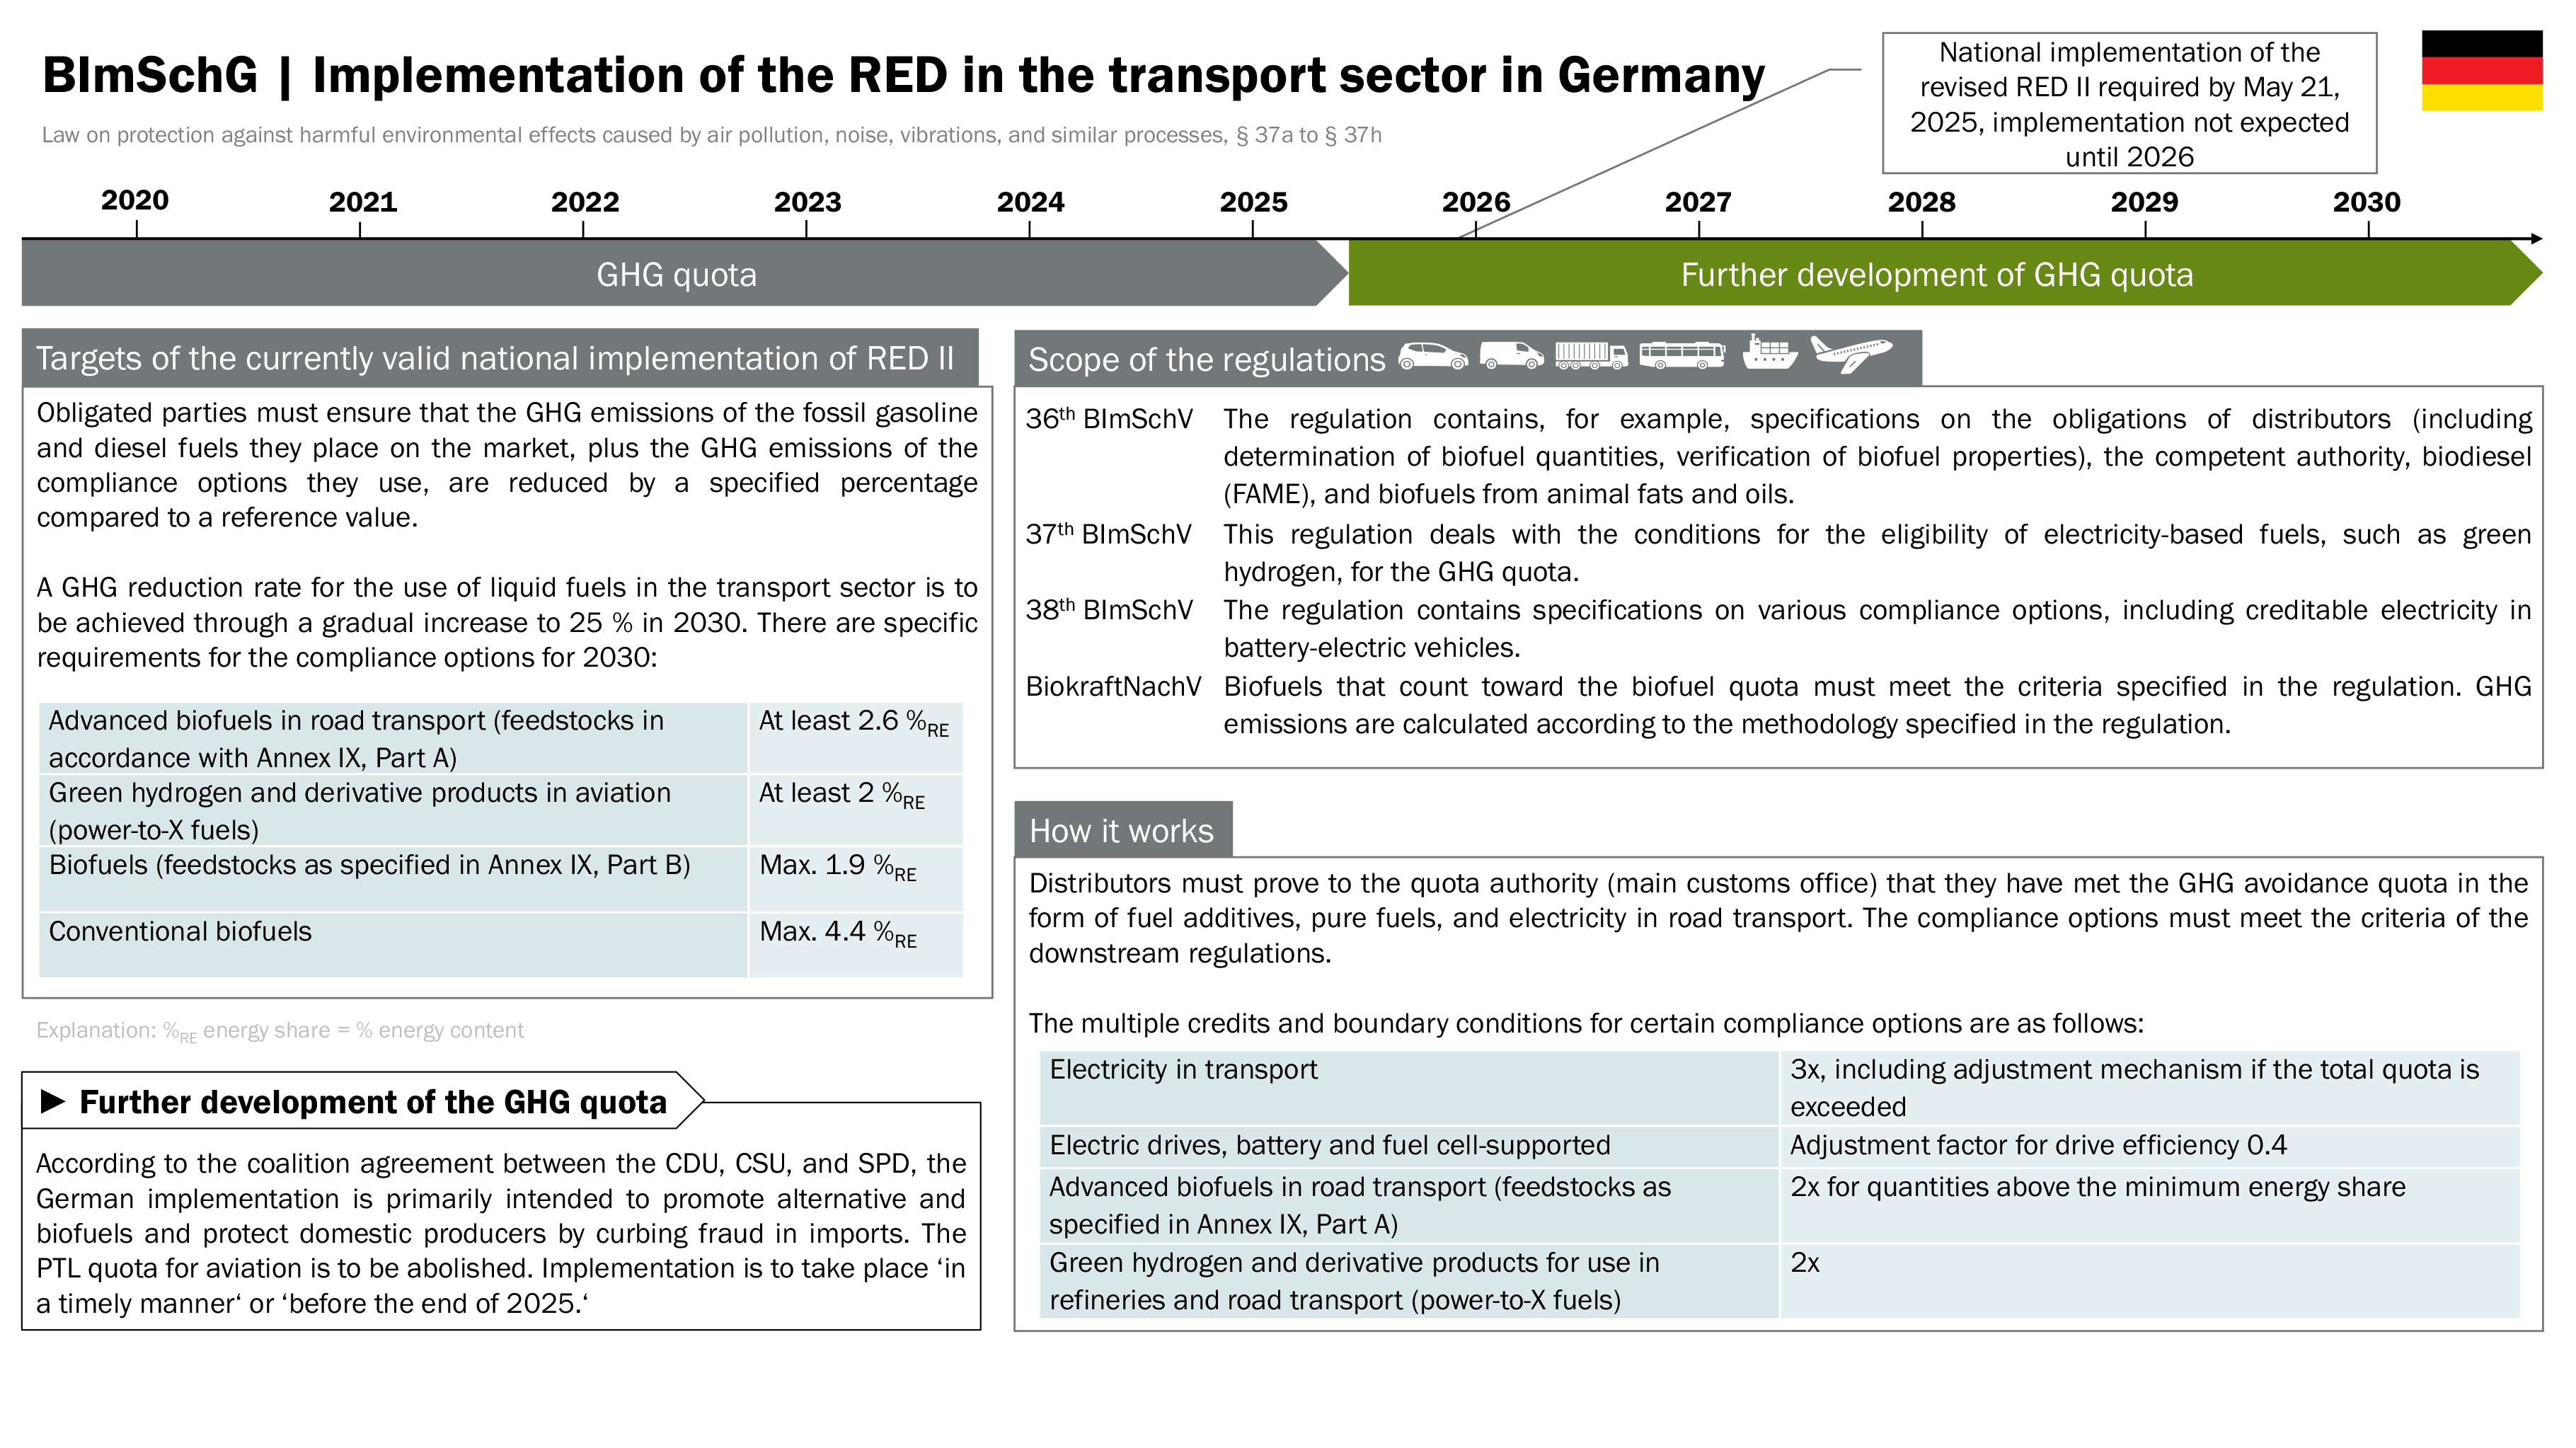
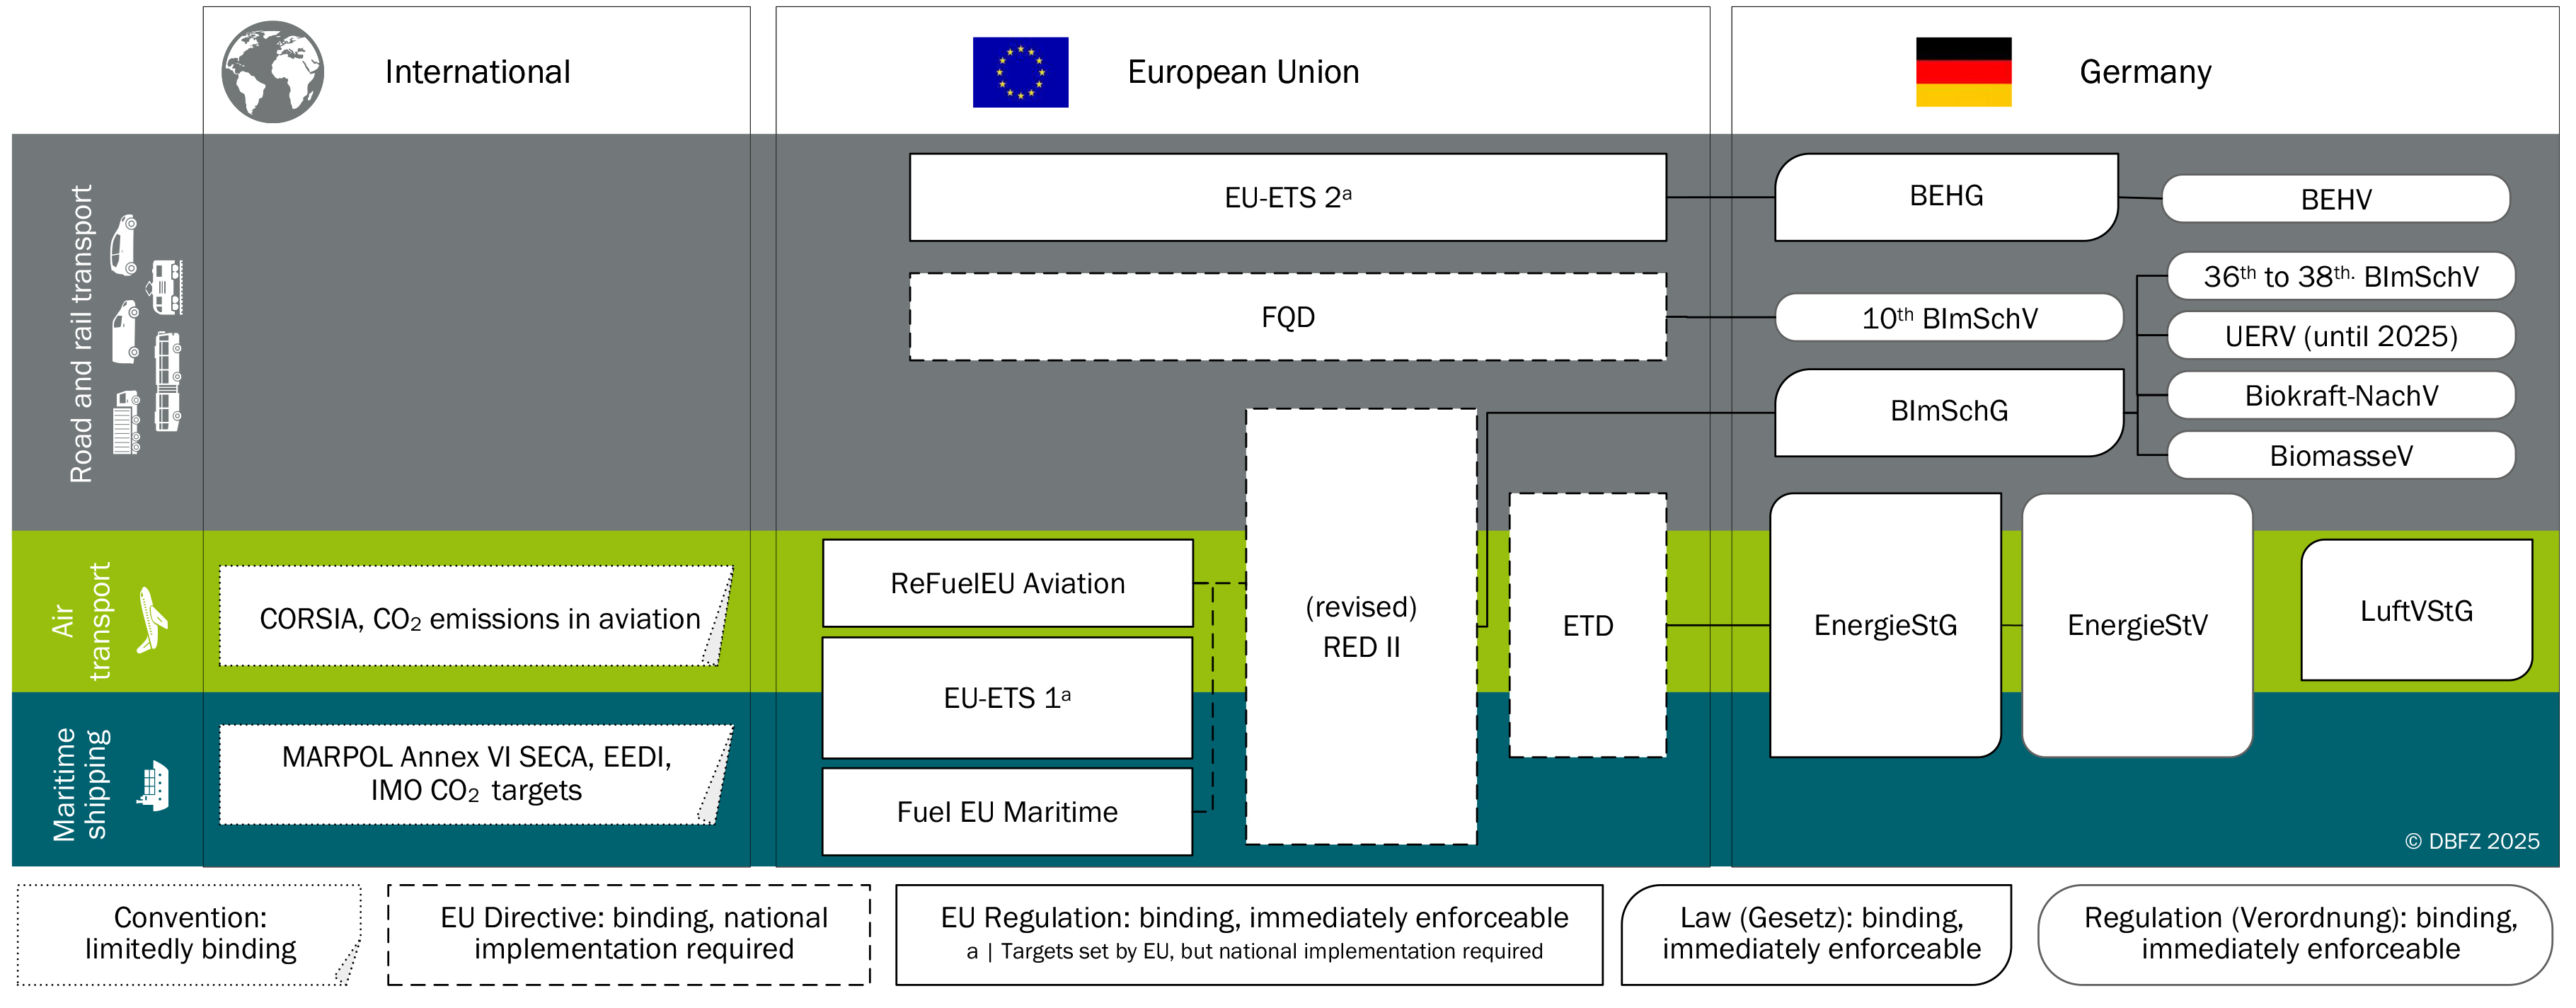
Overview of the German Federal Immission Control Act as implementation of REDII ((EU) 2018/2001) in Germany, drawn up in the Innofuels project, updated version on the (InnoFuels-Website)
Fig. 3-6 on page 39
Download [JPG, 2,2 MB]

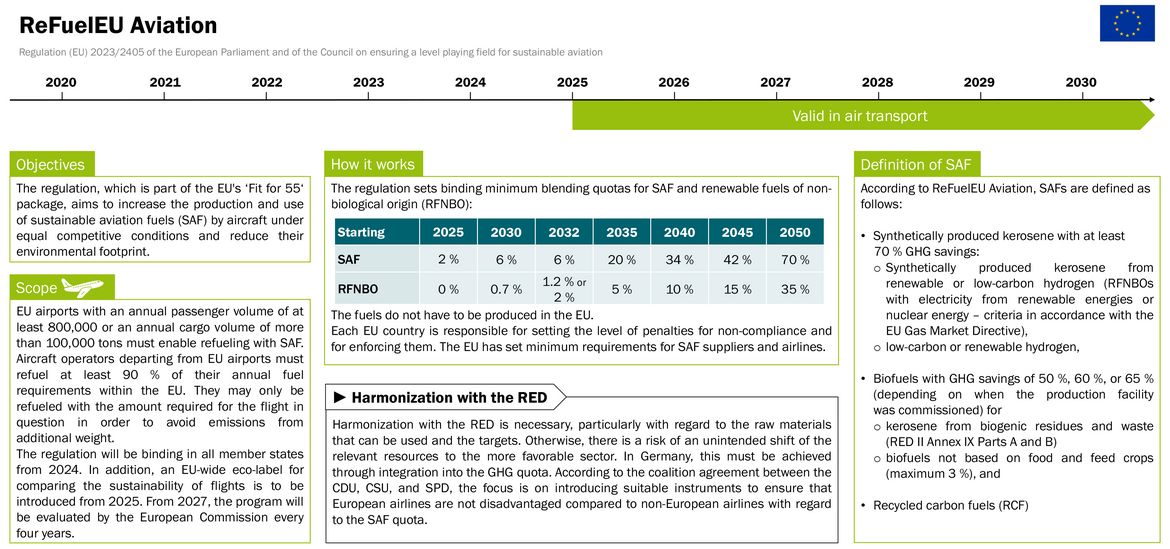
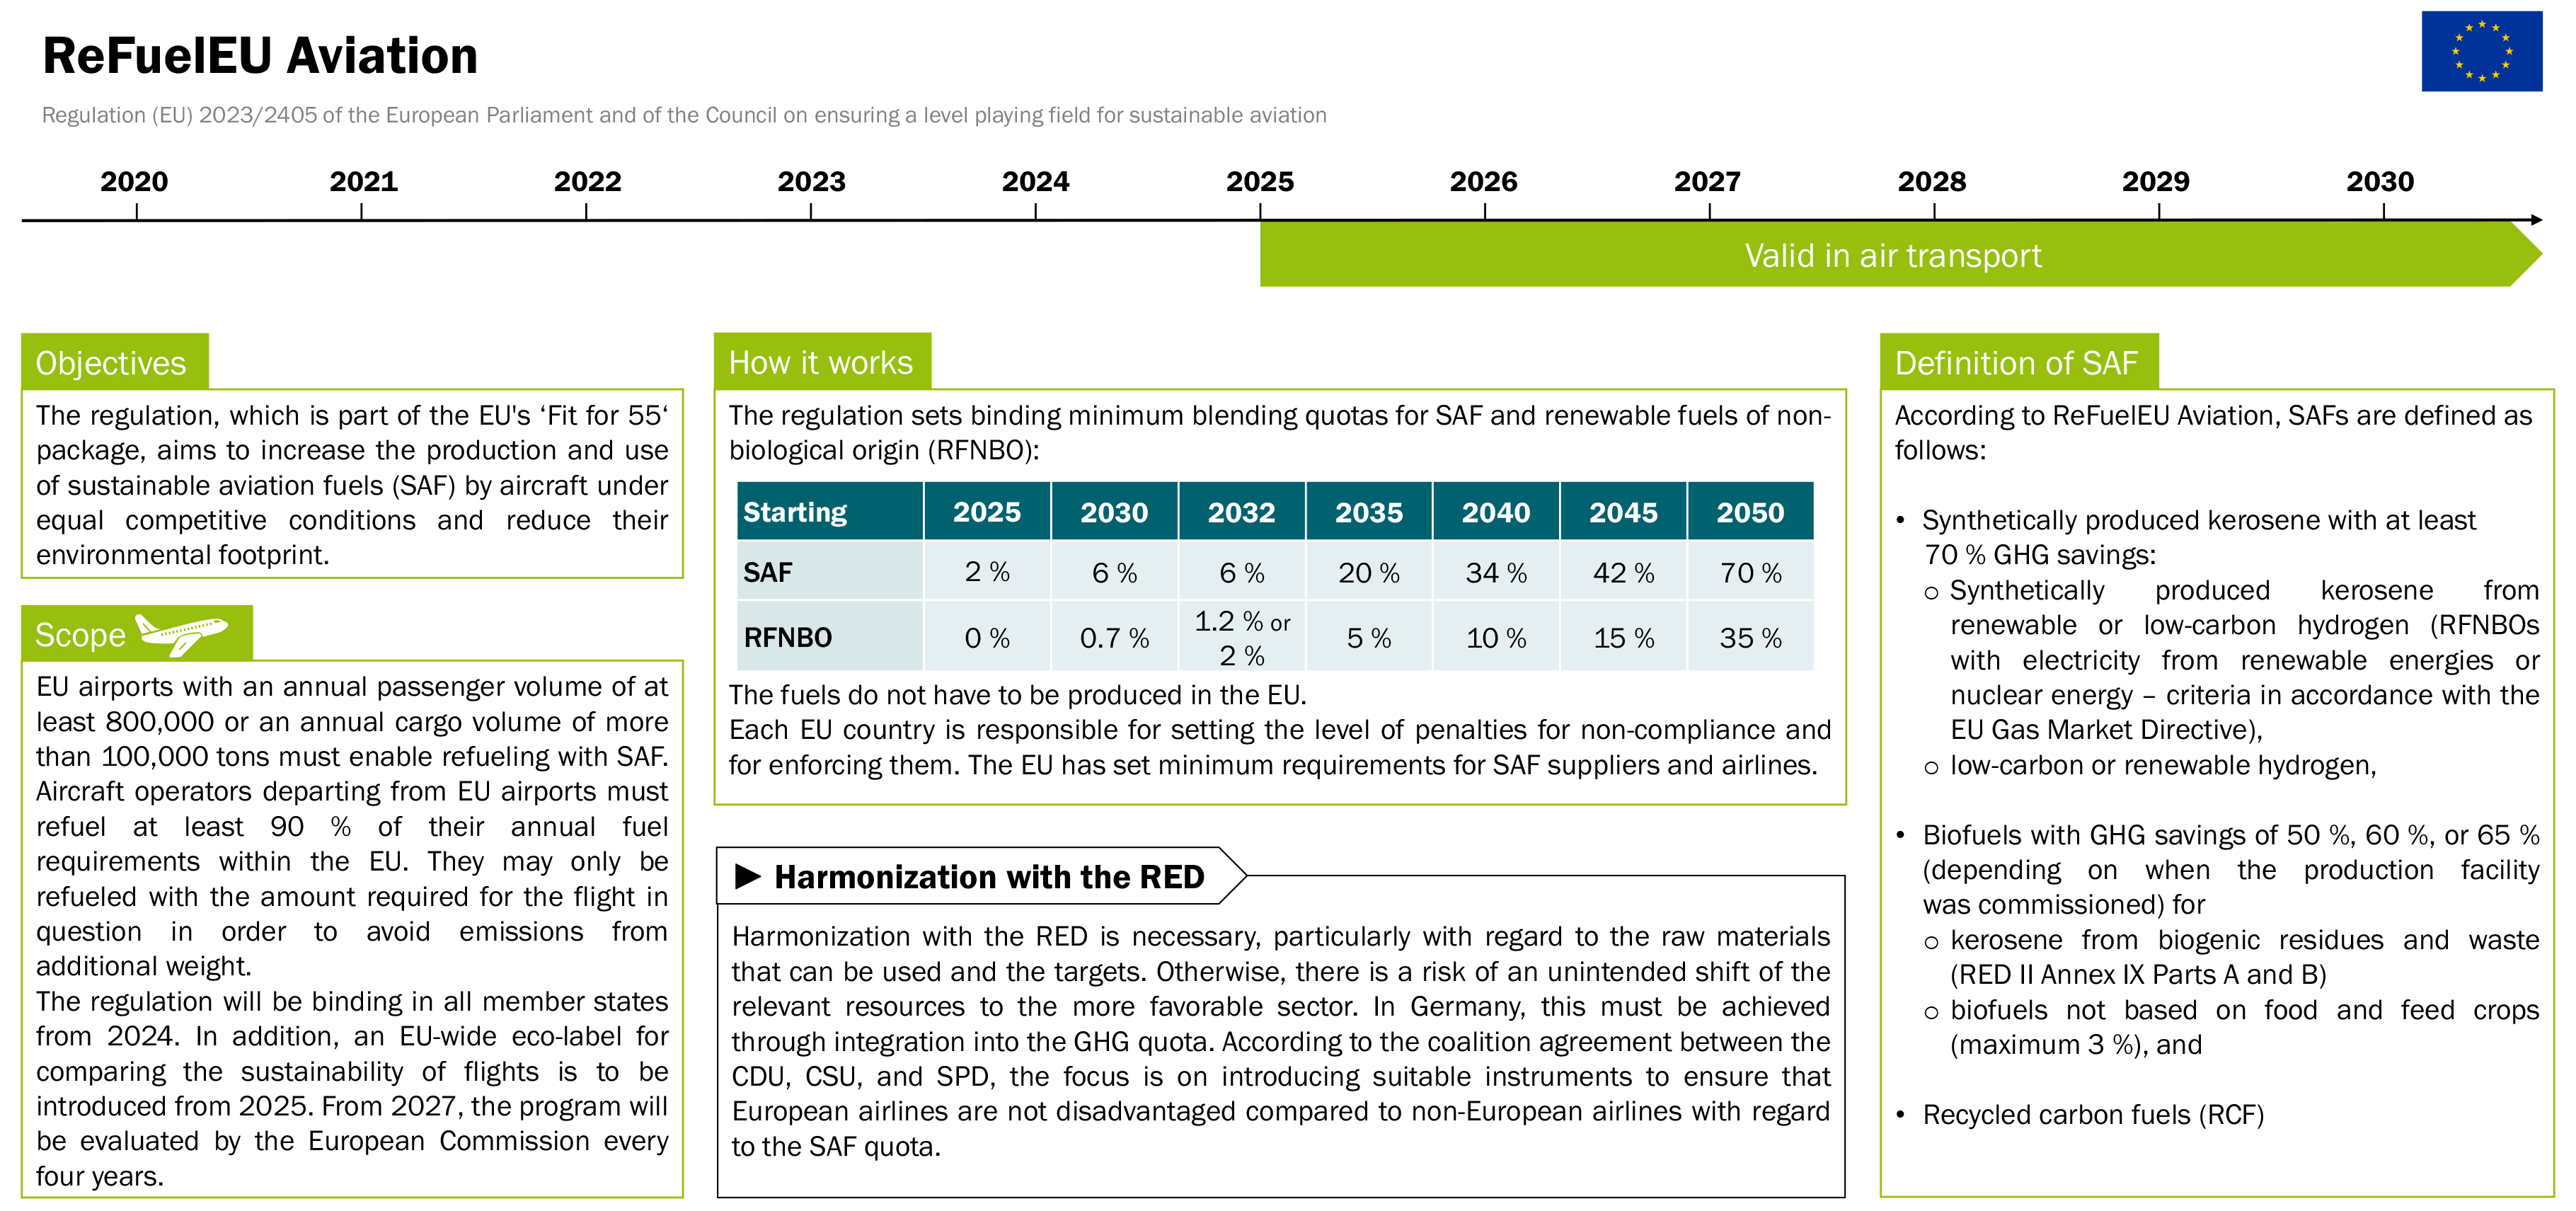
Overview of ReFuelEU Aviation, drawn up in the Innofuels project, updated version on the (InnoFuels-Website)
Fig. 3-9 on page 43
Download [JPG, 1,94 MB]
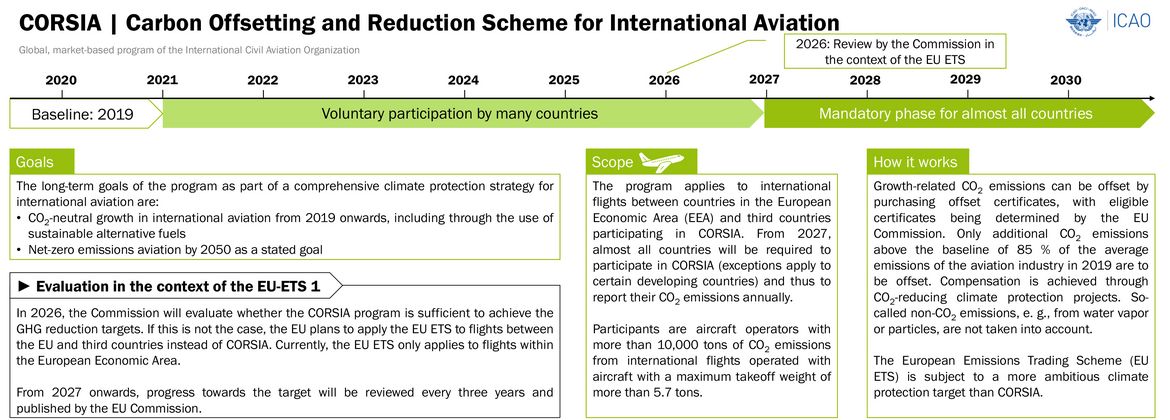
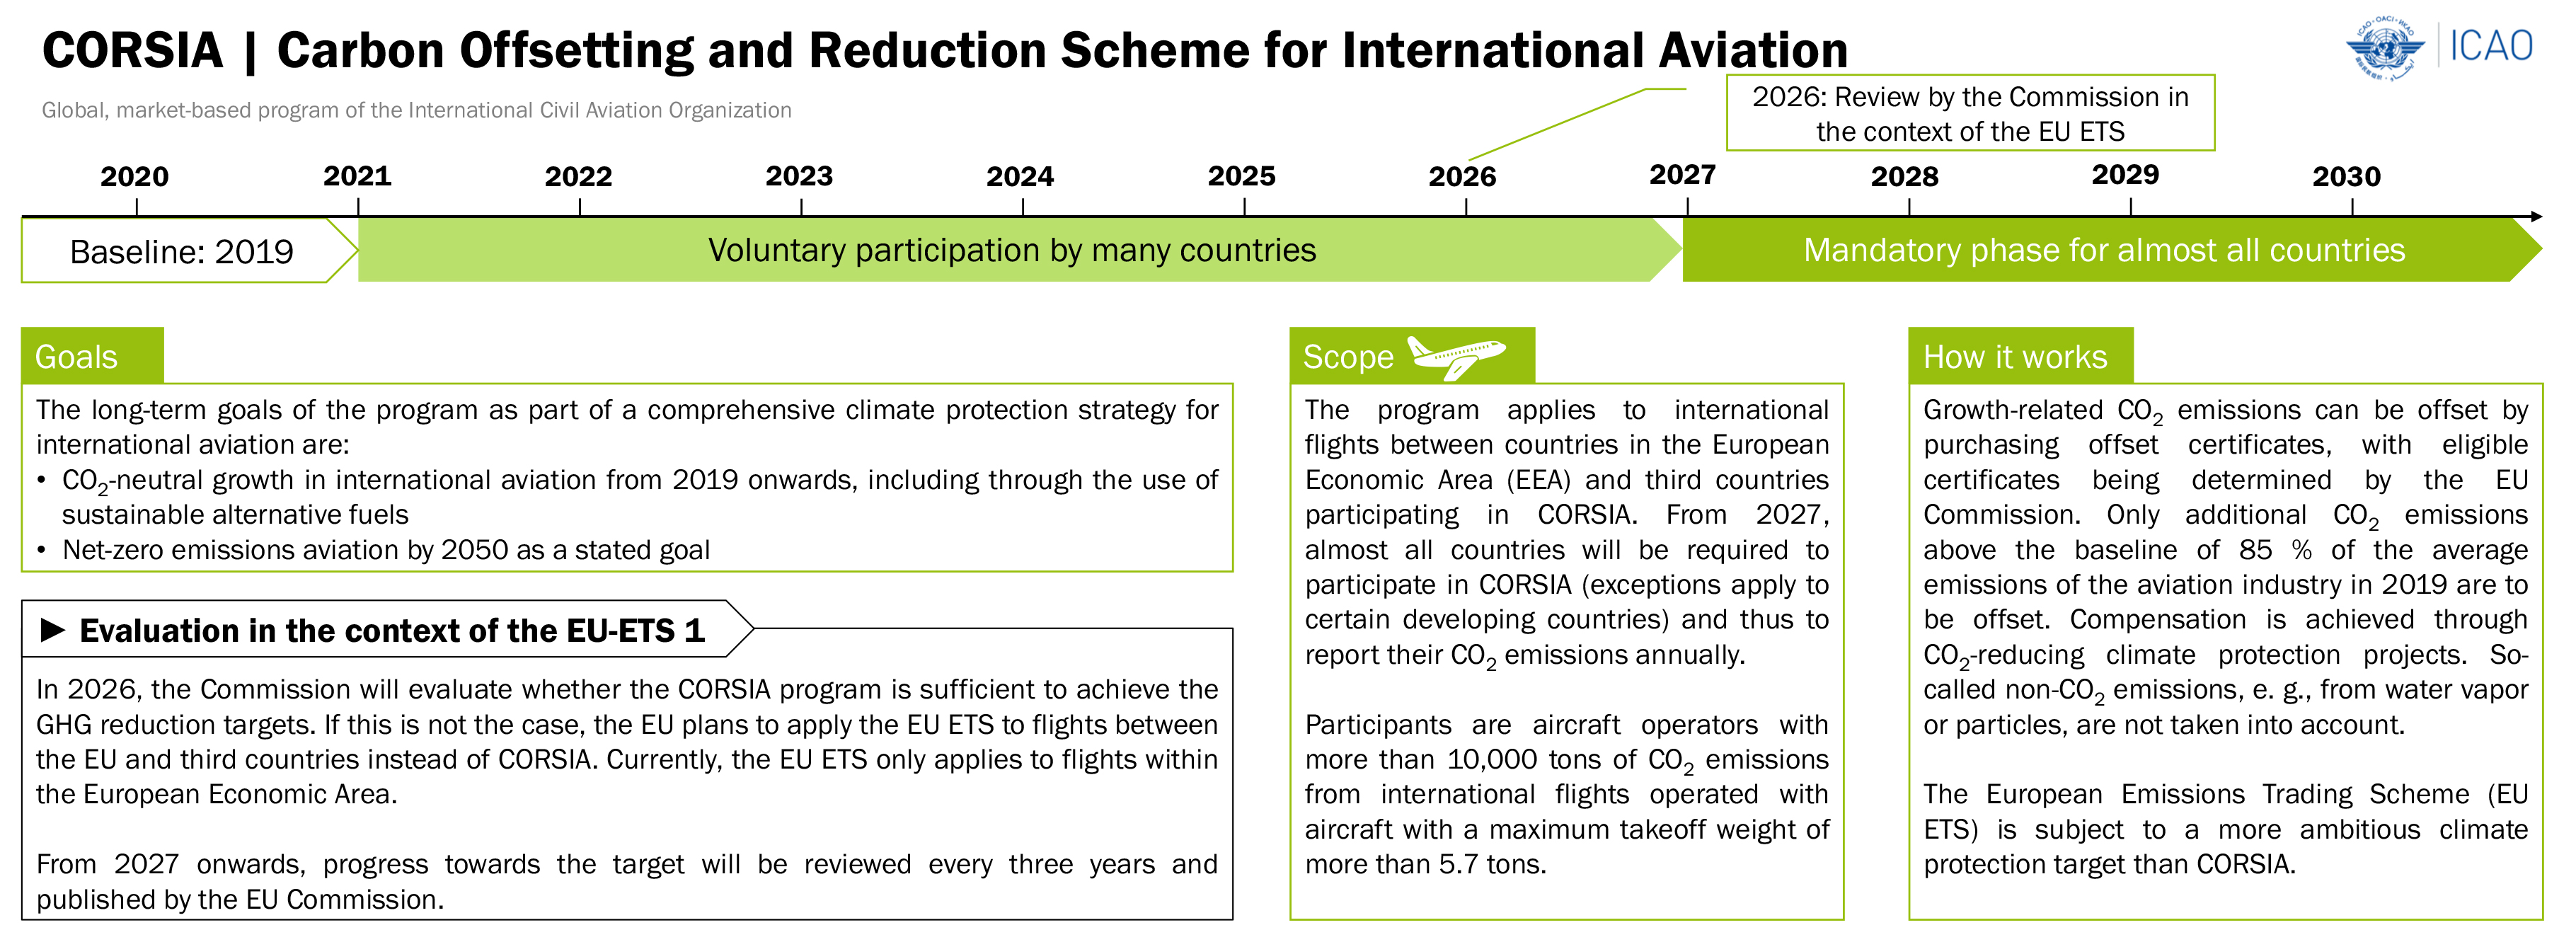
Overview of CORSIA, drawn up in the Innofuels project, updated version on the (InnoFuels-Website)
Fig. 3-10 on page 44
Download [JPG, 1,6 MB]

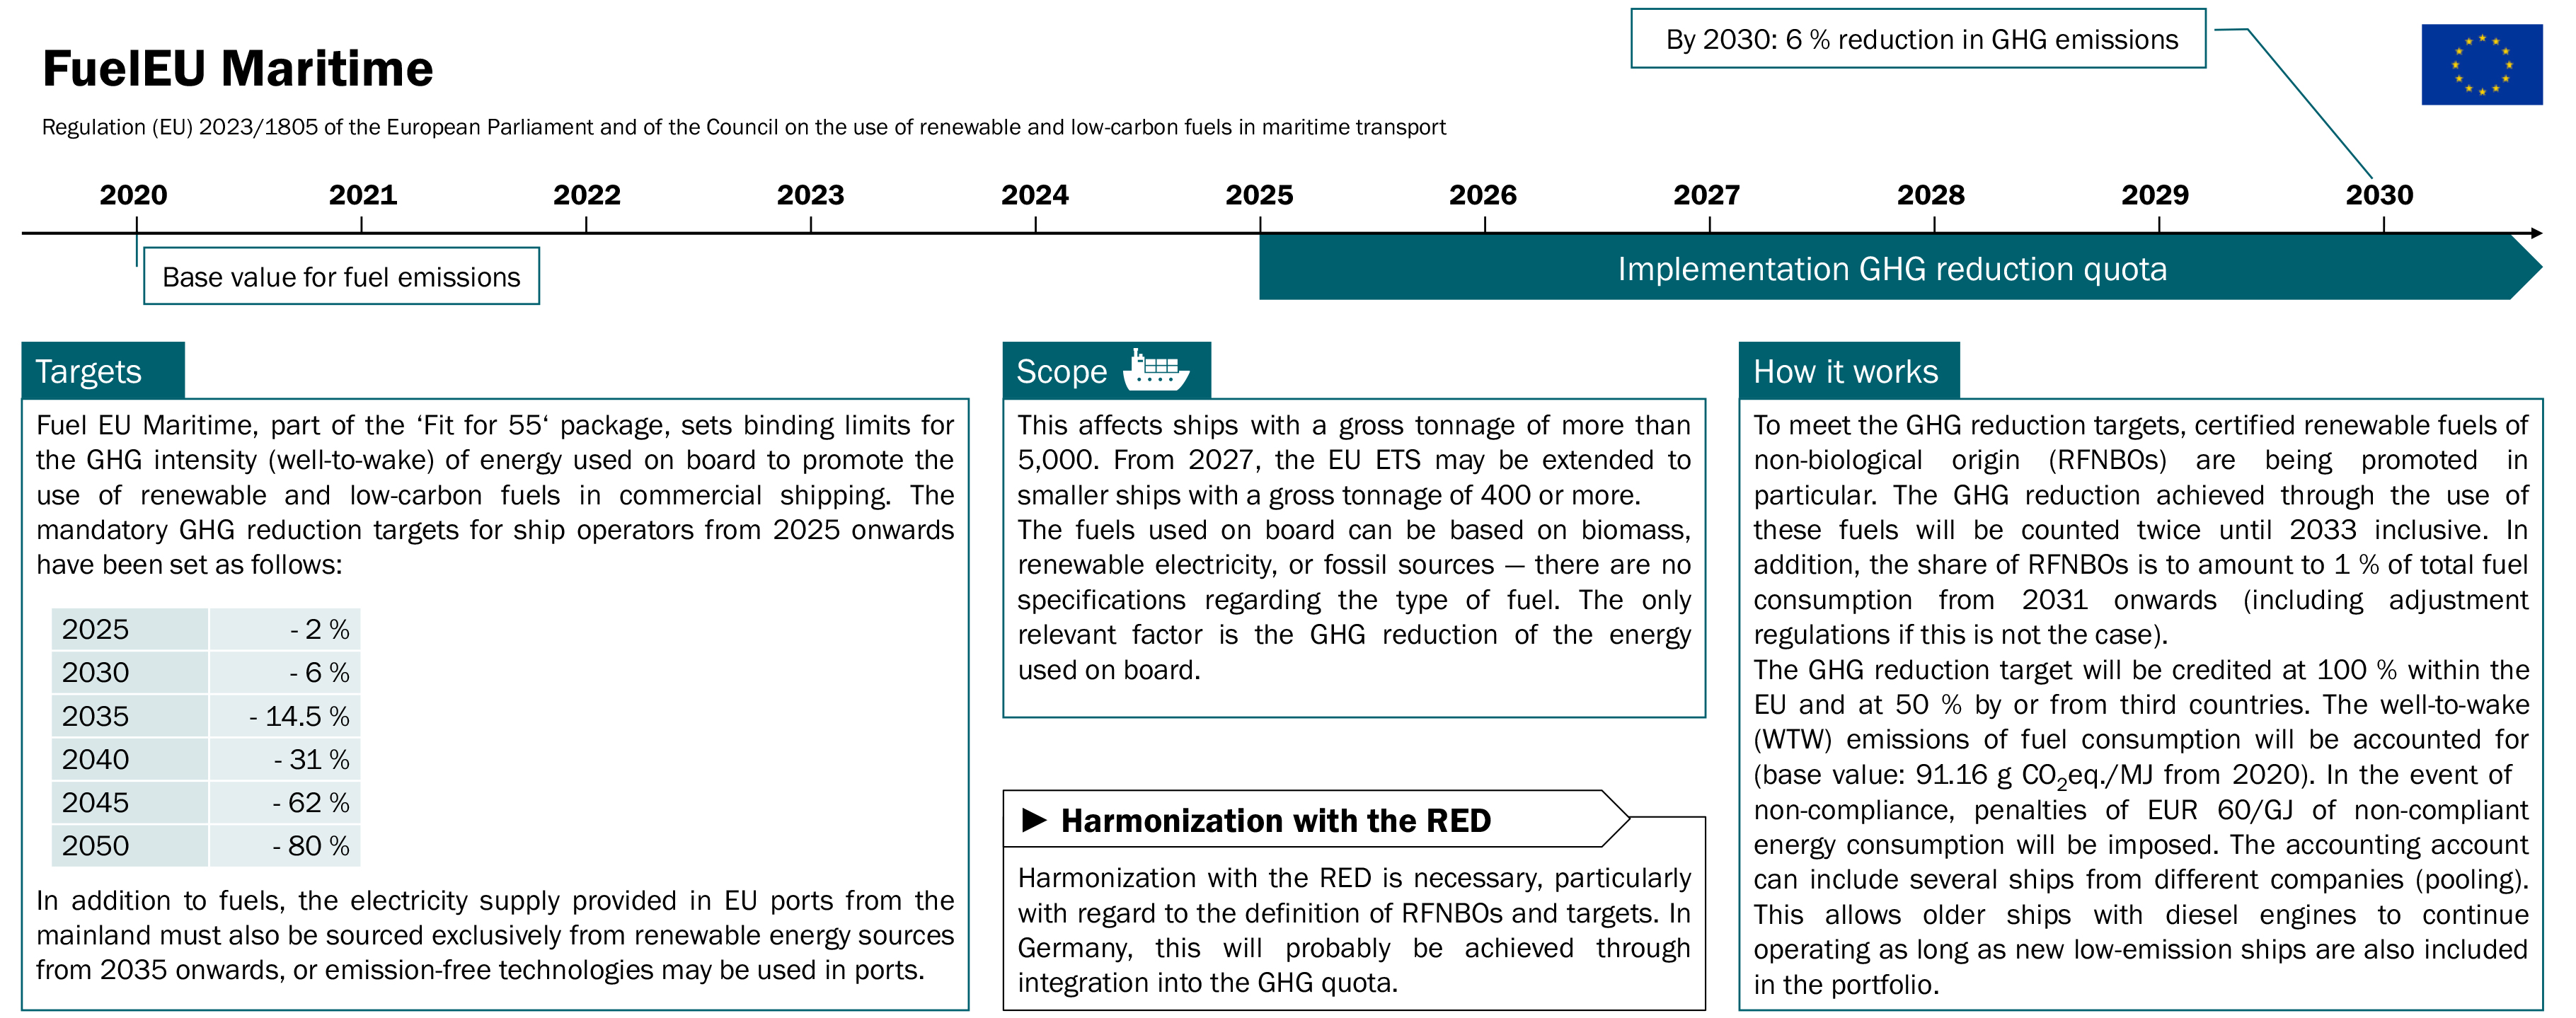
Overview of the FuelEU Maritime, drawn up in the Innofuels project, updated on the (InnoFuels-Website)
Fig. 3-11 on page 45
Download [JPG, 1,7 MB]
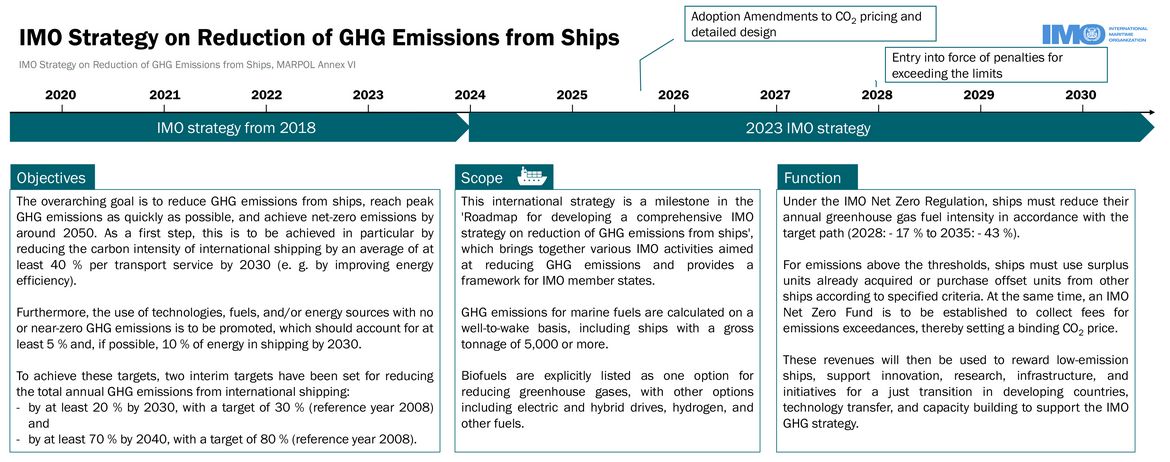

Overview of the 2023 IMO Strategy on Reduction of GHG Emissions from Ships, drawn up in the Innofuels project, updated version on the (InnoFuels-Website)
Fig. 3-12 on page 46
Download [JPG, 1,8 MB]
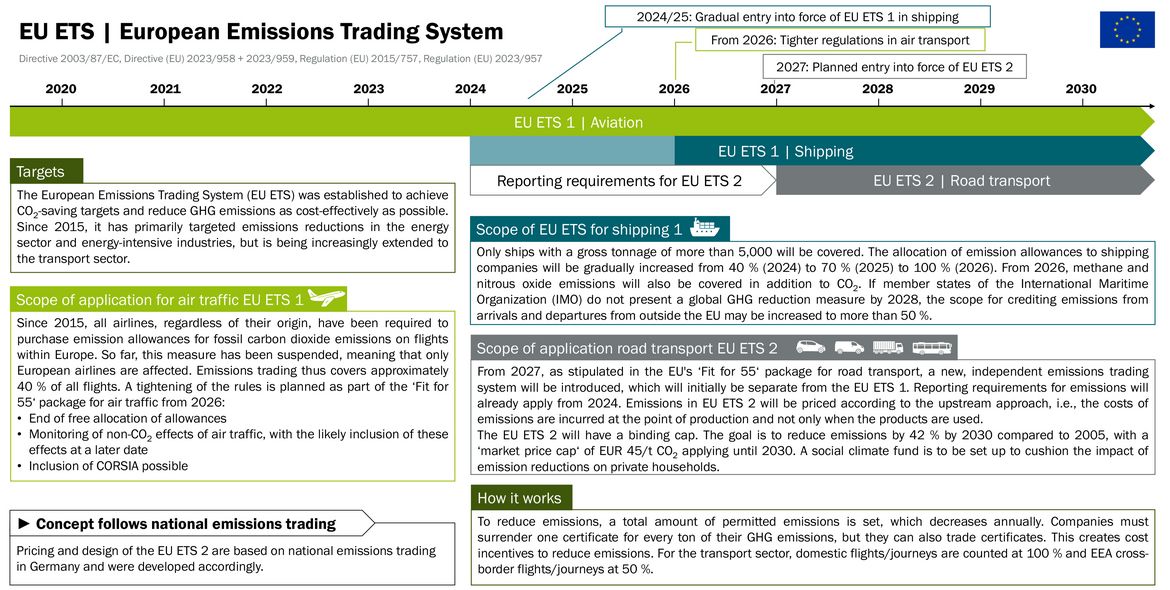
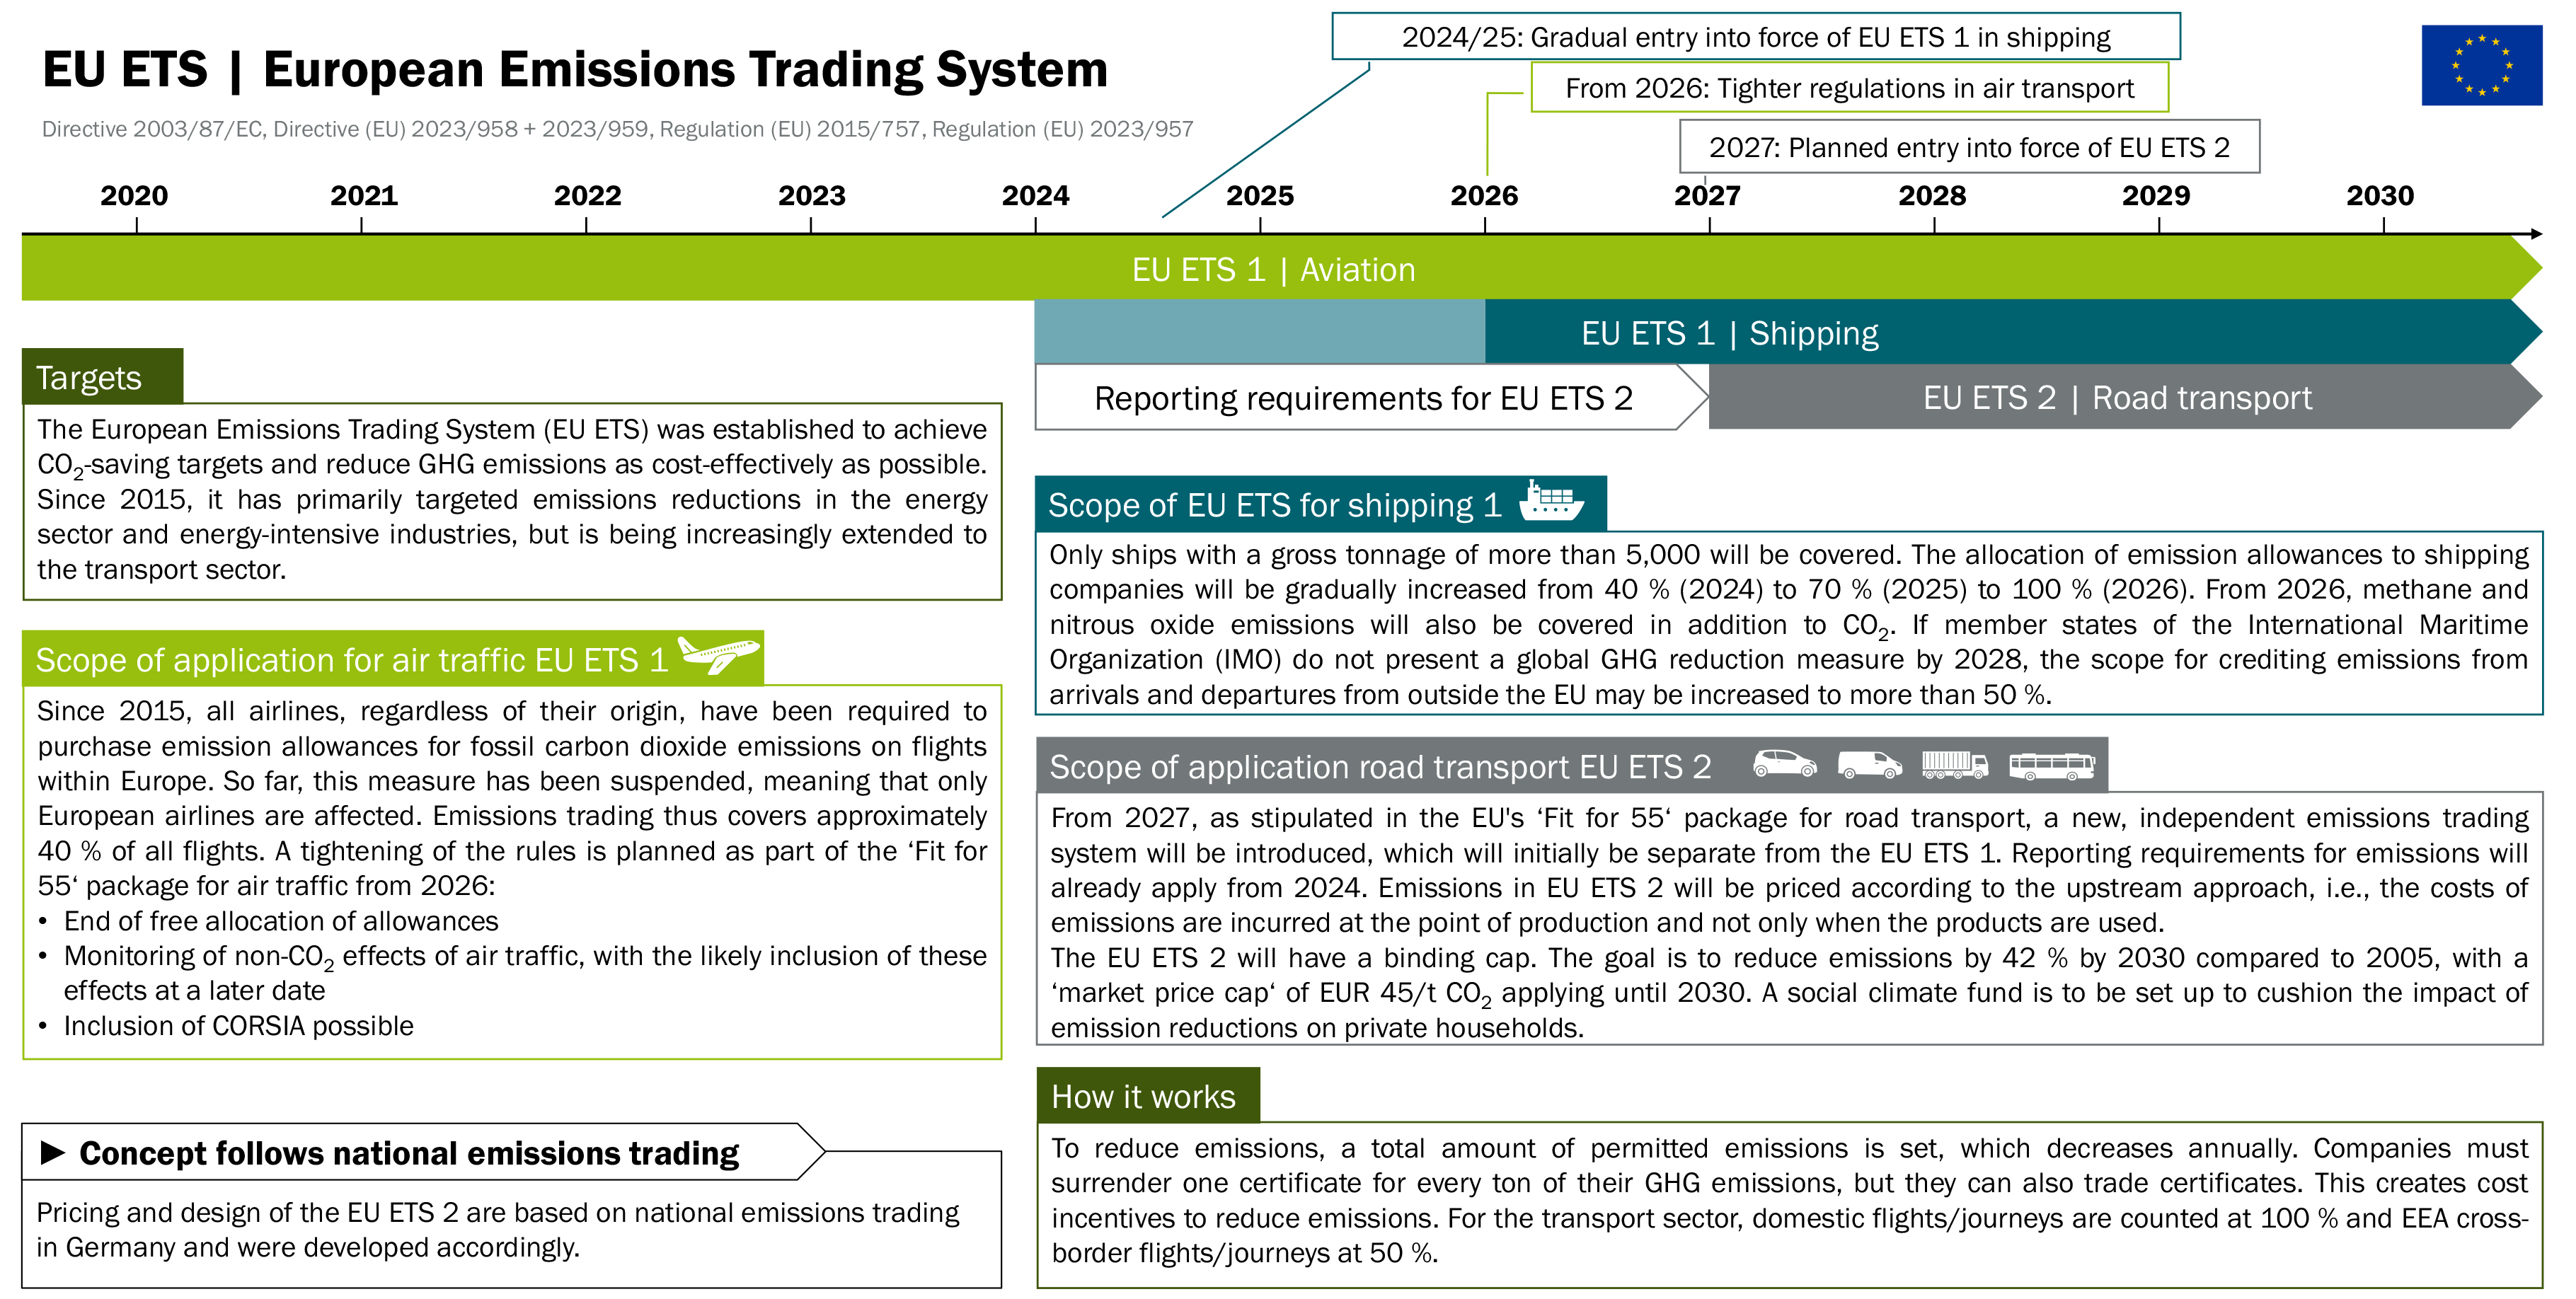
Overview of the Emissions Trading System, drawn up in the Innofuels project, updated version on the (InnoFuels-Website)
Fig. 3-13 on page 47
Download [JPG, 2,3 MB]
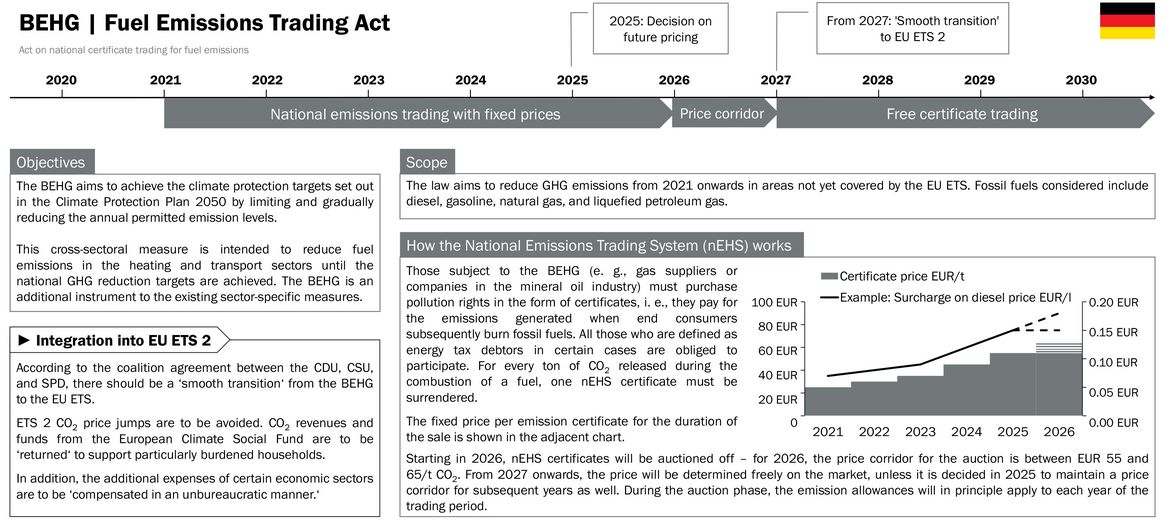
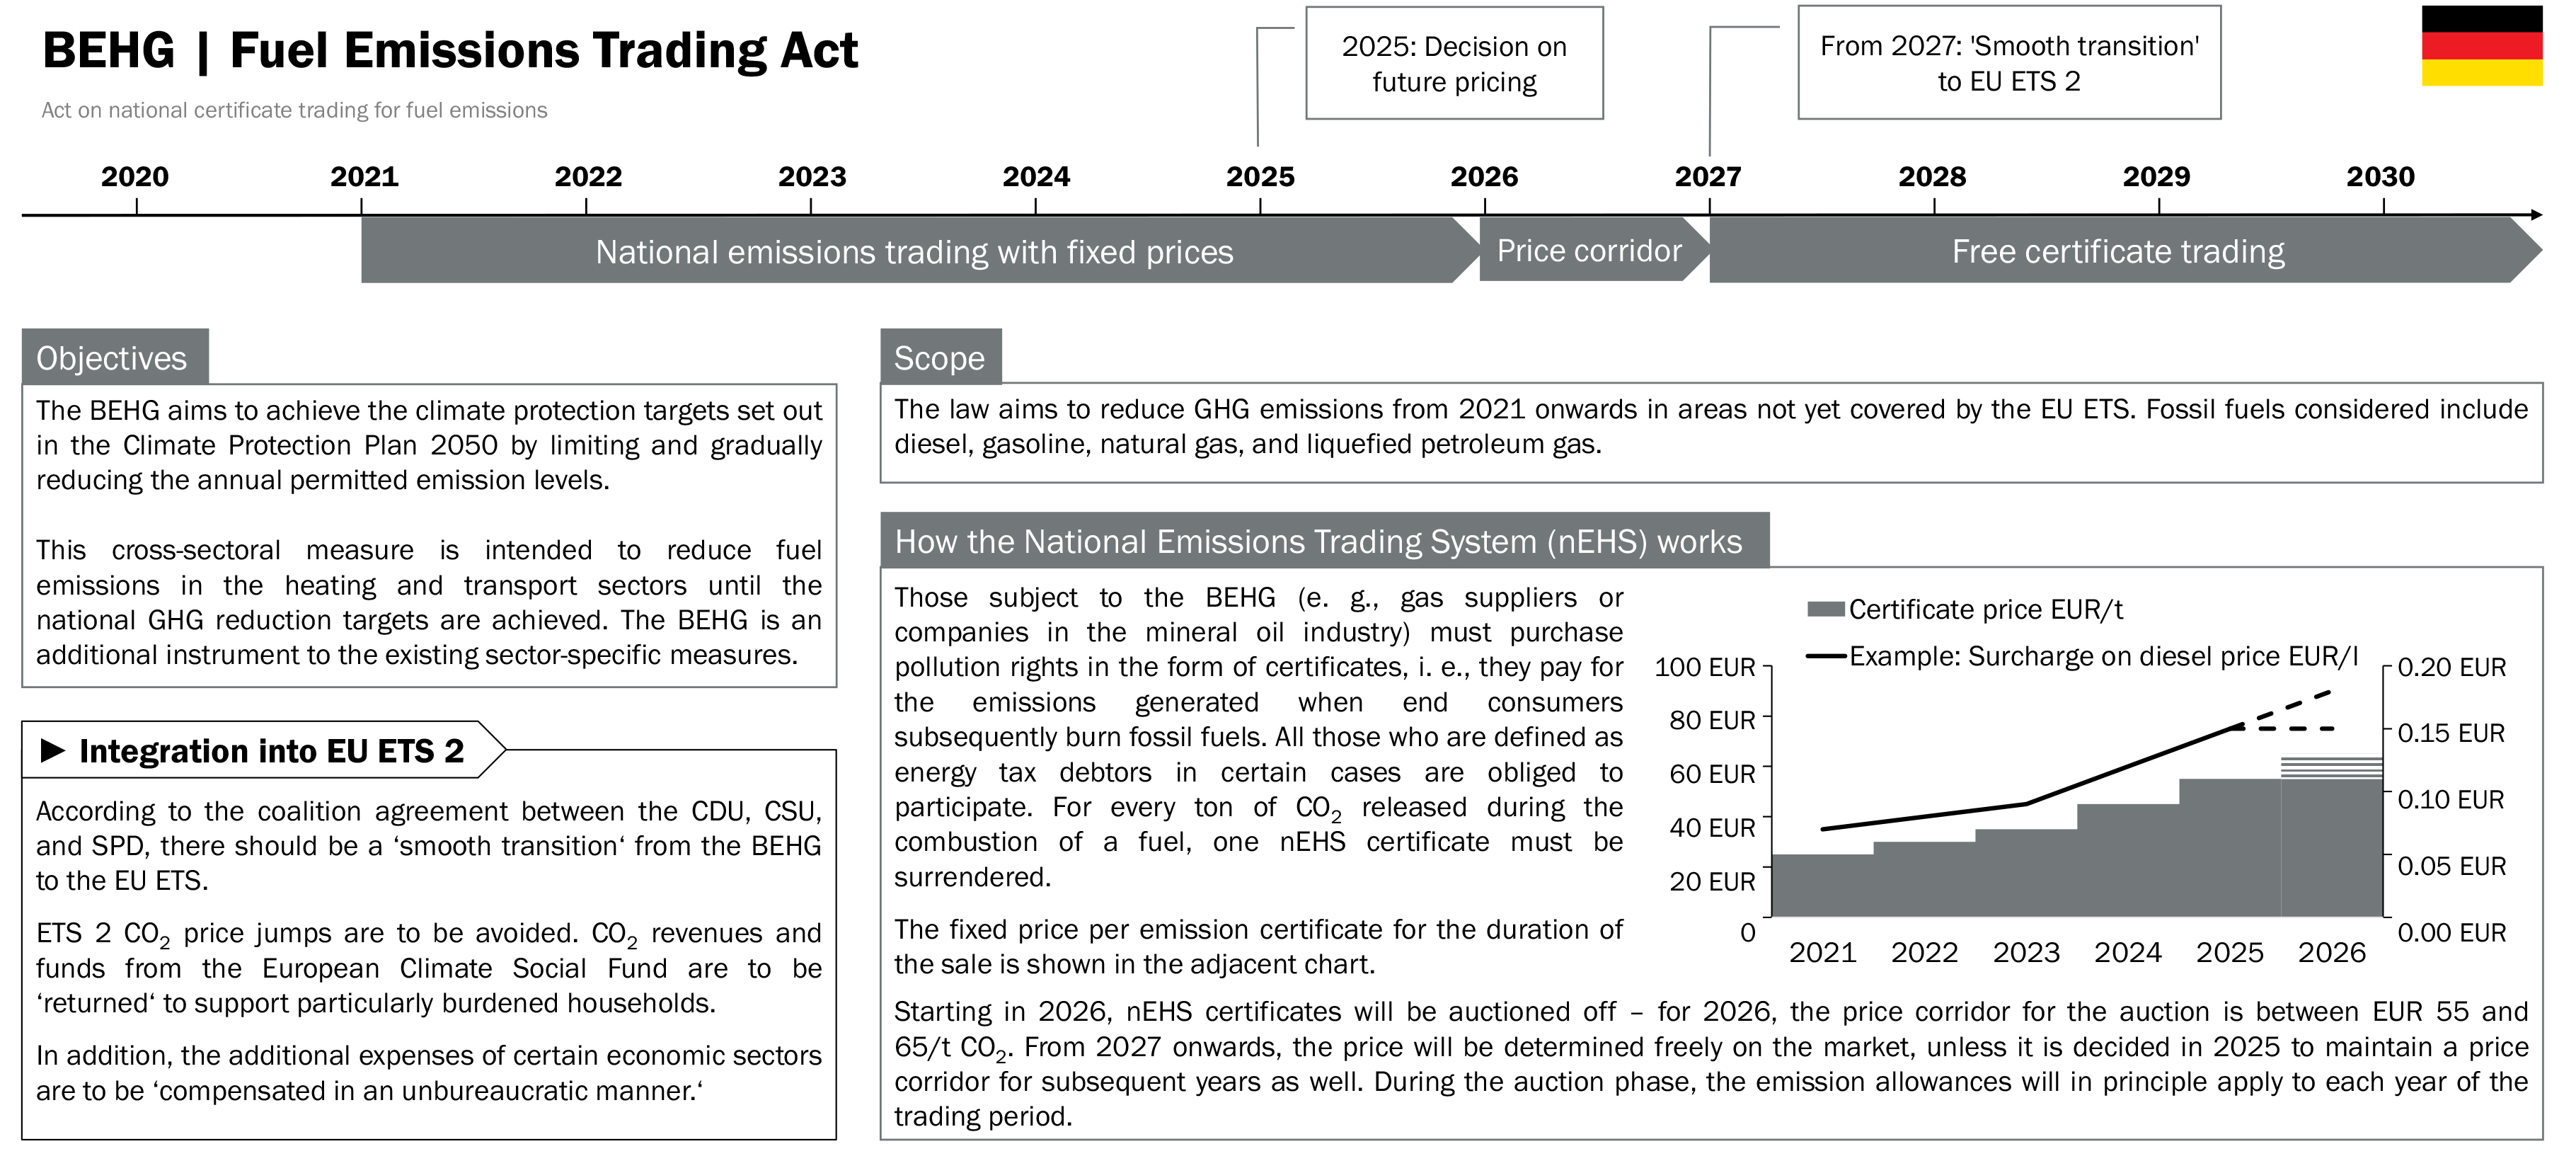
Overview of the Fuel Emissions Trading Act, drawn up in the Innofuels project, updated version on the (InnoFuels-Website)
Fig. 3-14 on page 48
Download [JPG, 1,7 MB]

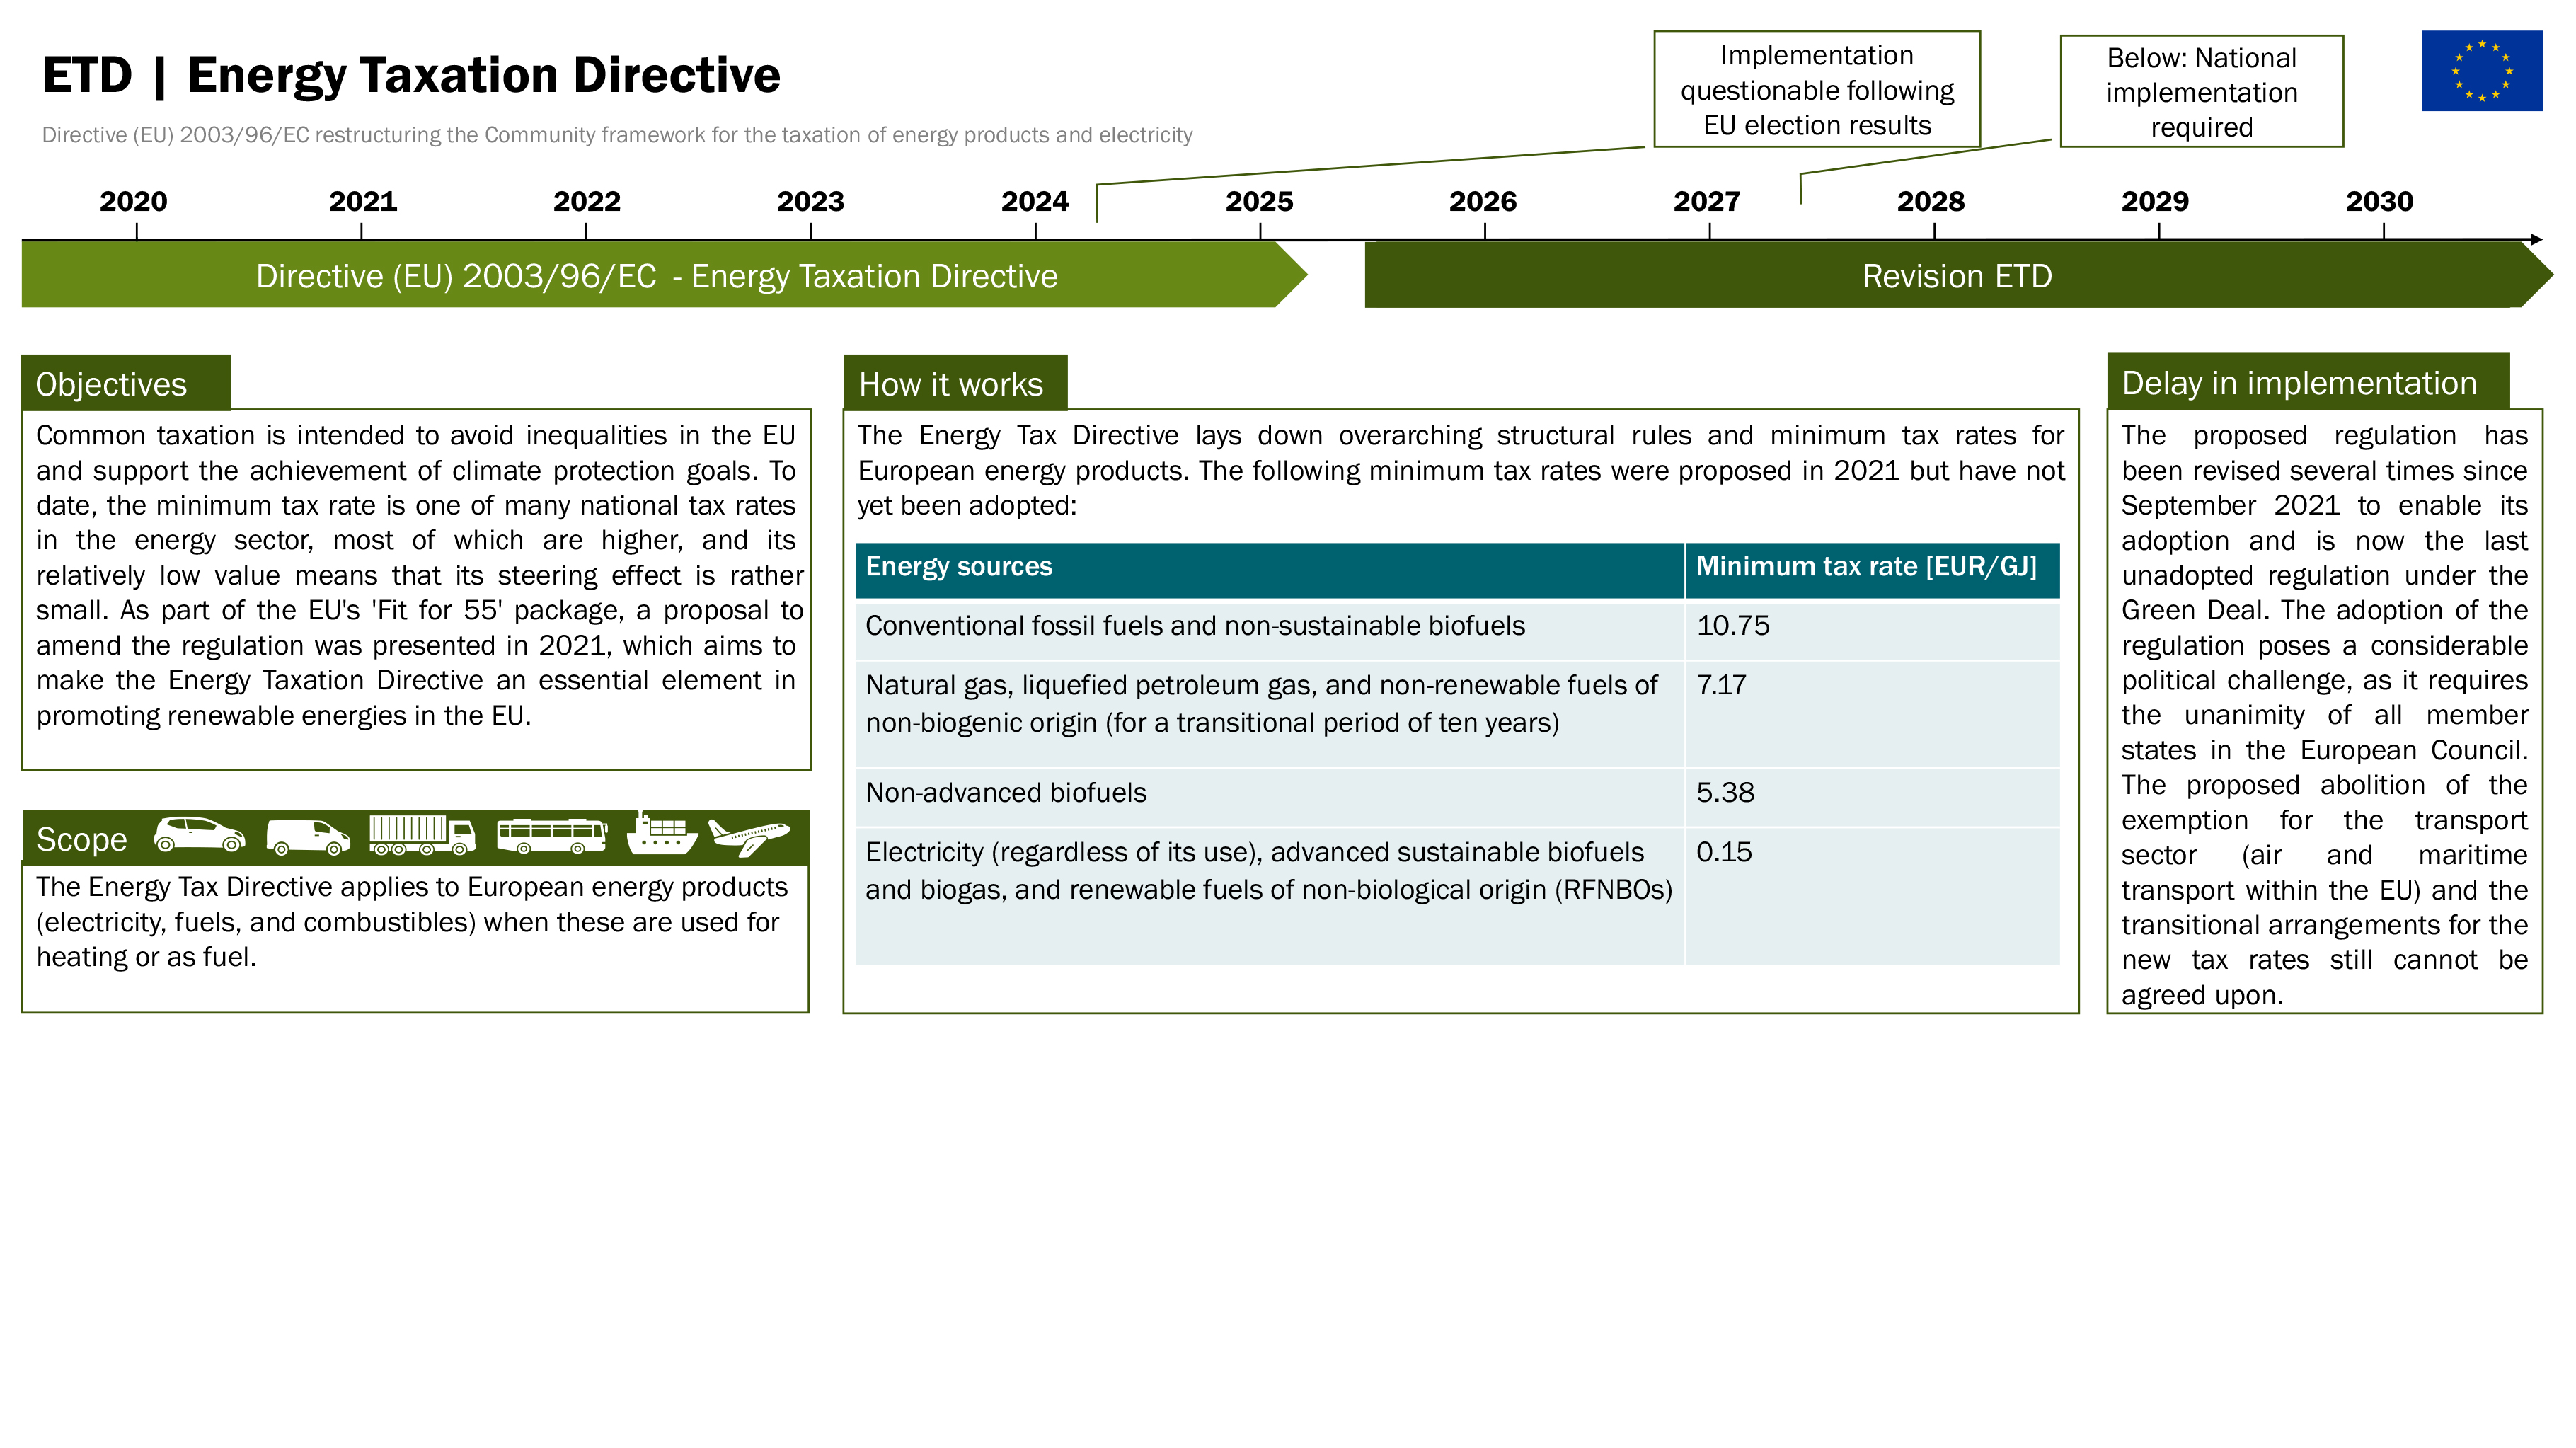
Overview of the Energy Taxation Directive, drawn up in the Innofuels project, updated version on the (InnoFuels-Website)
Fig. 3-15 on page 49
Download [JPG, 1,8 MB]
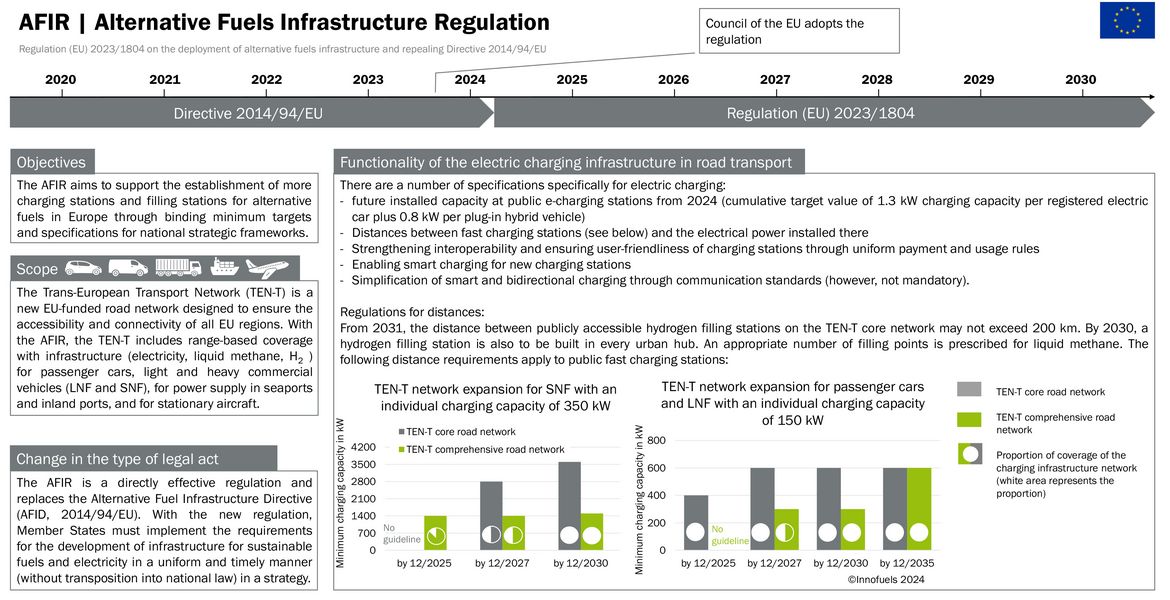
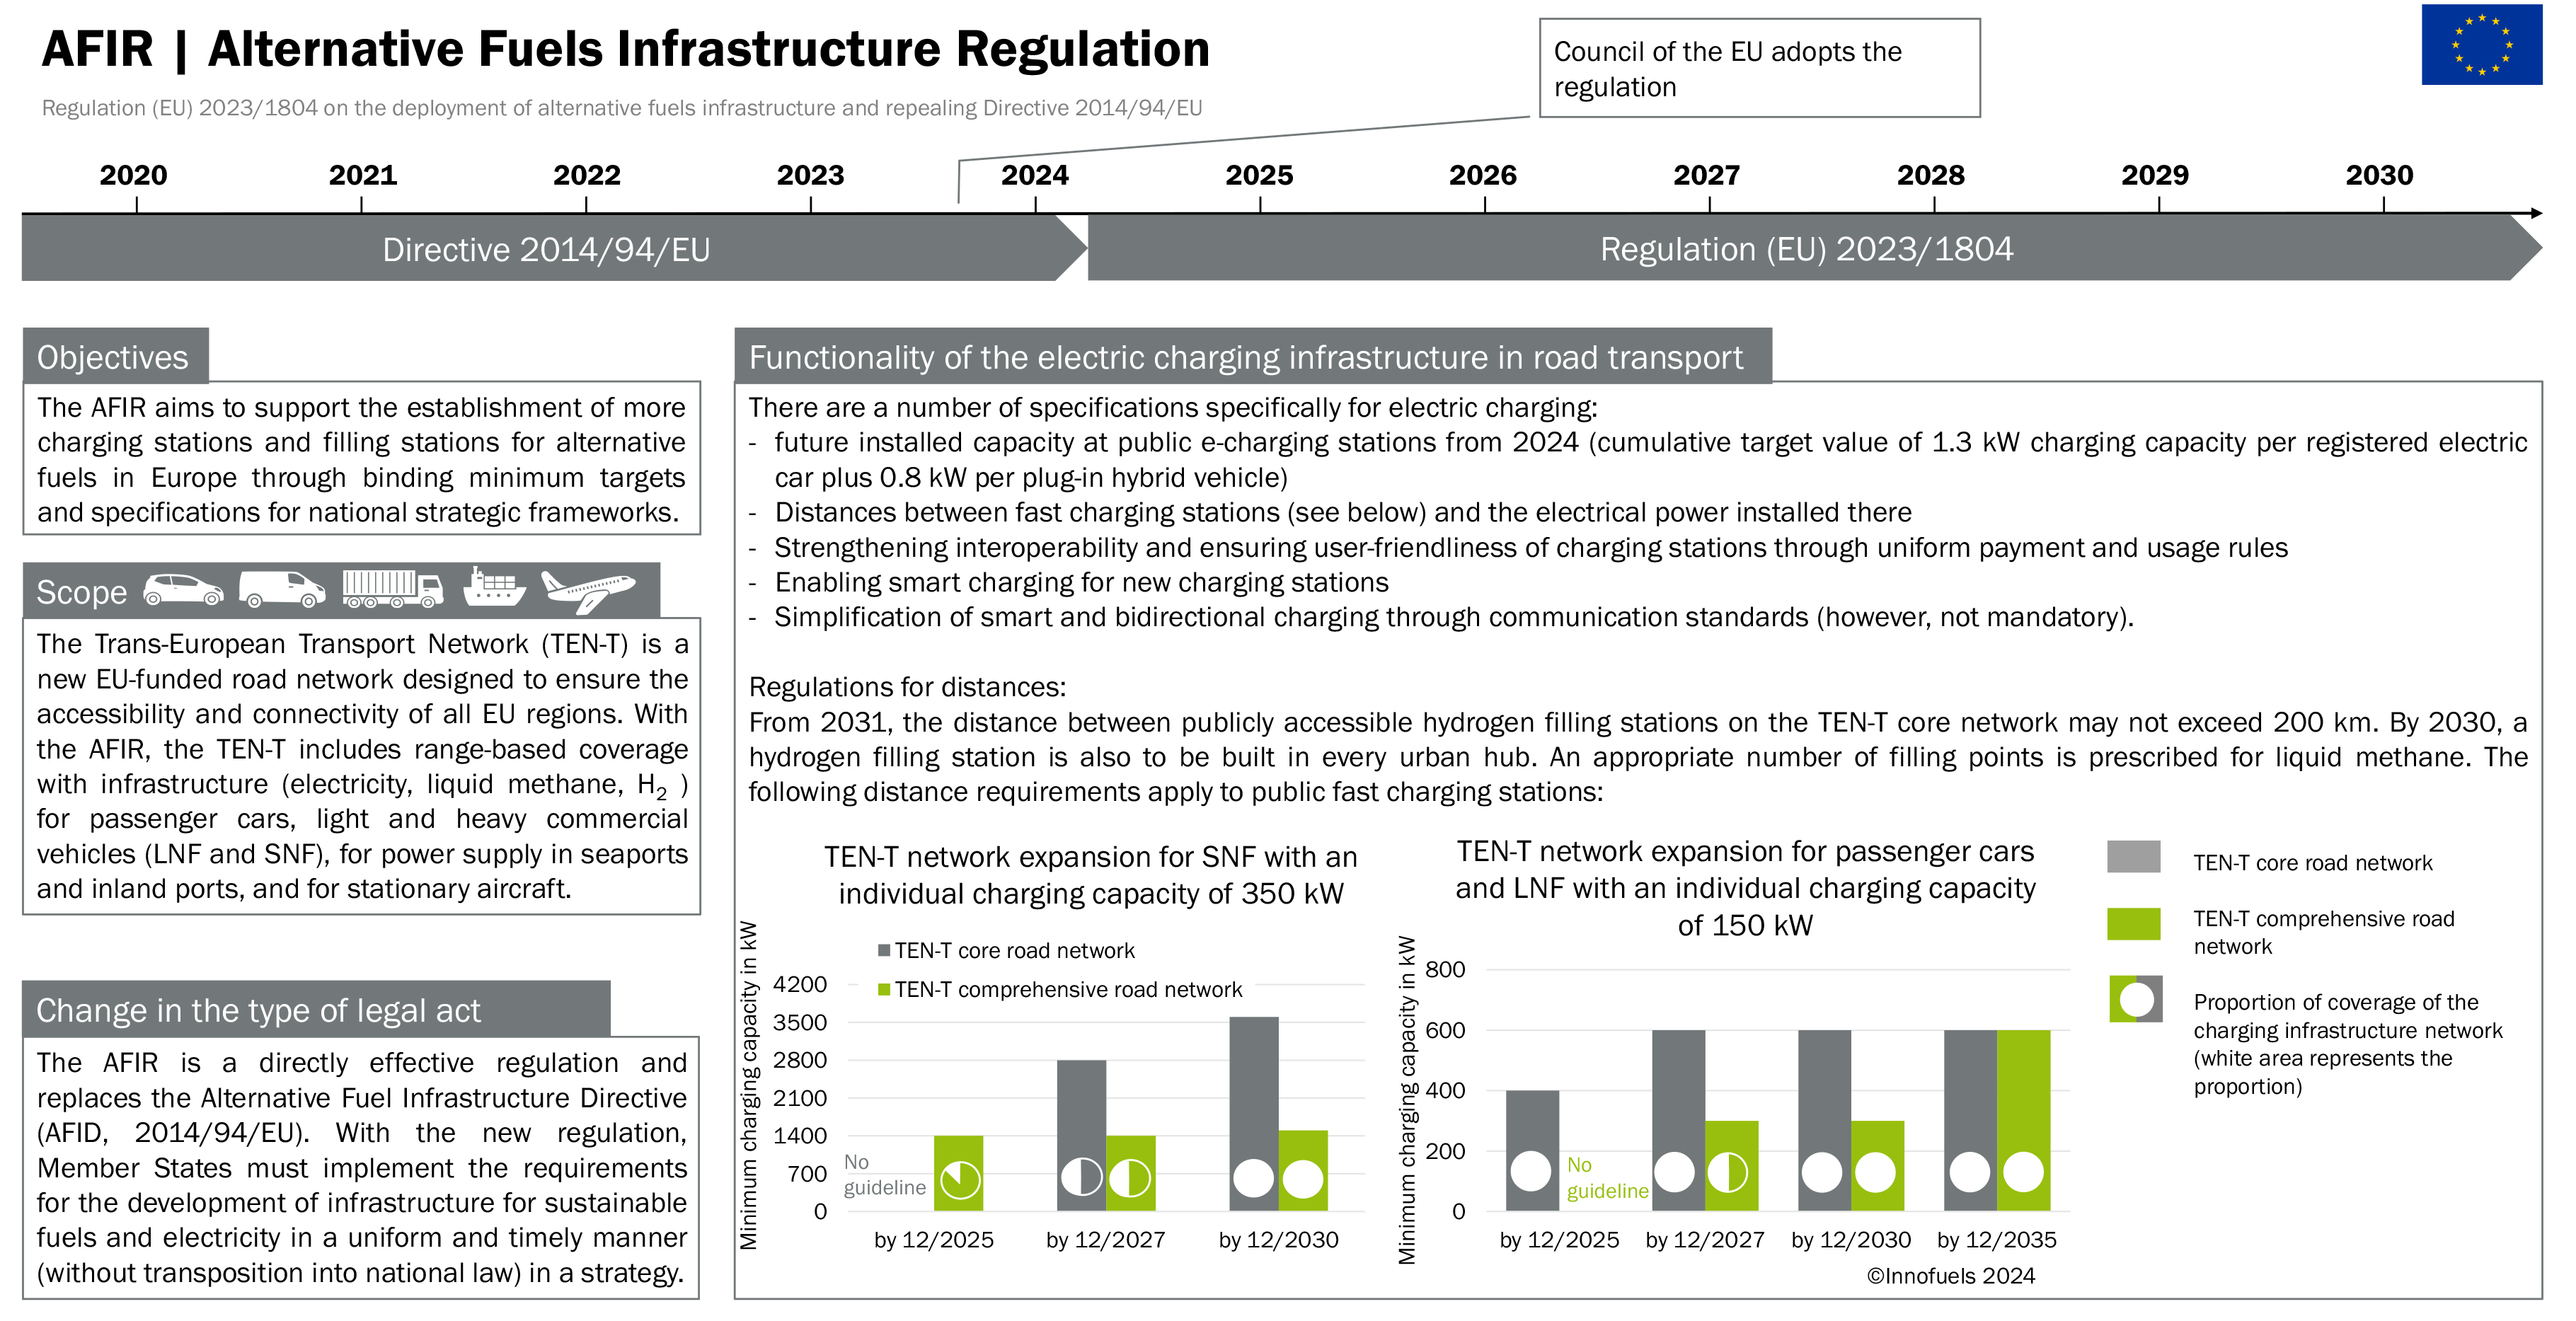
Overview of the Alternative Fuels Infrastructure Regulation (AFIR), drawn up in the Innofuels project, updated version on the (InnoFuels-Website)
Fig. 3-16 on page 50
Download [JPG, 2 MB]
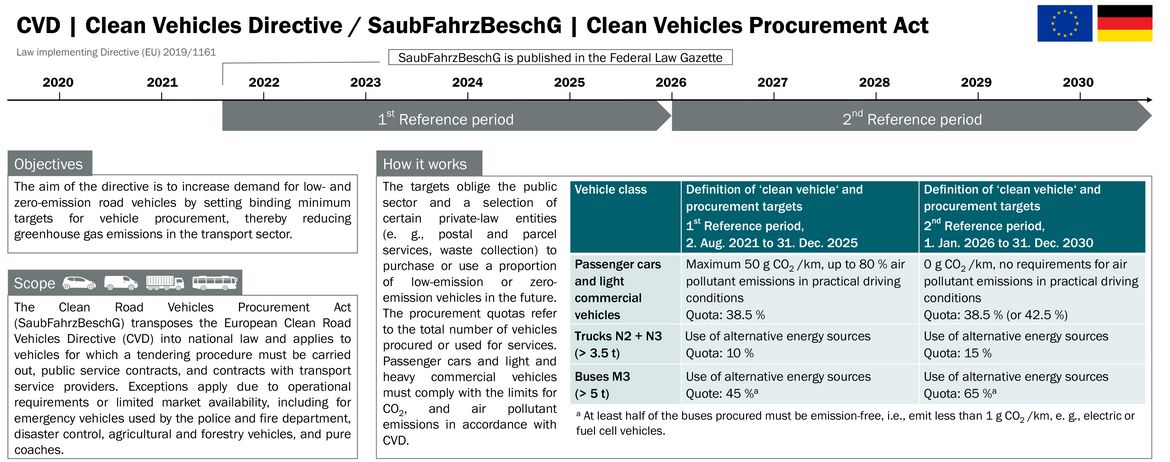
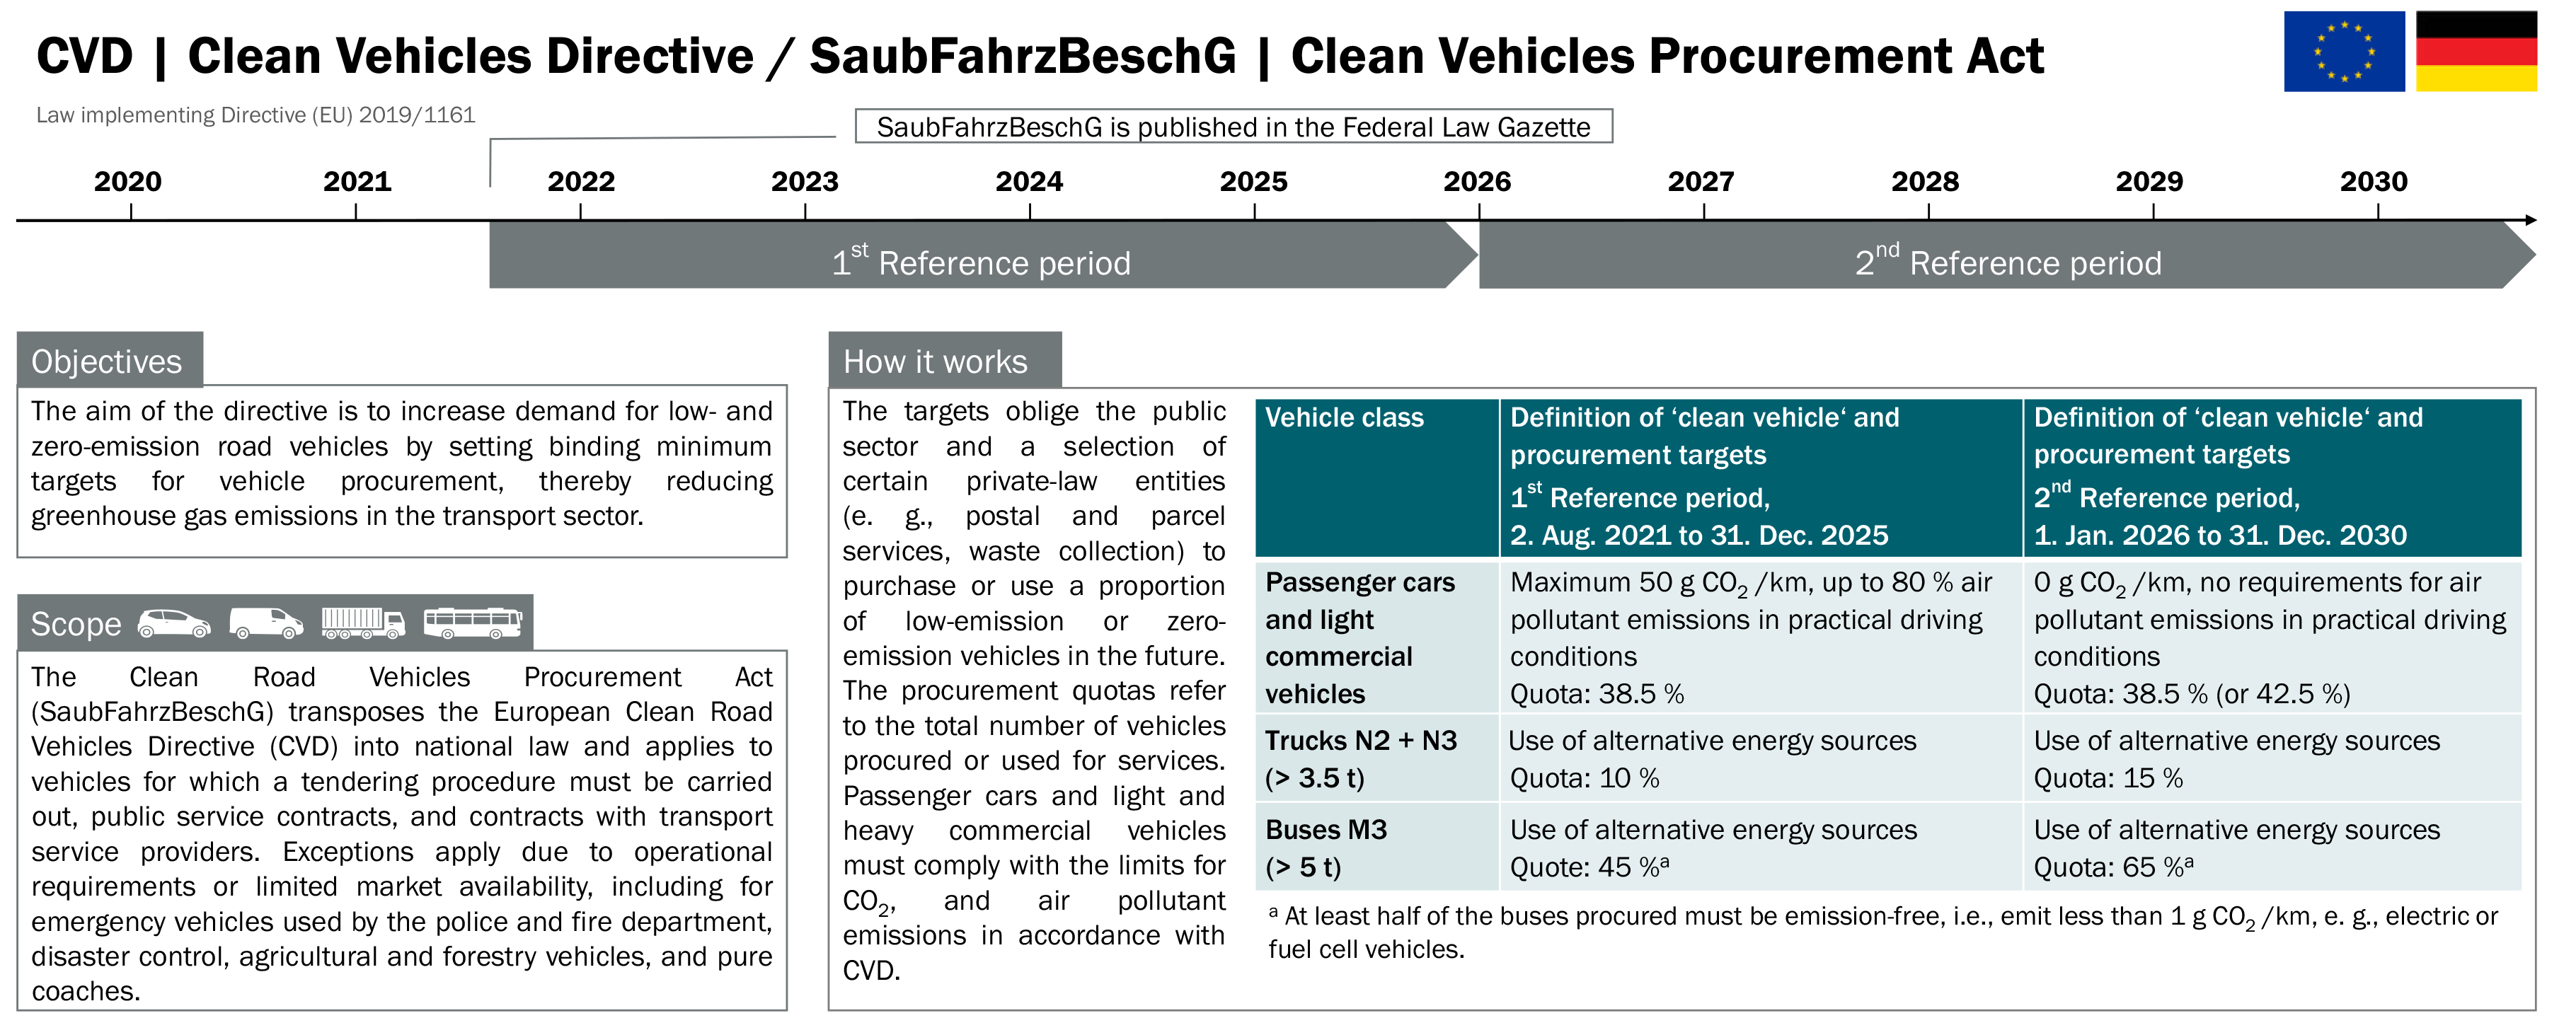
Overview of the Clean Vehicles Directive (CVD) and the Clean Vehicles Procurement Act, drawn up in the Innofuels project, updated version on the (InnoFuels-Website)
Fig. 3-17 on page 52
Download [JPG, 1,8 MB]
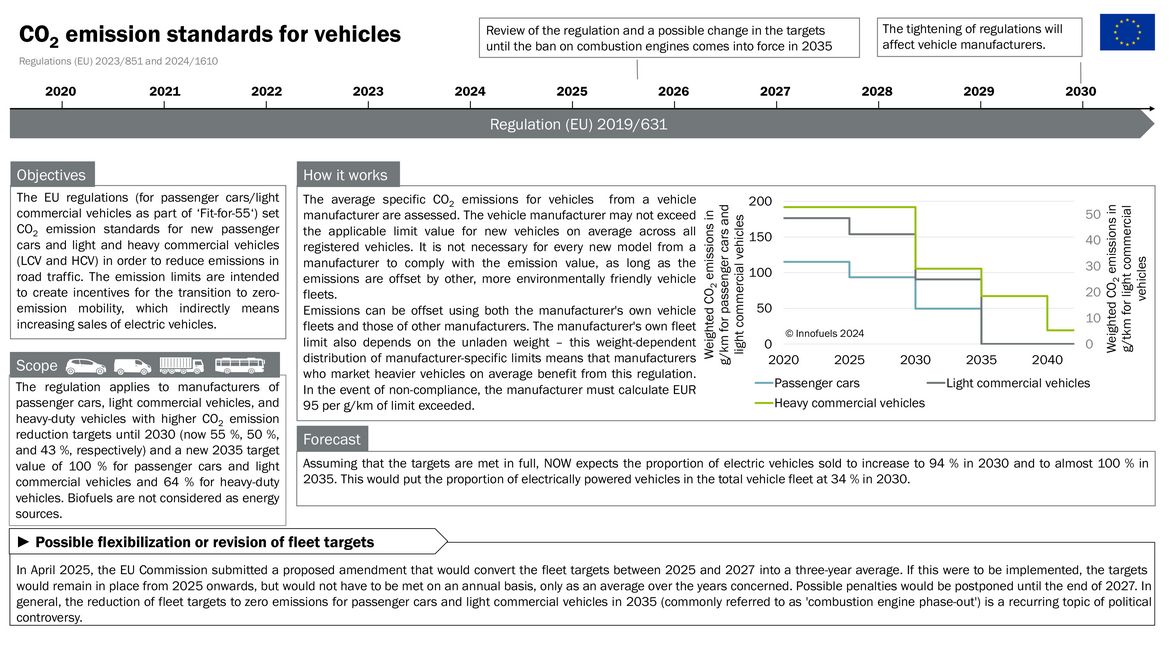
Overview of fleet limits, drawn up in the Innofuels project, updated version on (InnoFuels-Website)
Fig. 3-18 on page 53
Download [JPG, 2,2 MB]
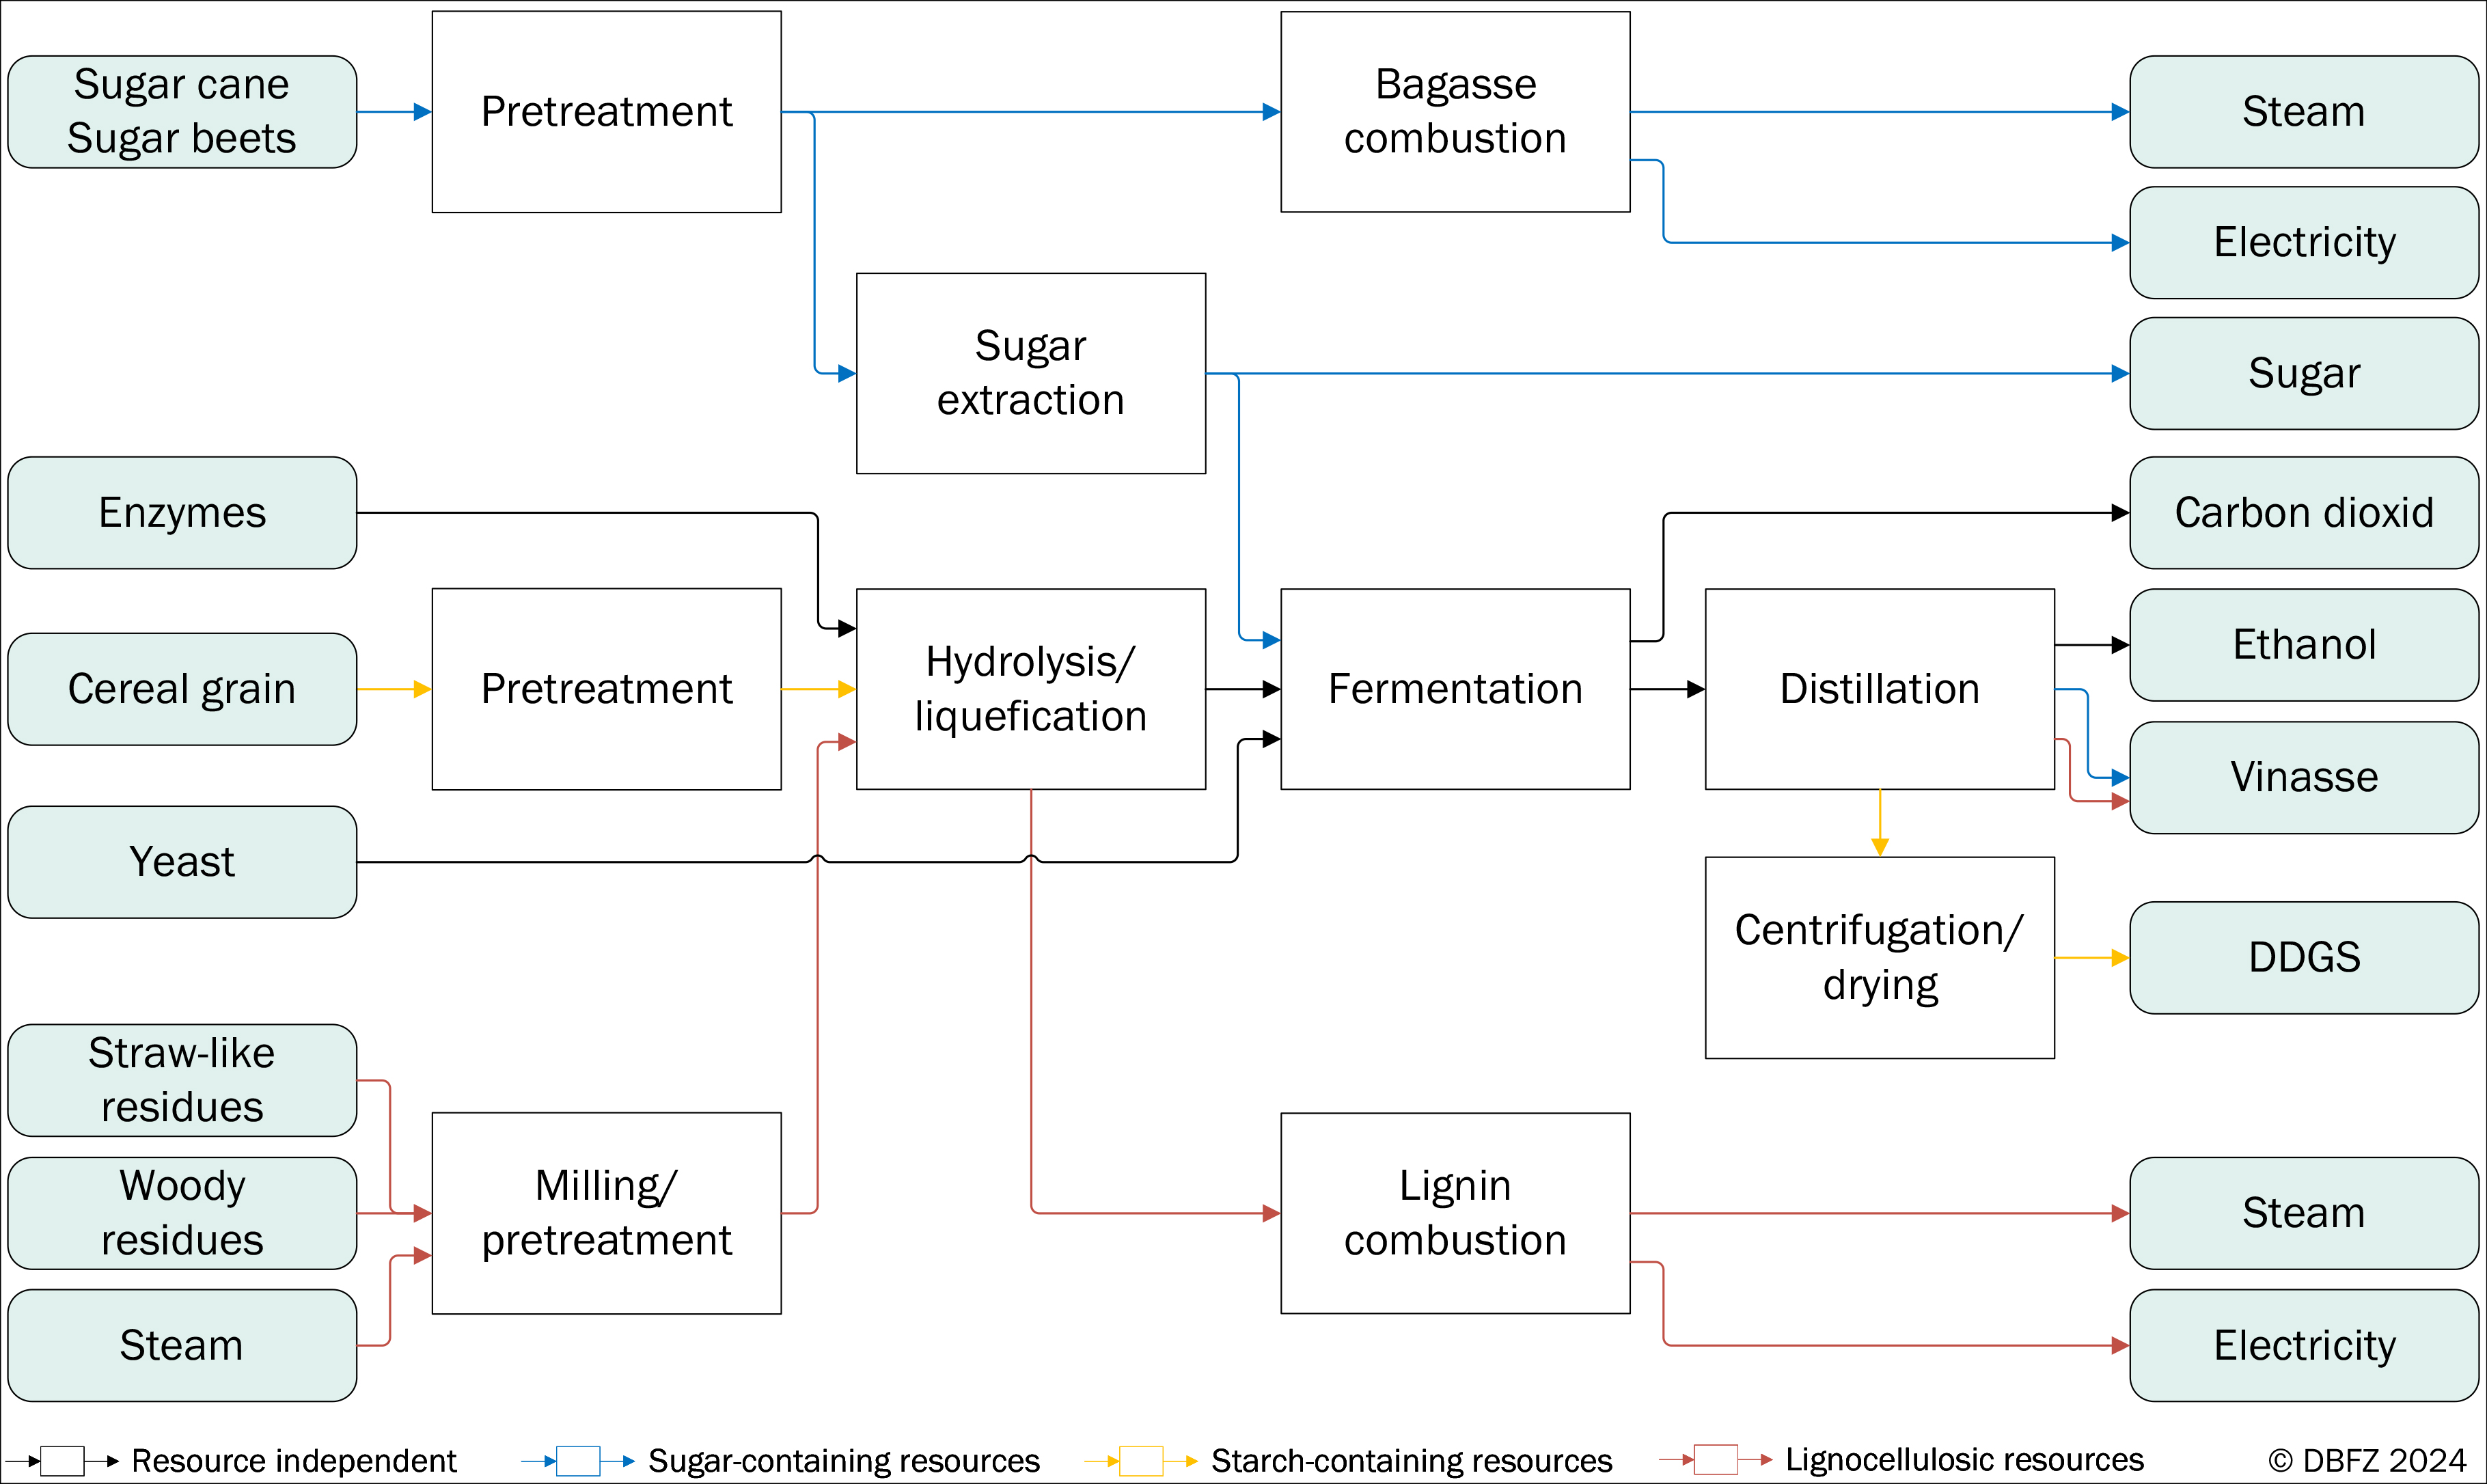
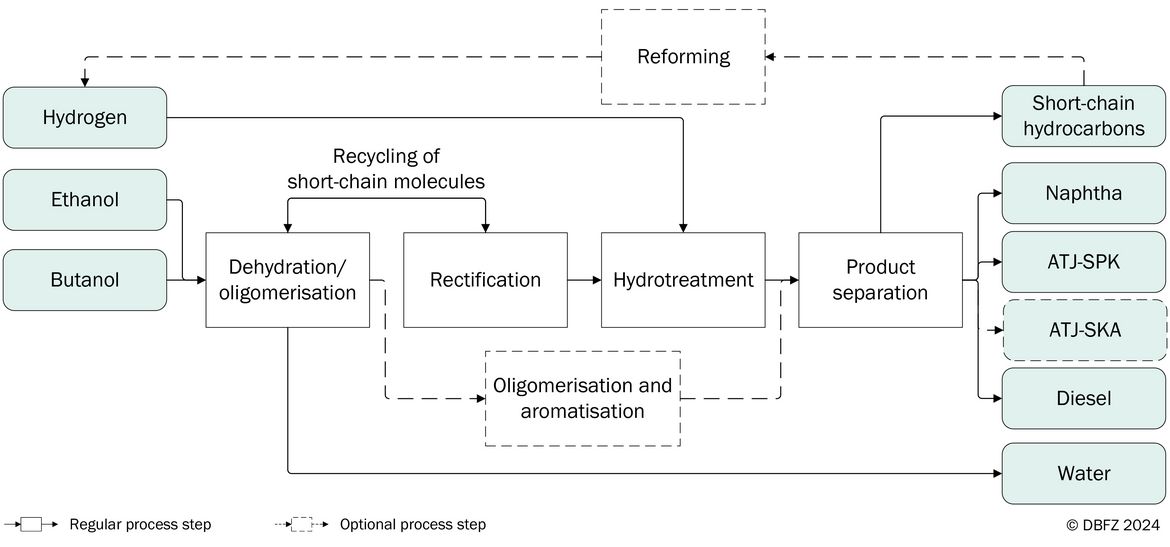
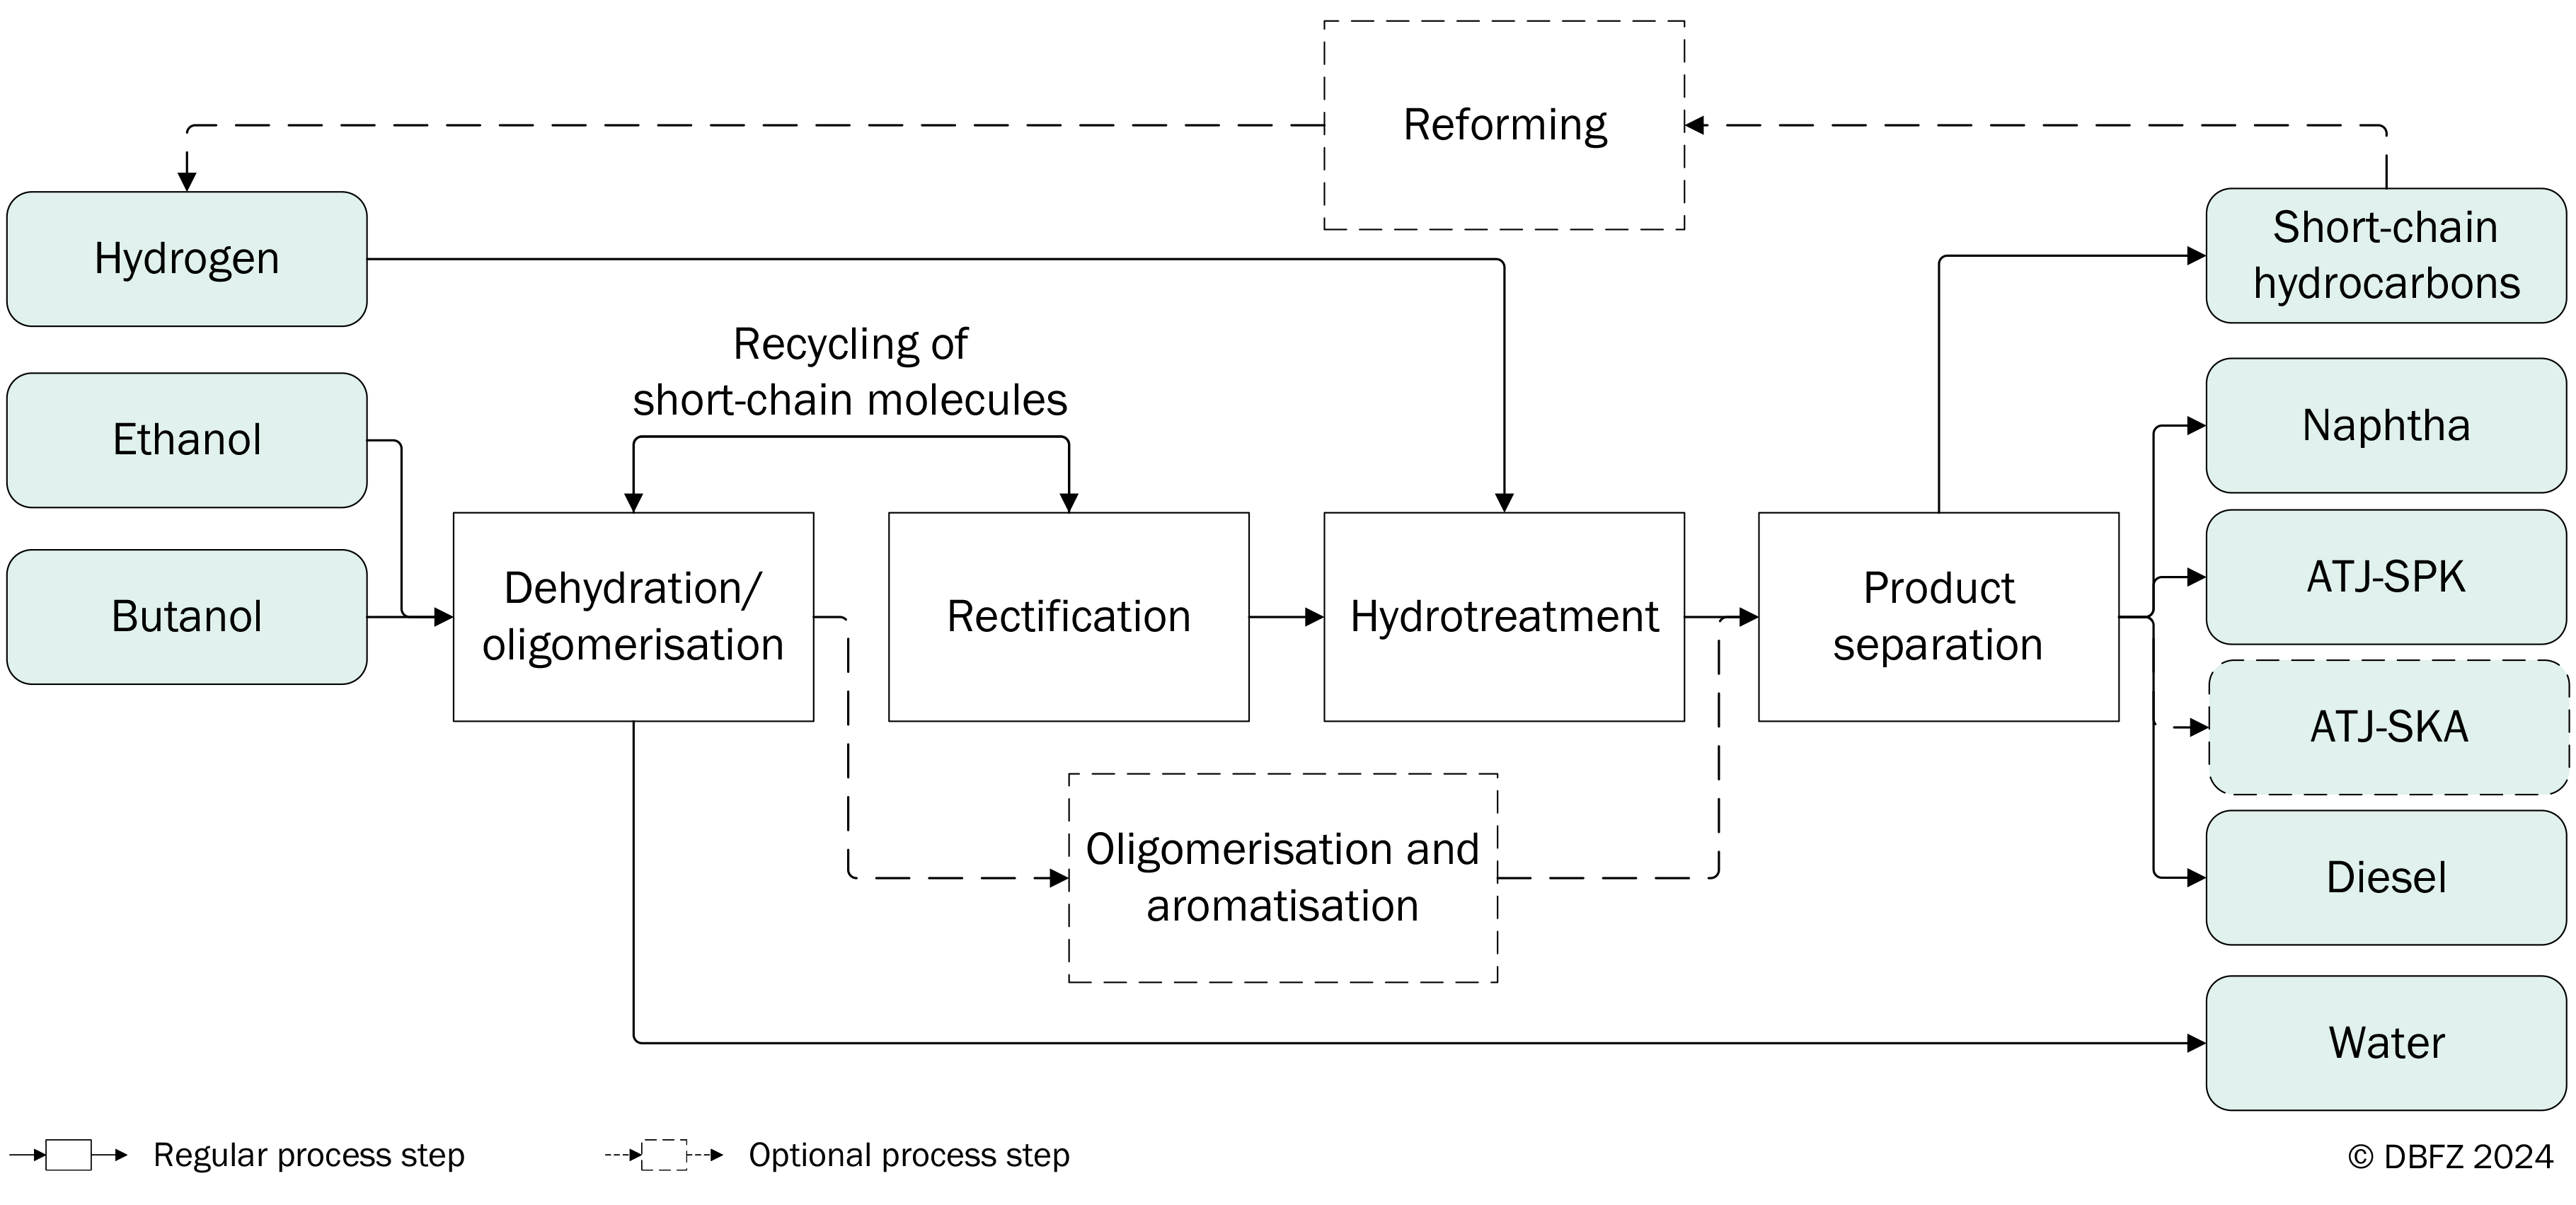
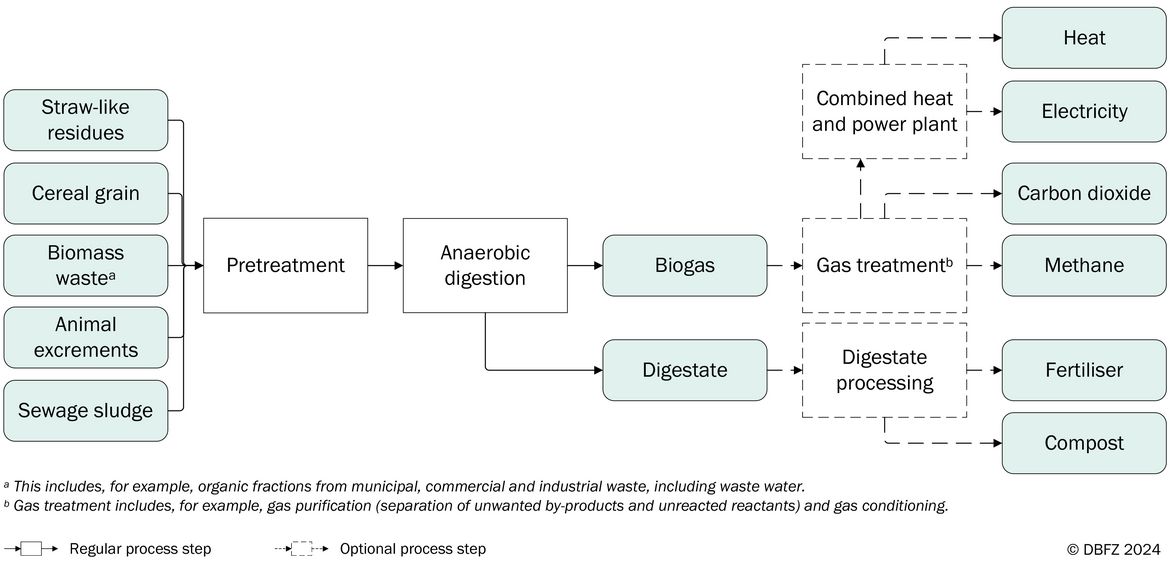
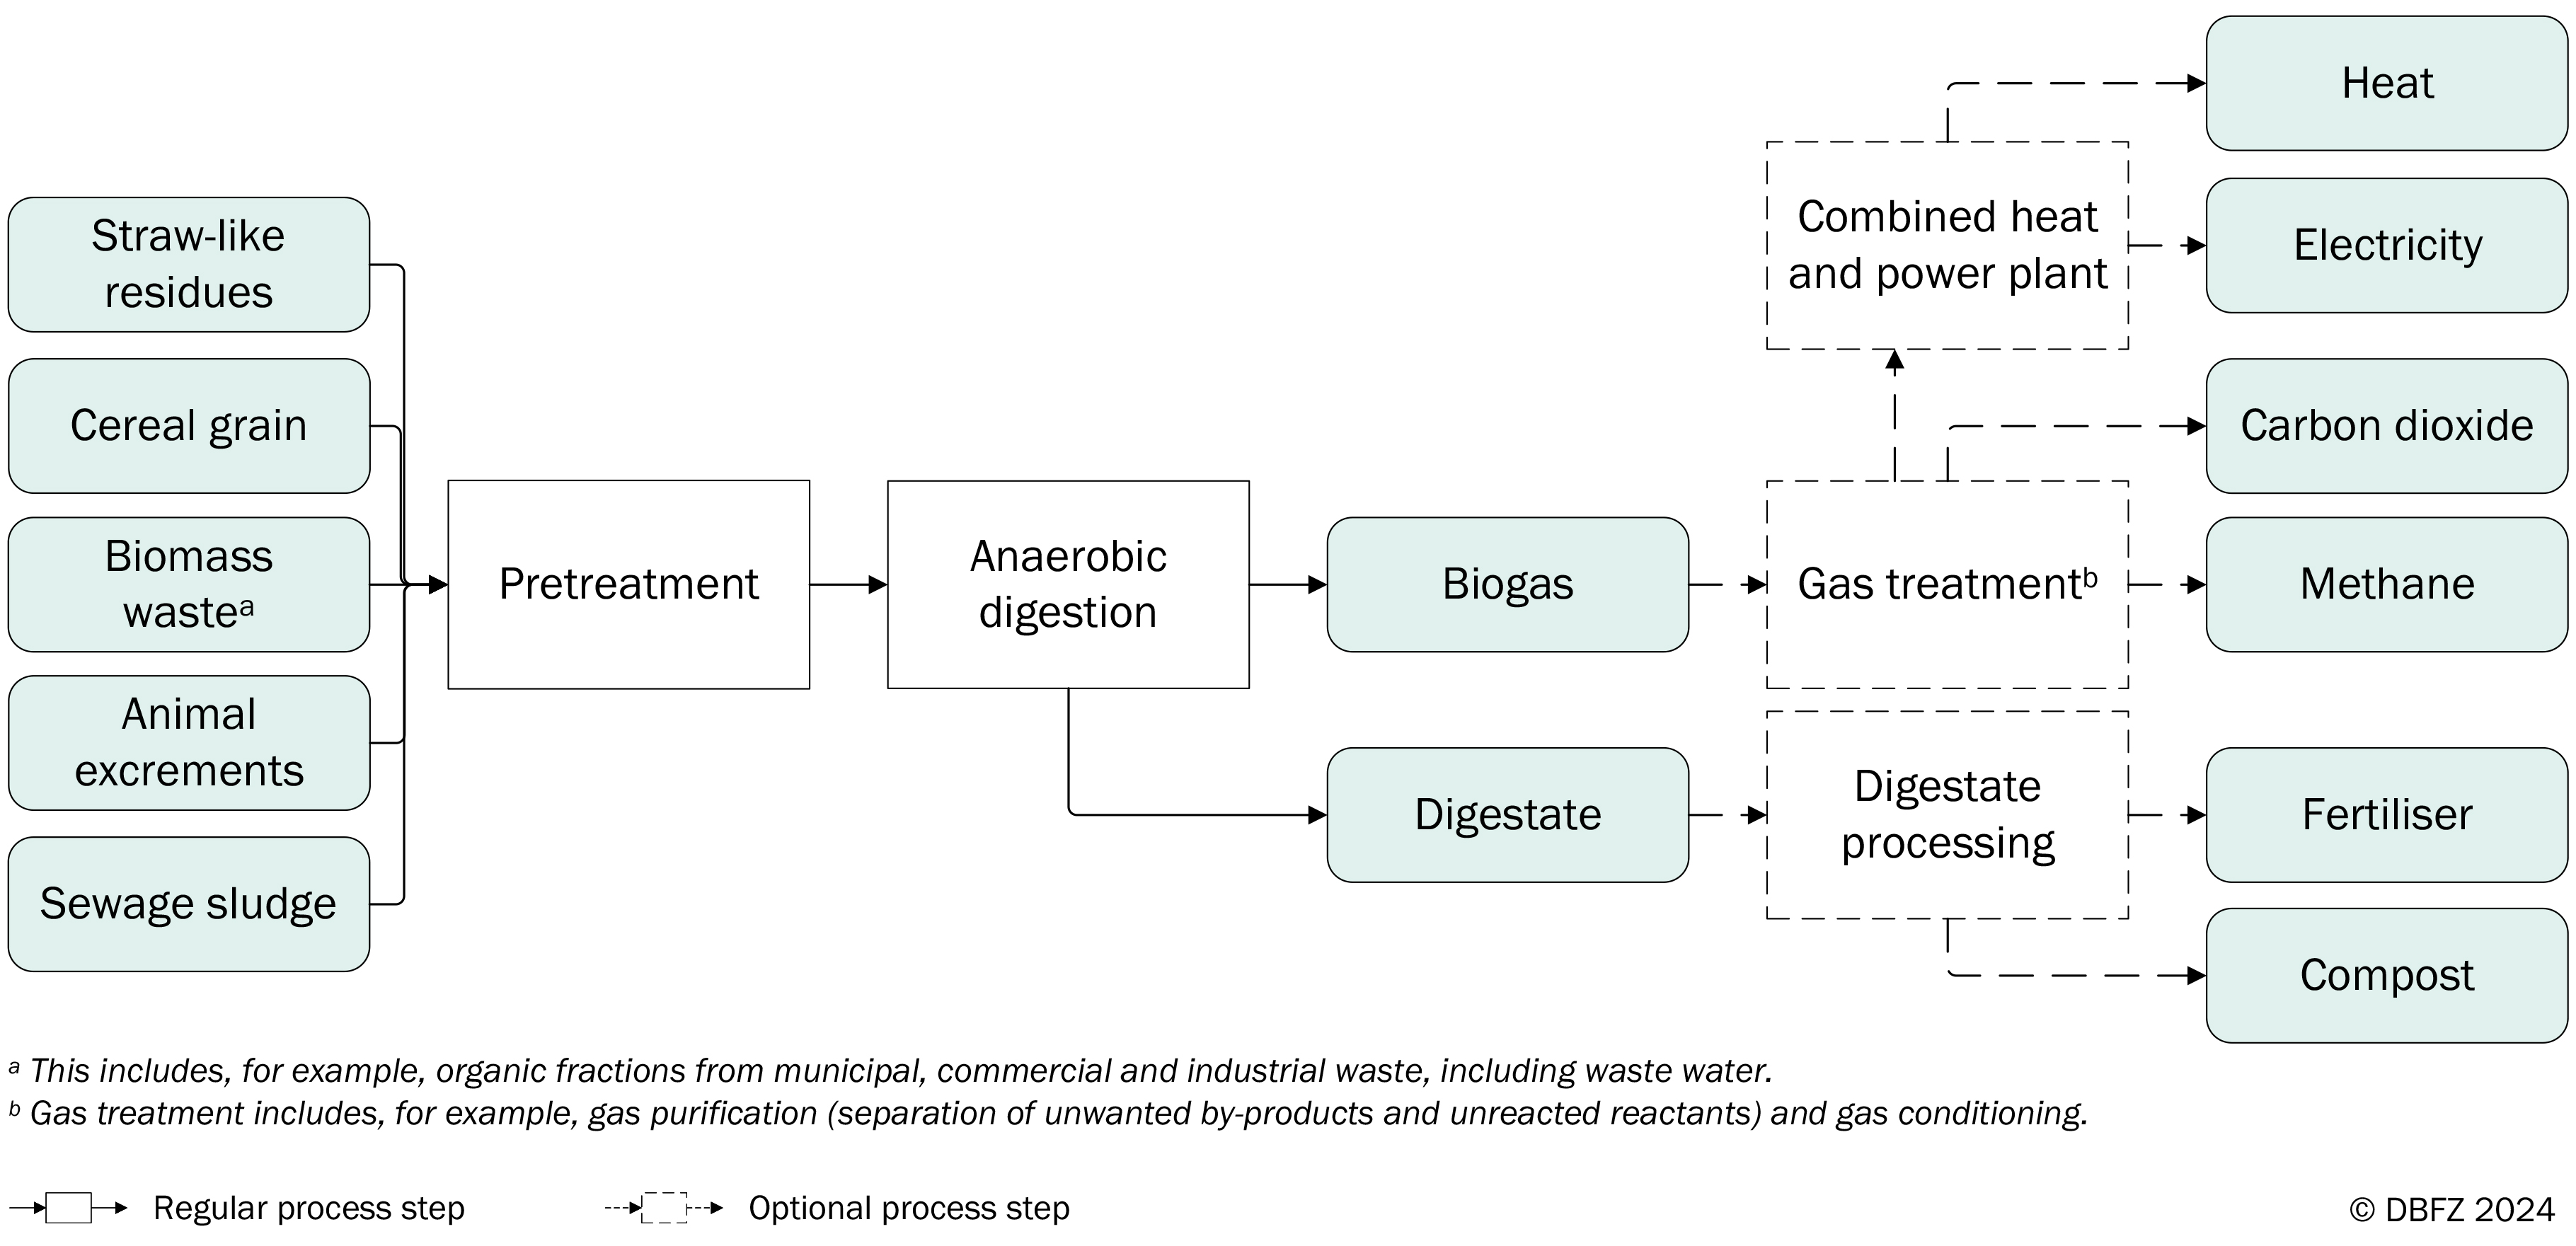
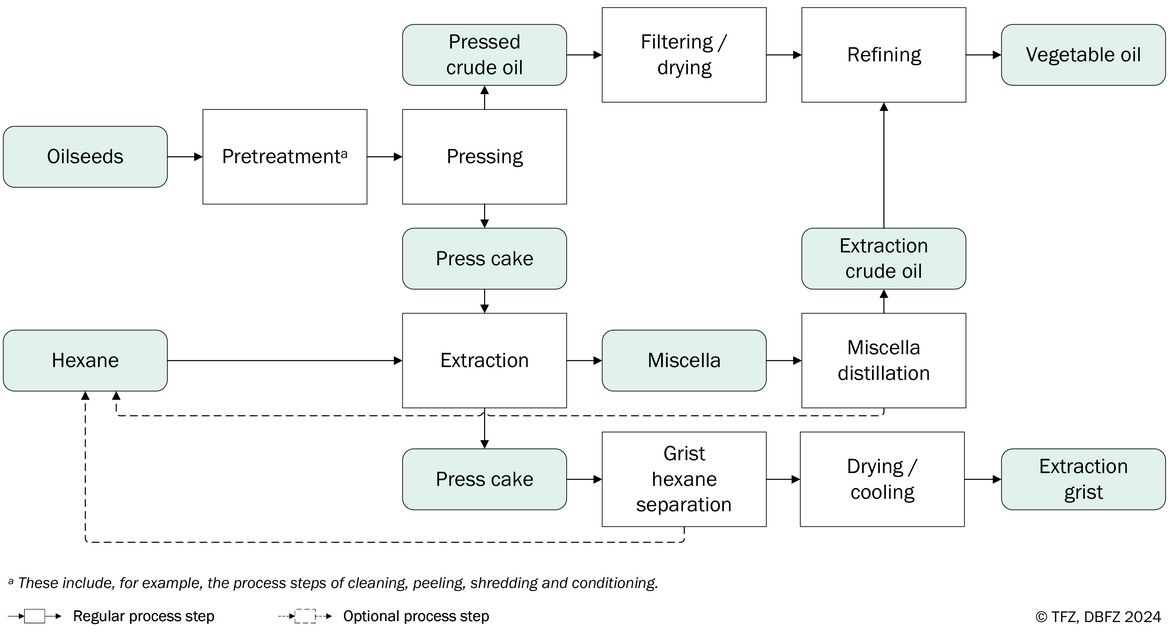
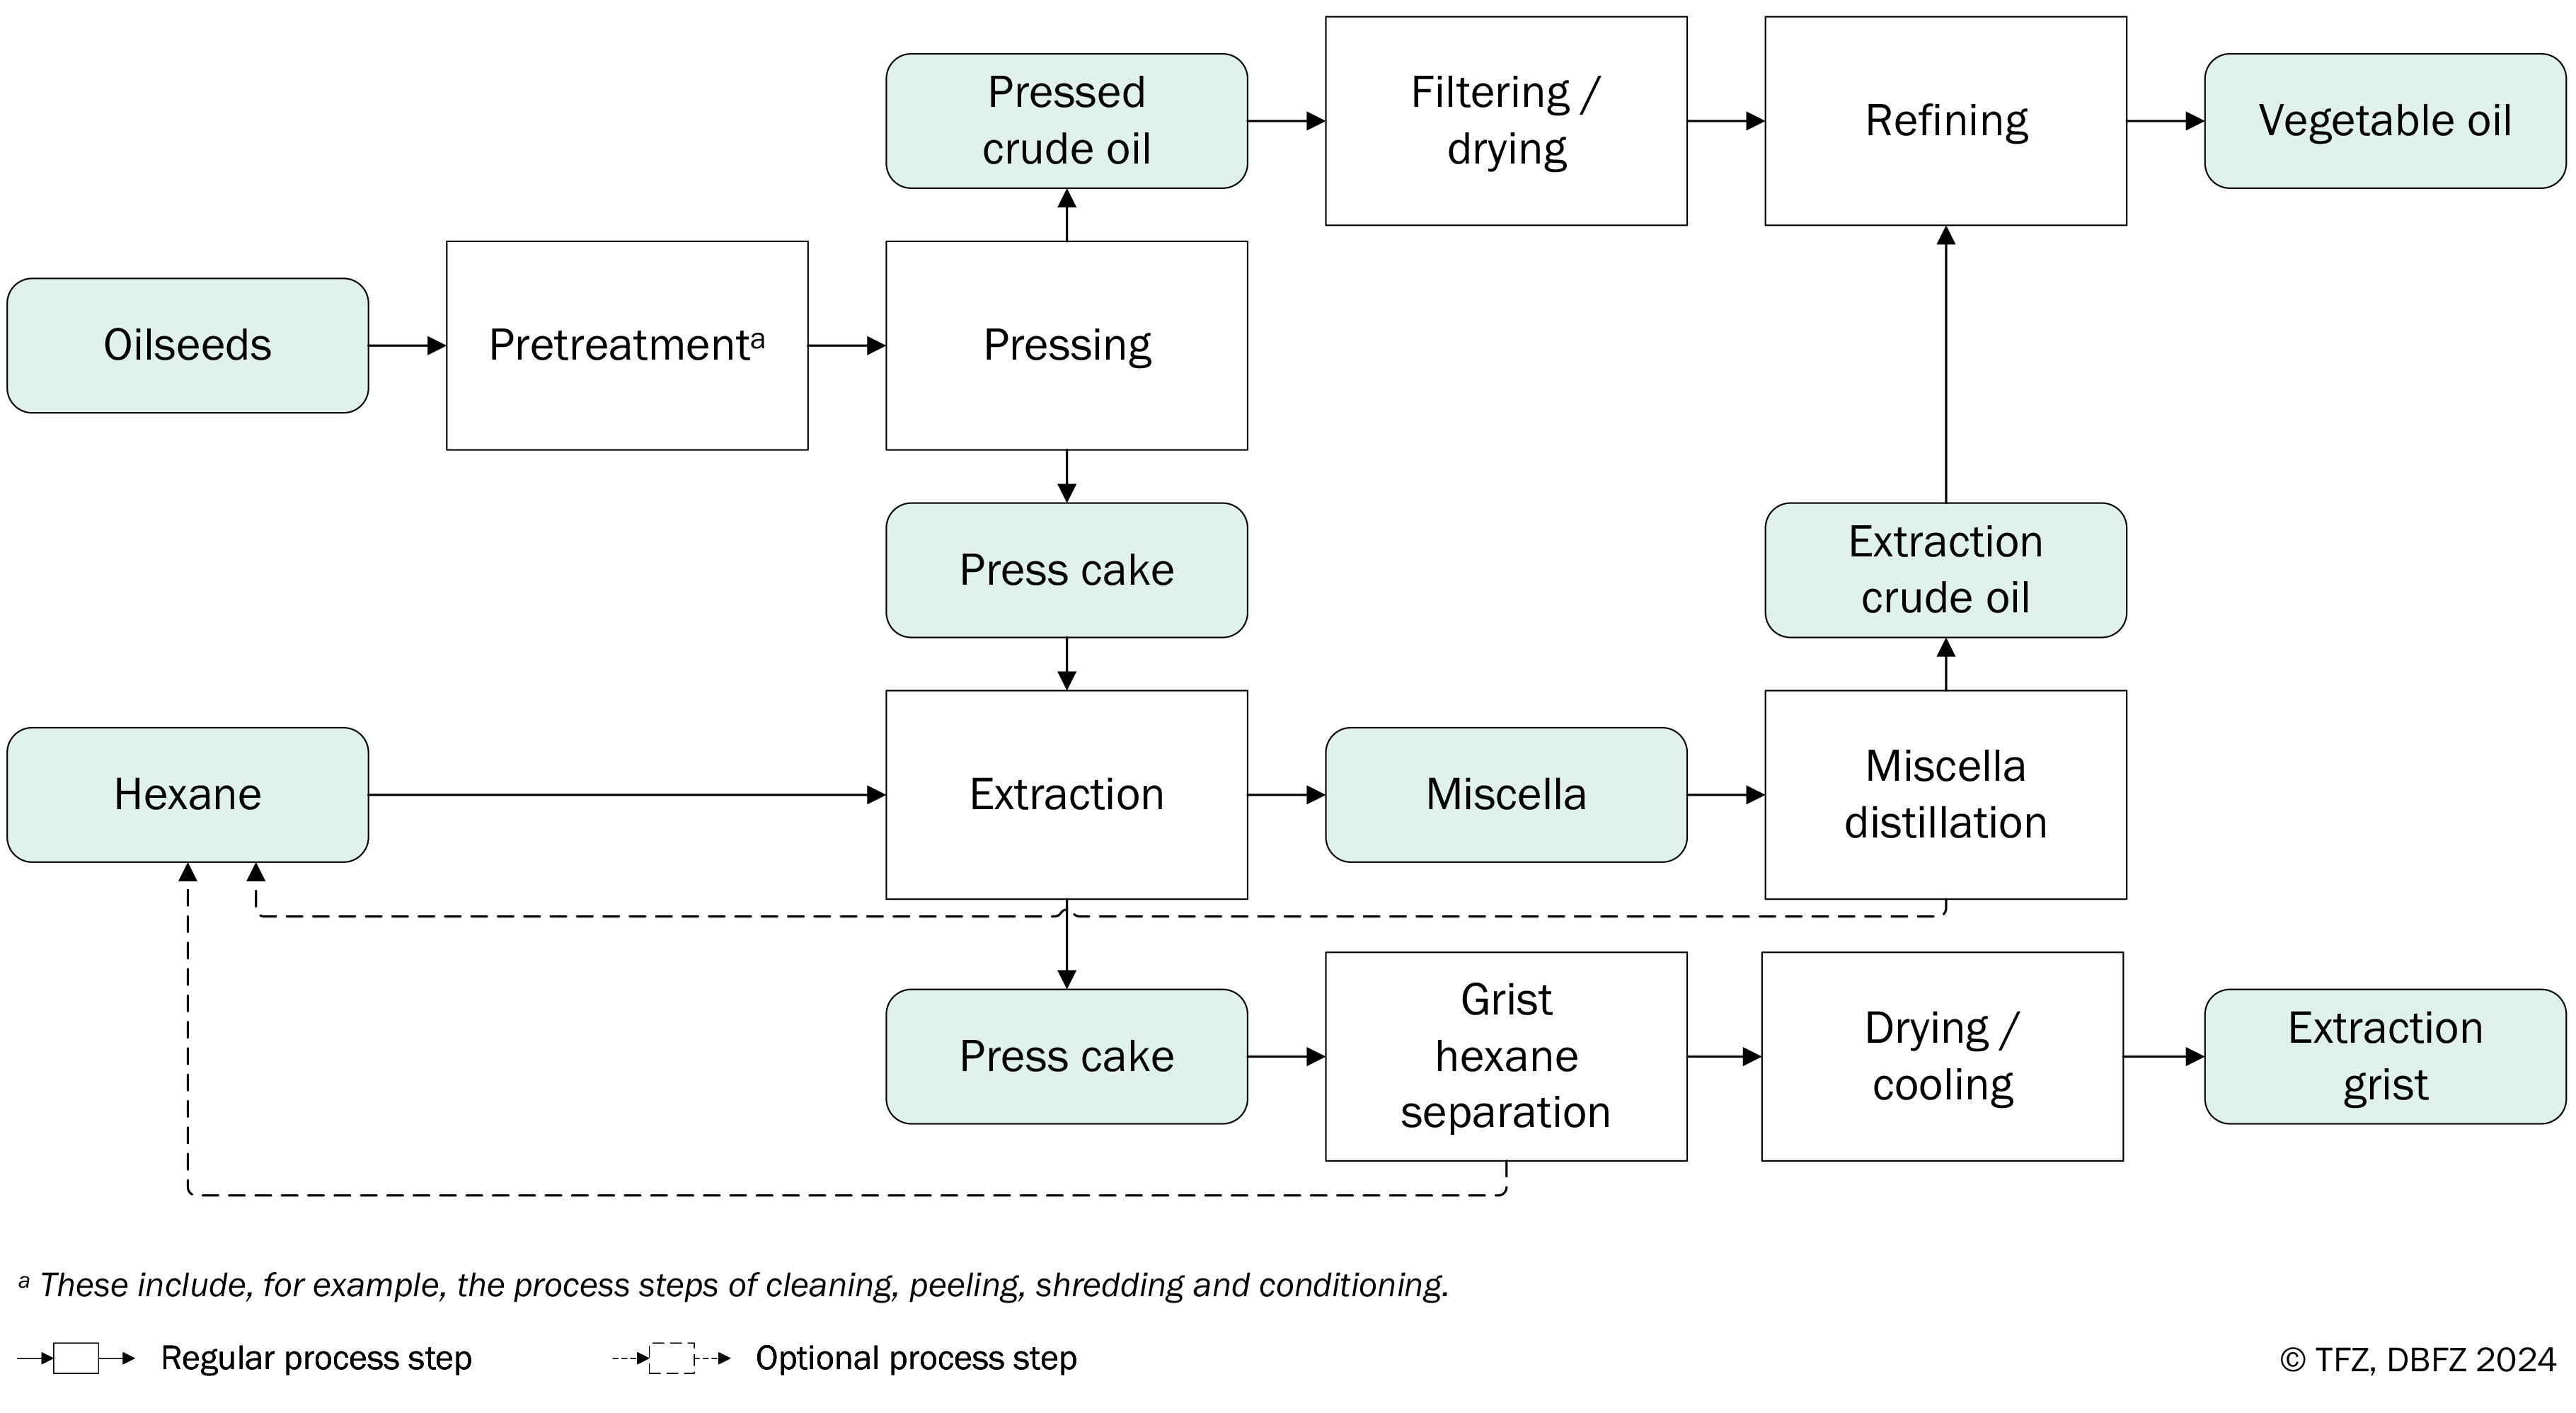
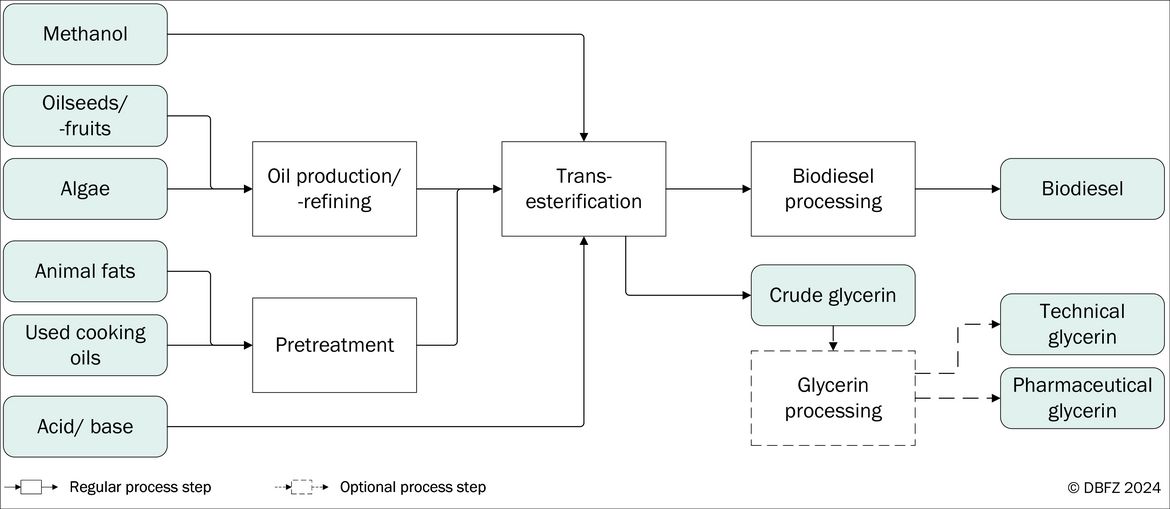
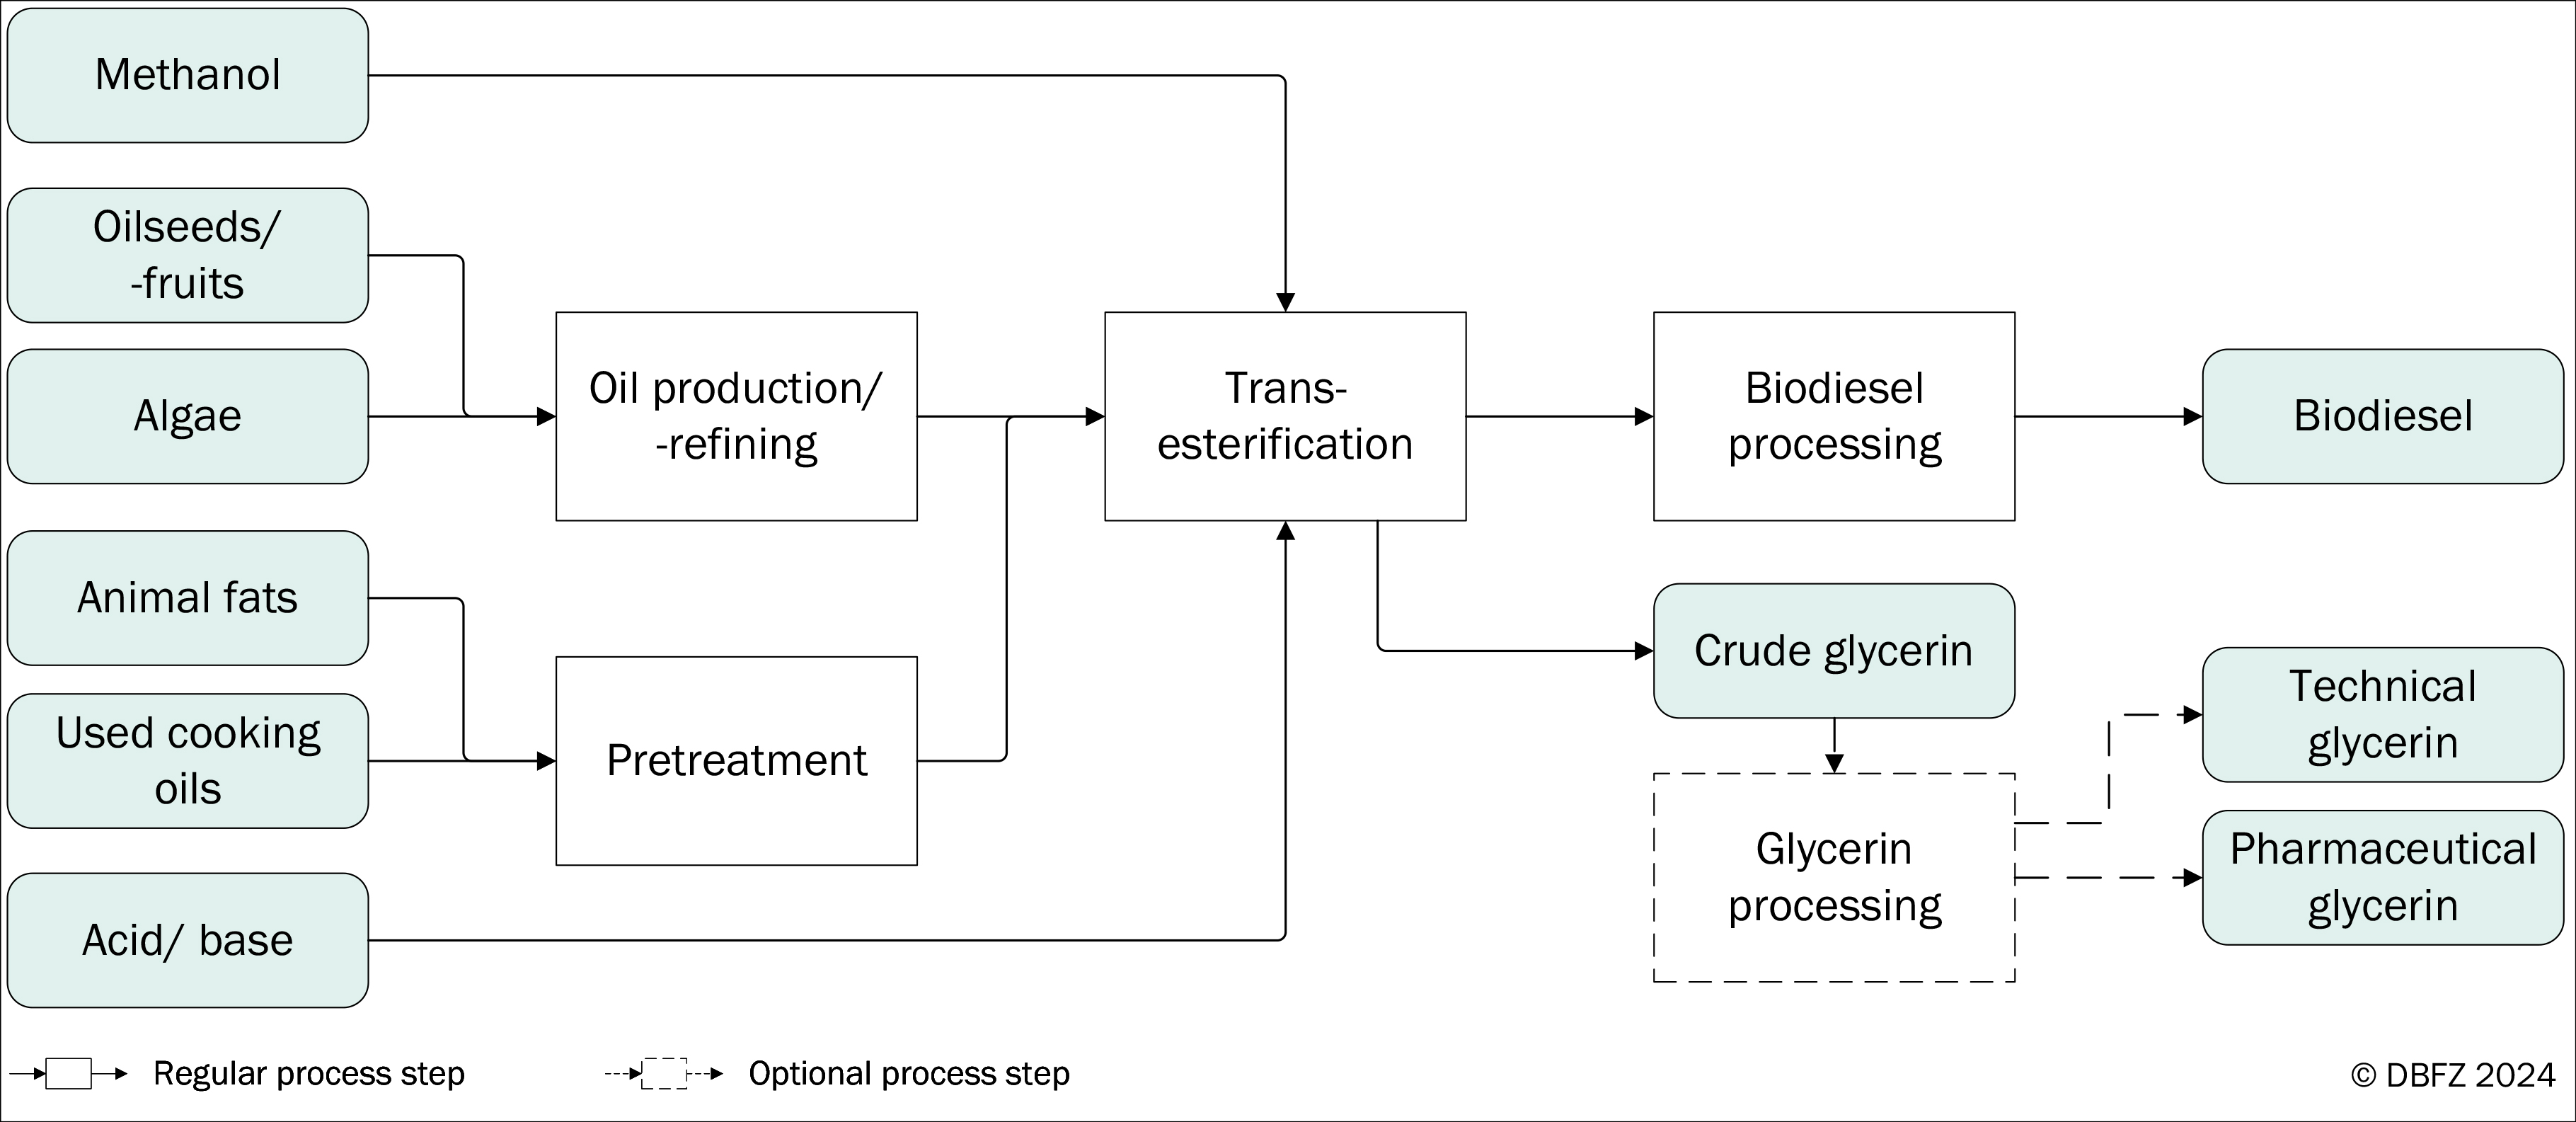
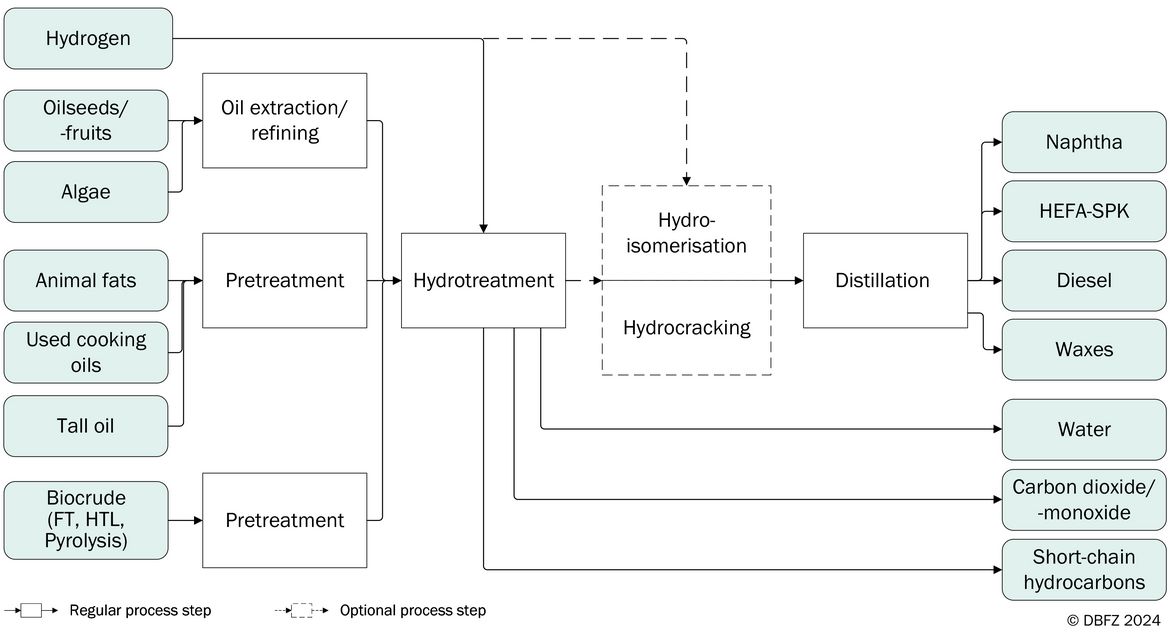
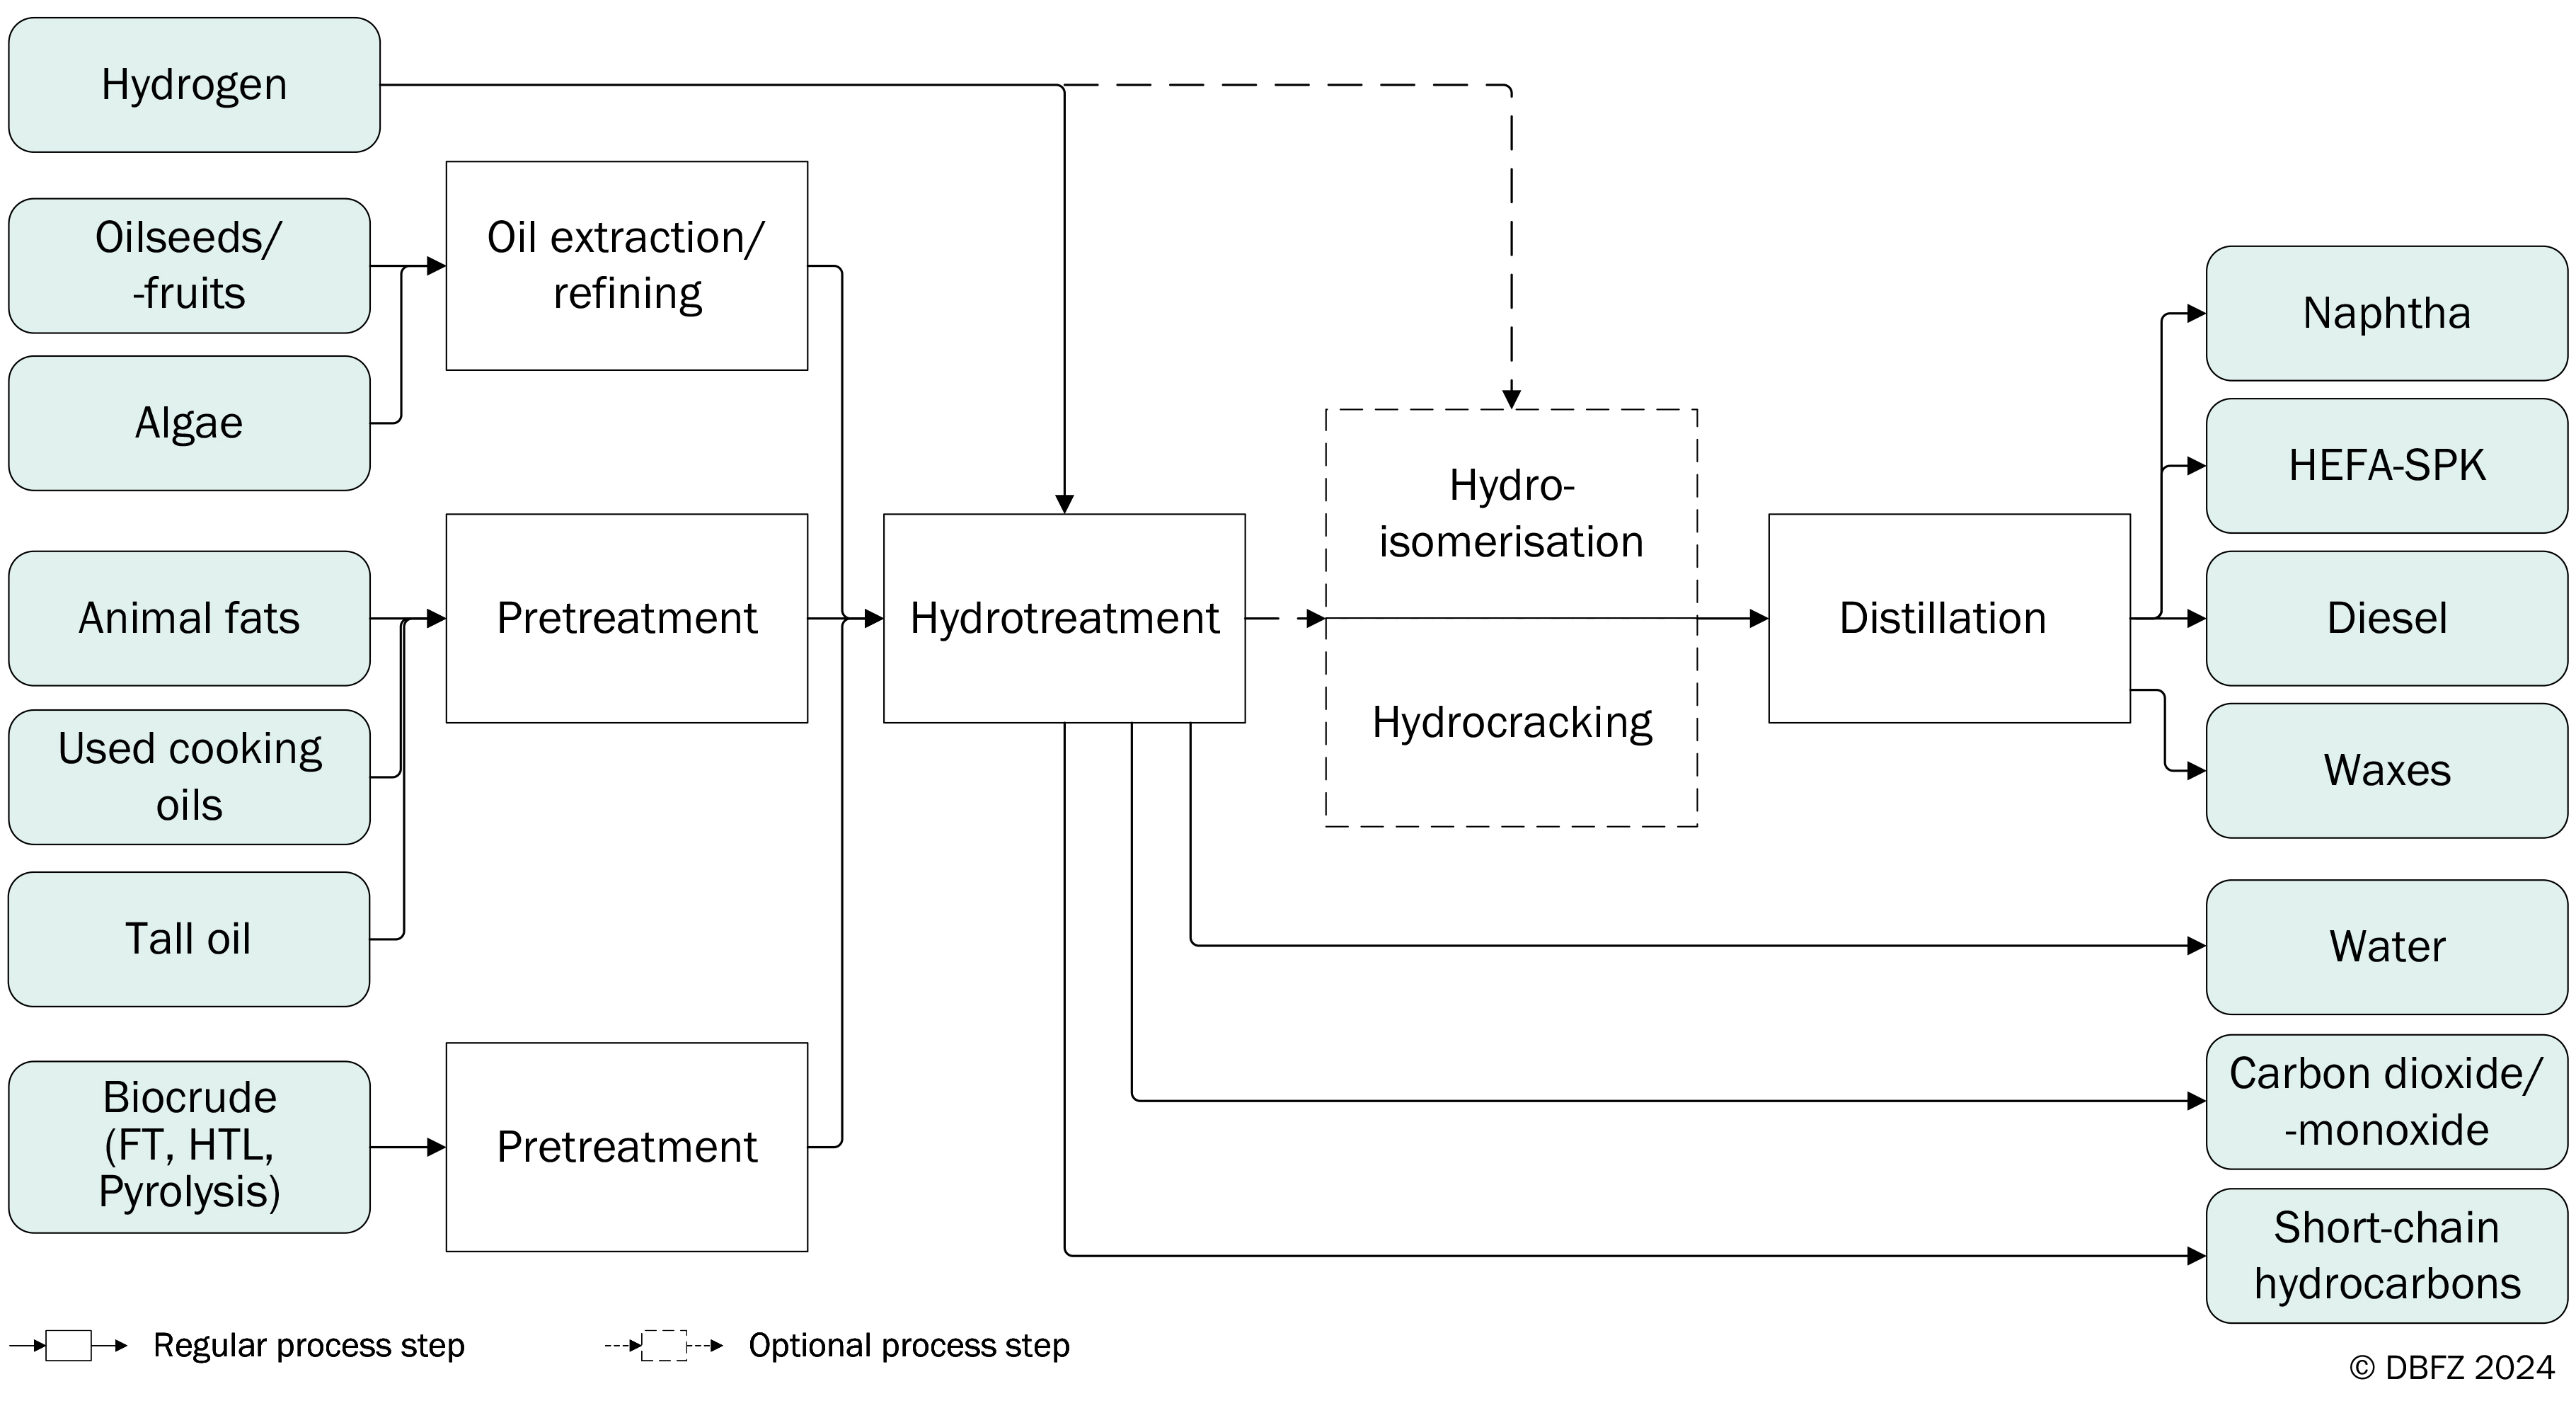
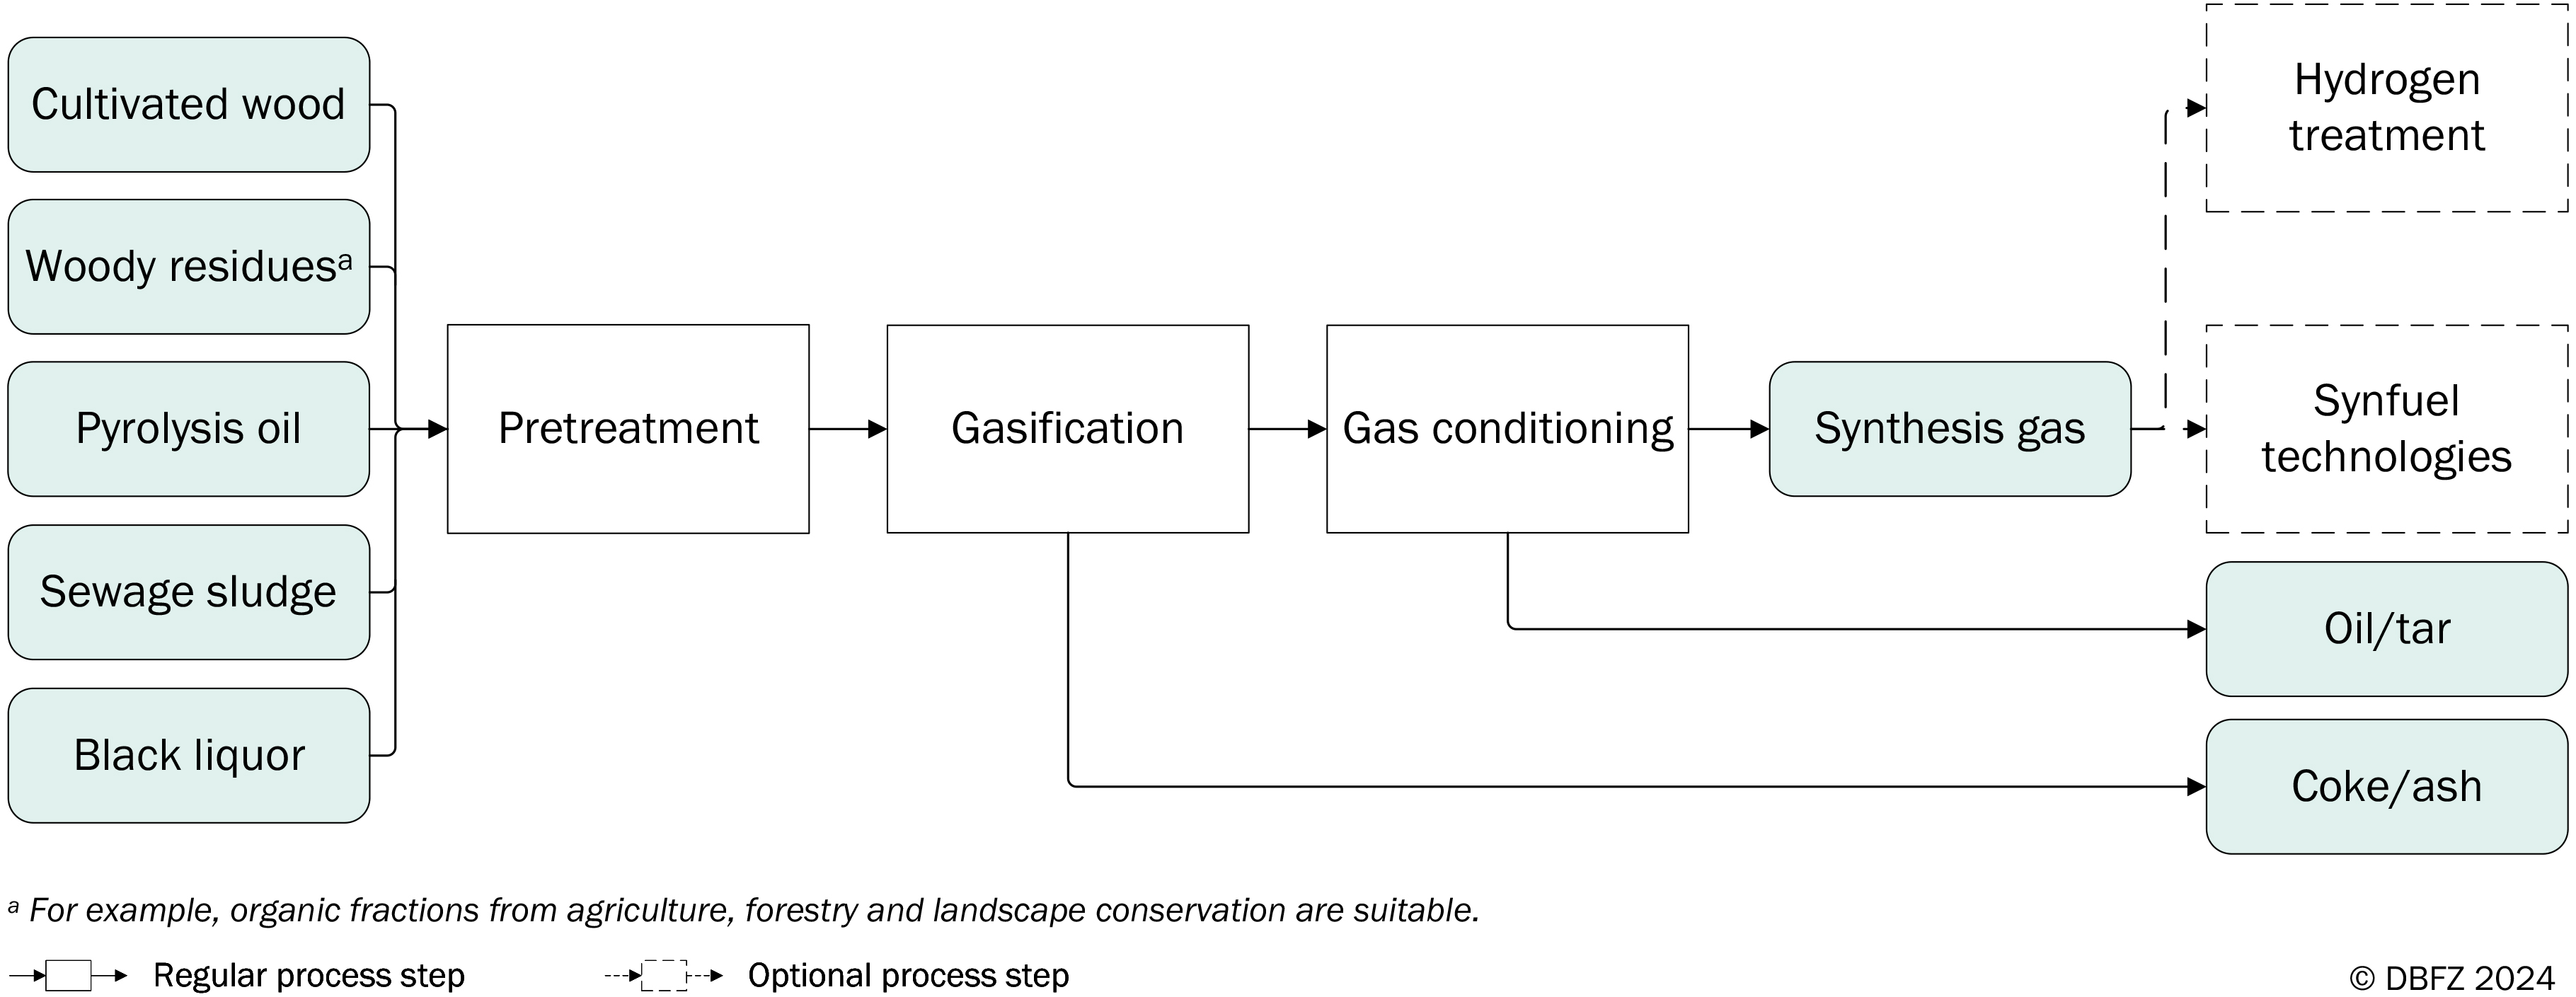
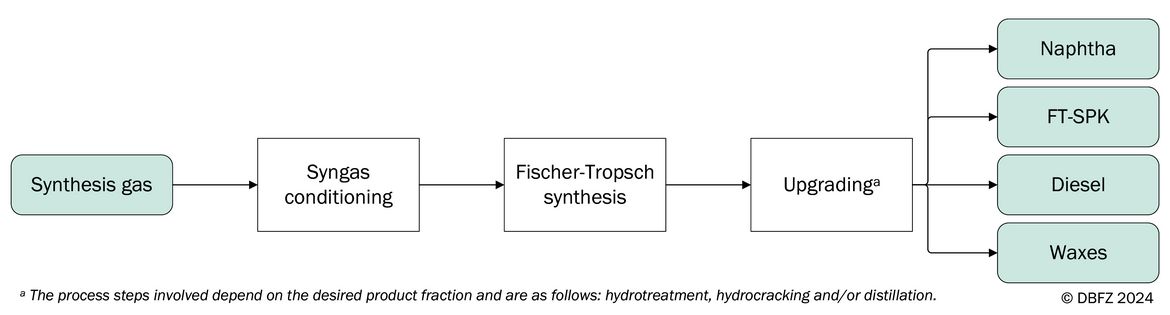
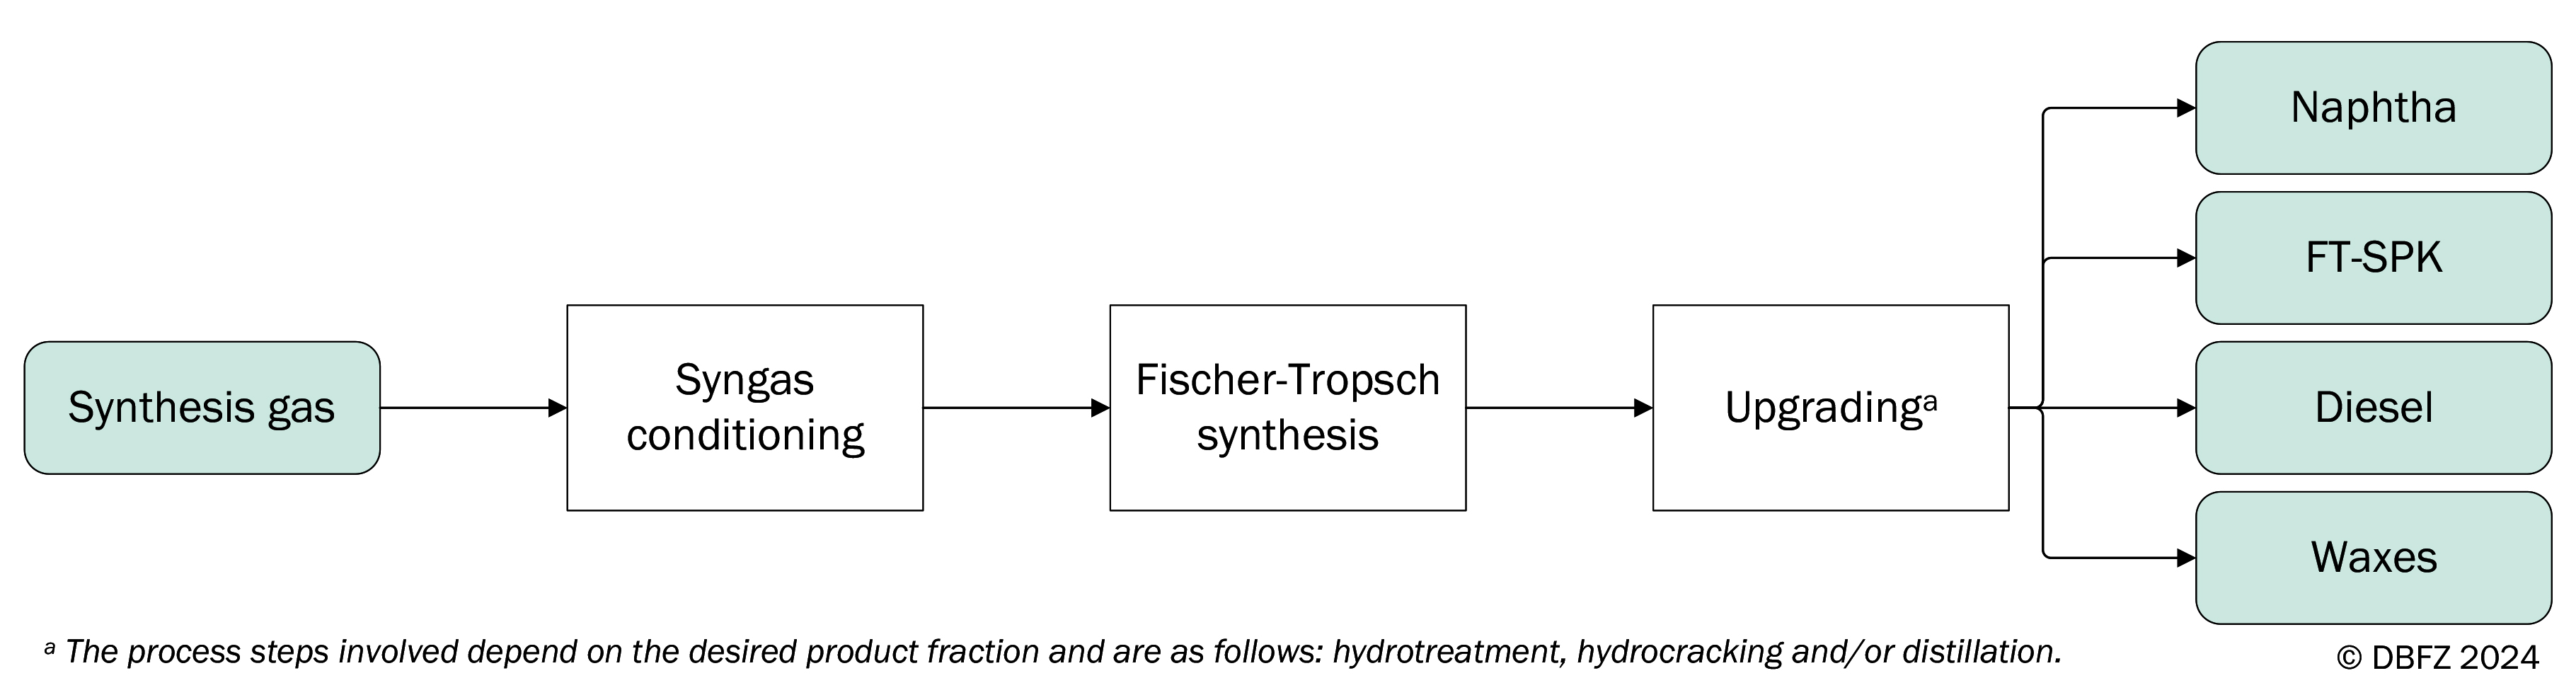
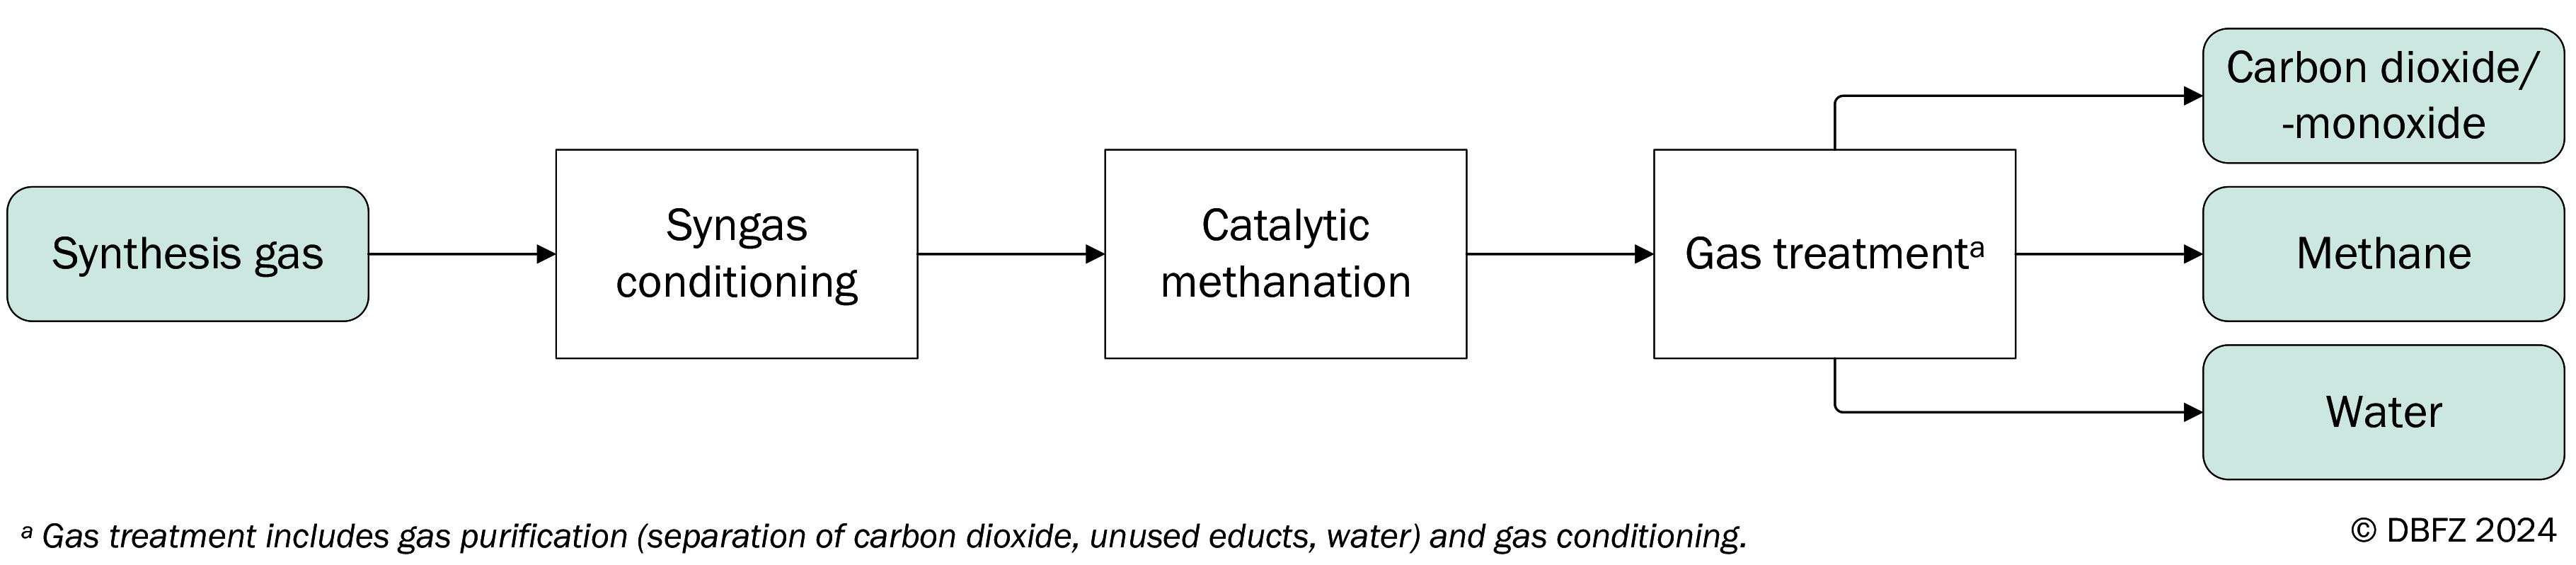
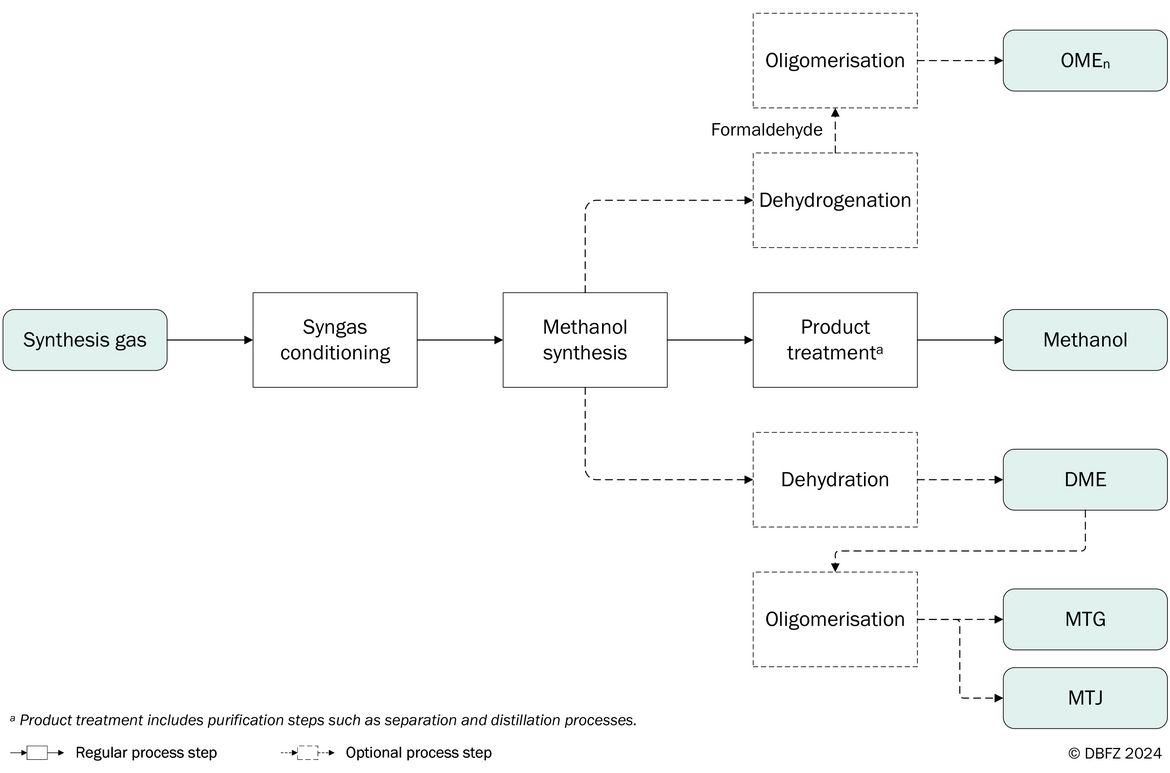
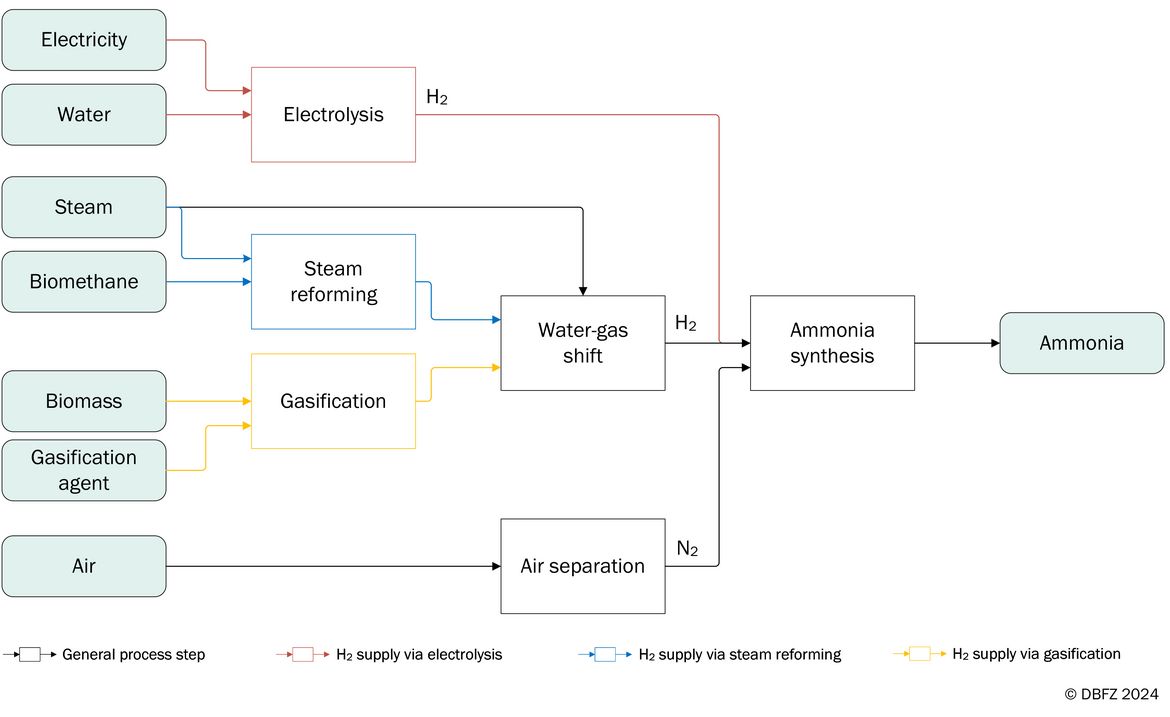
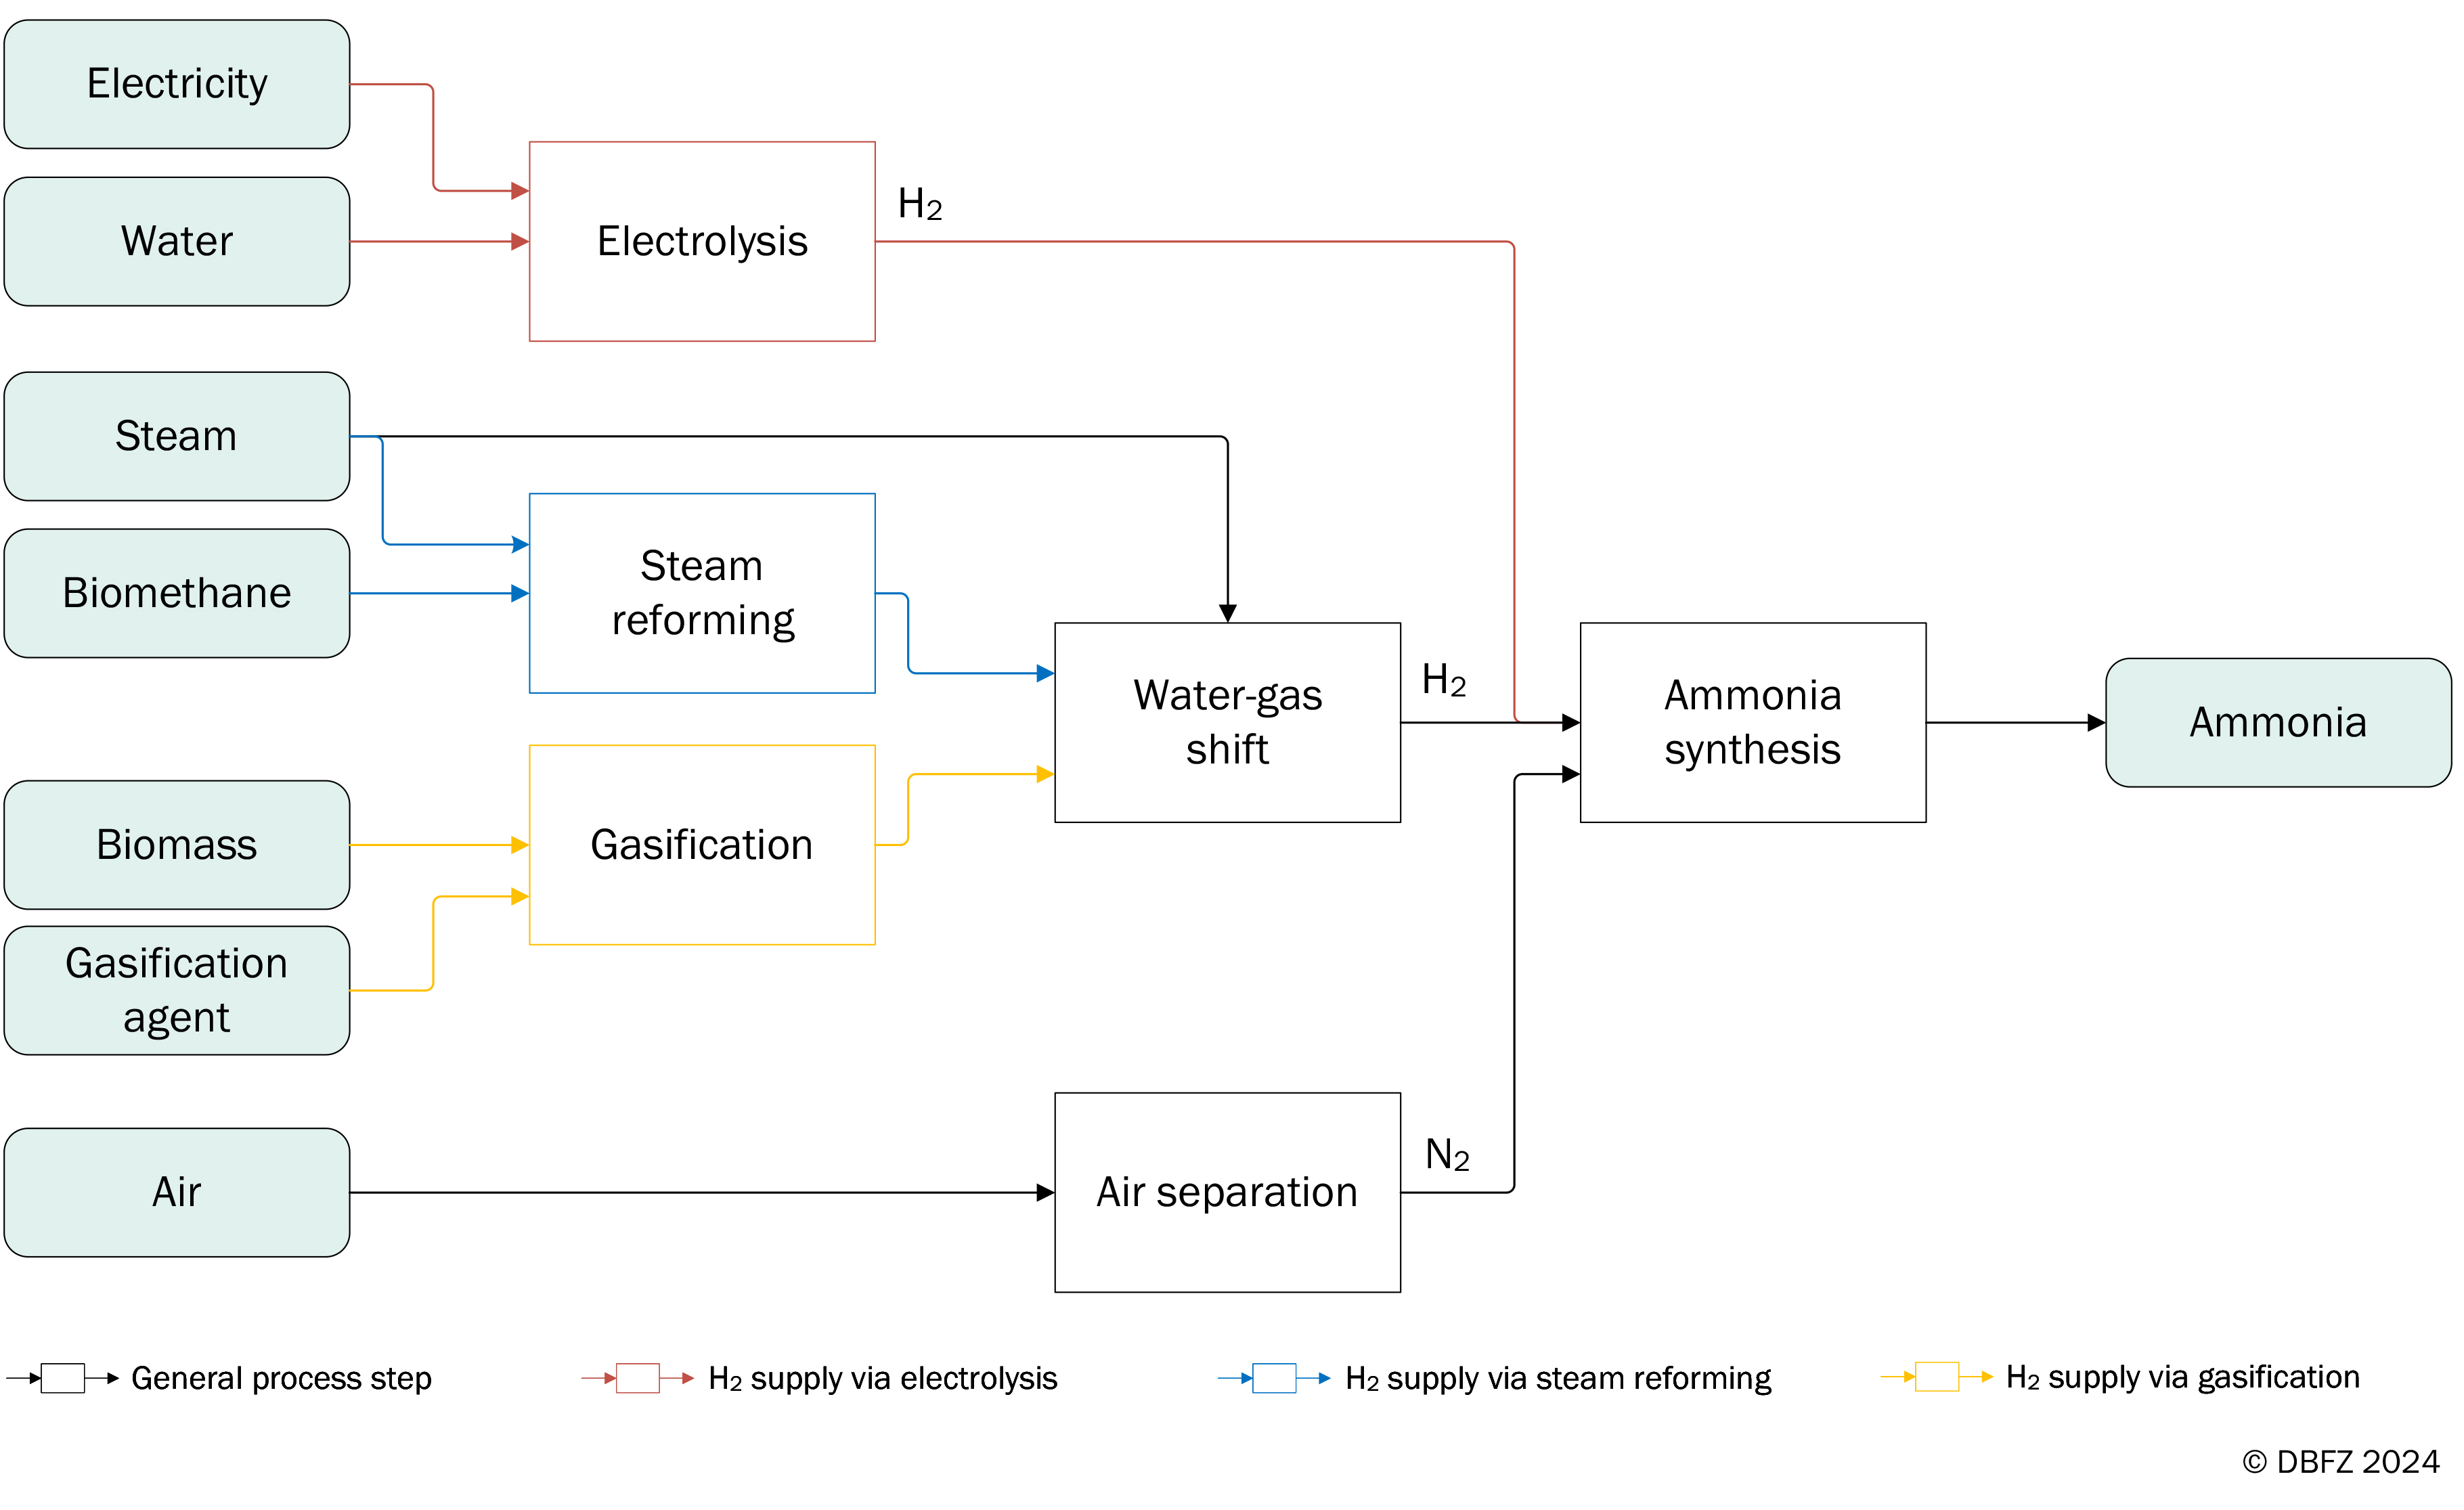
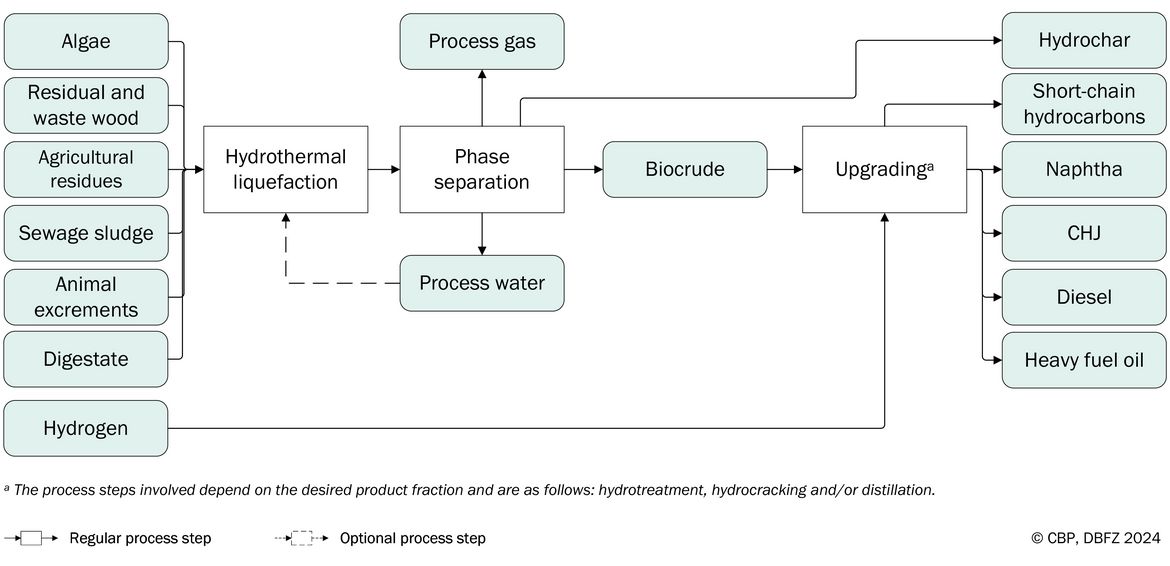
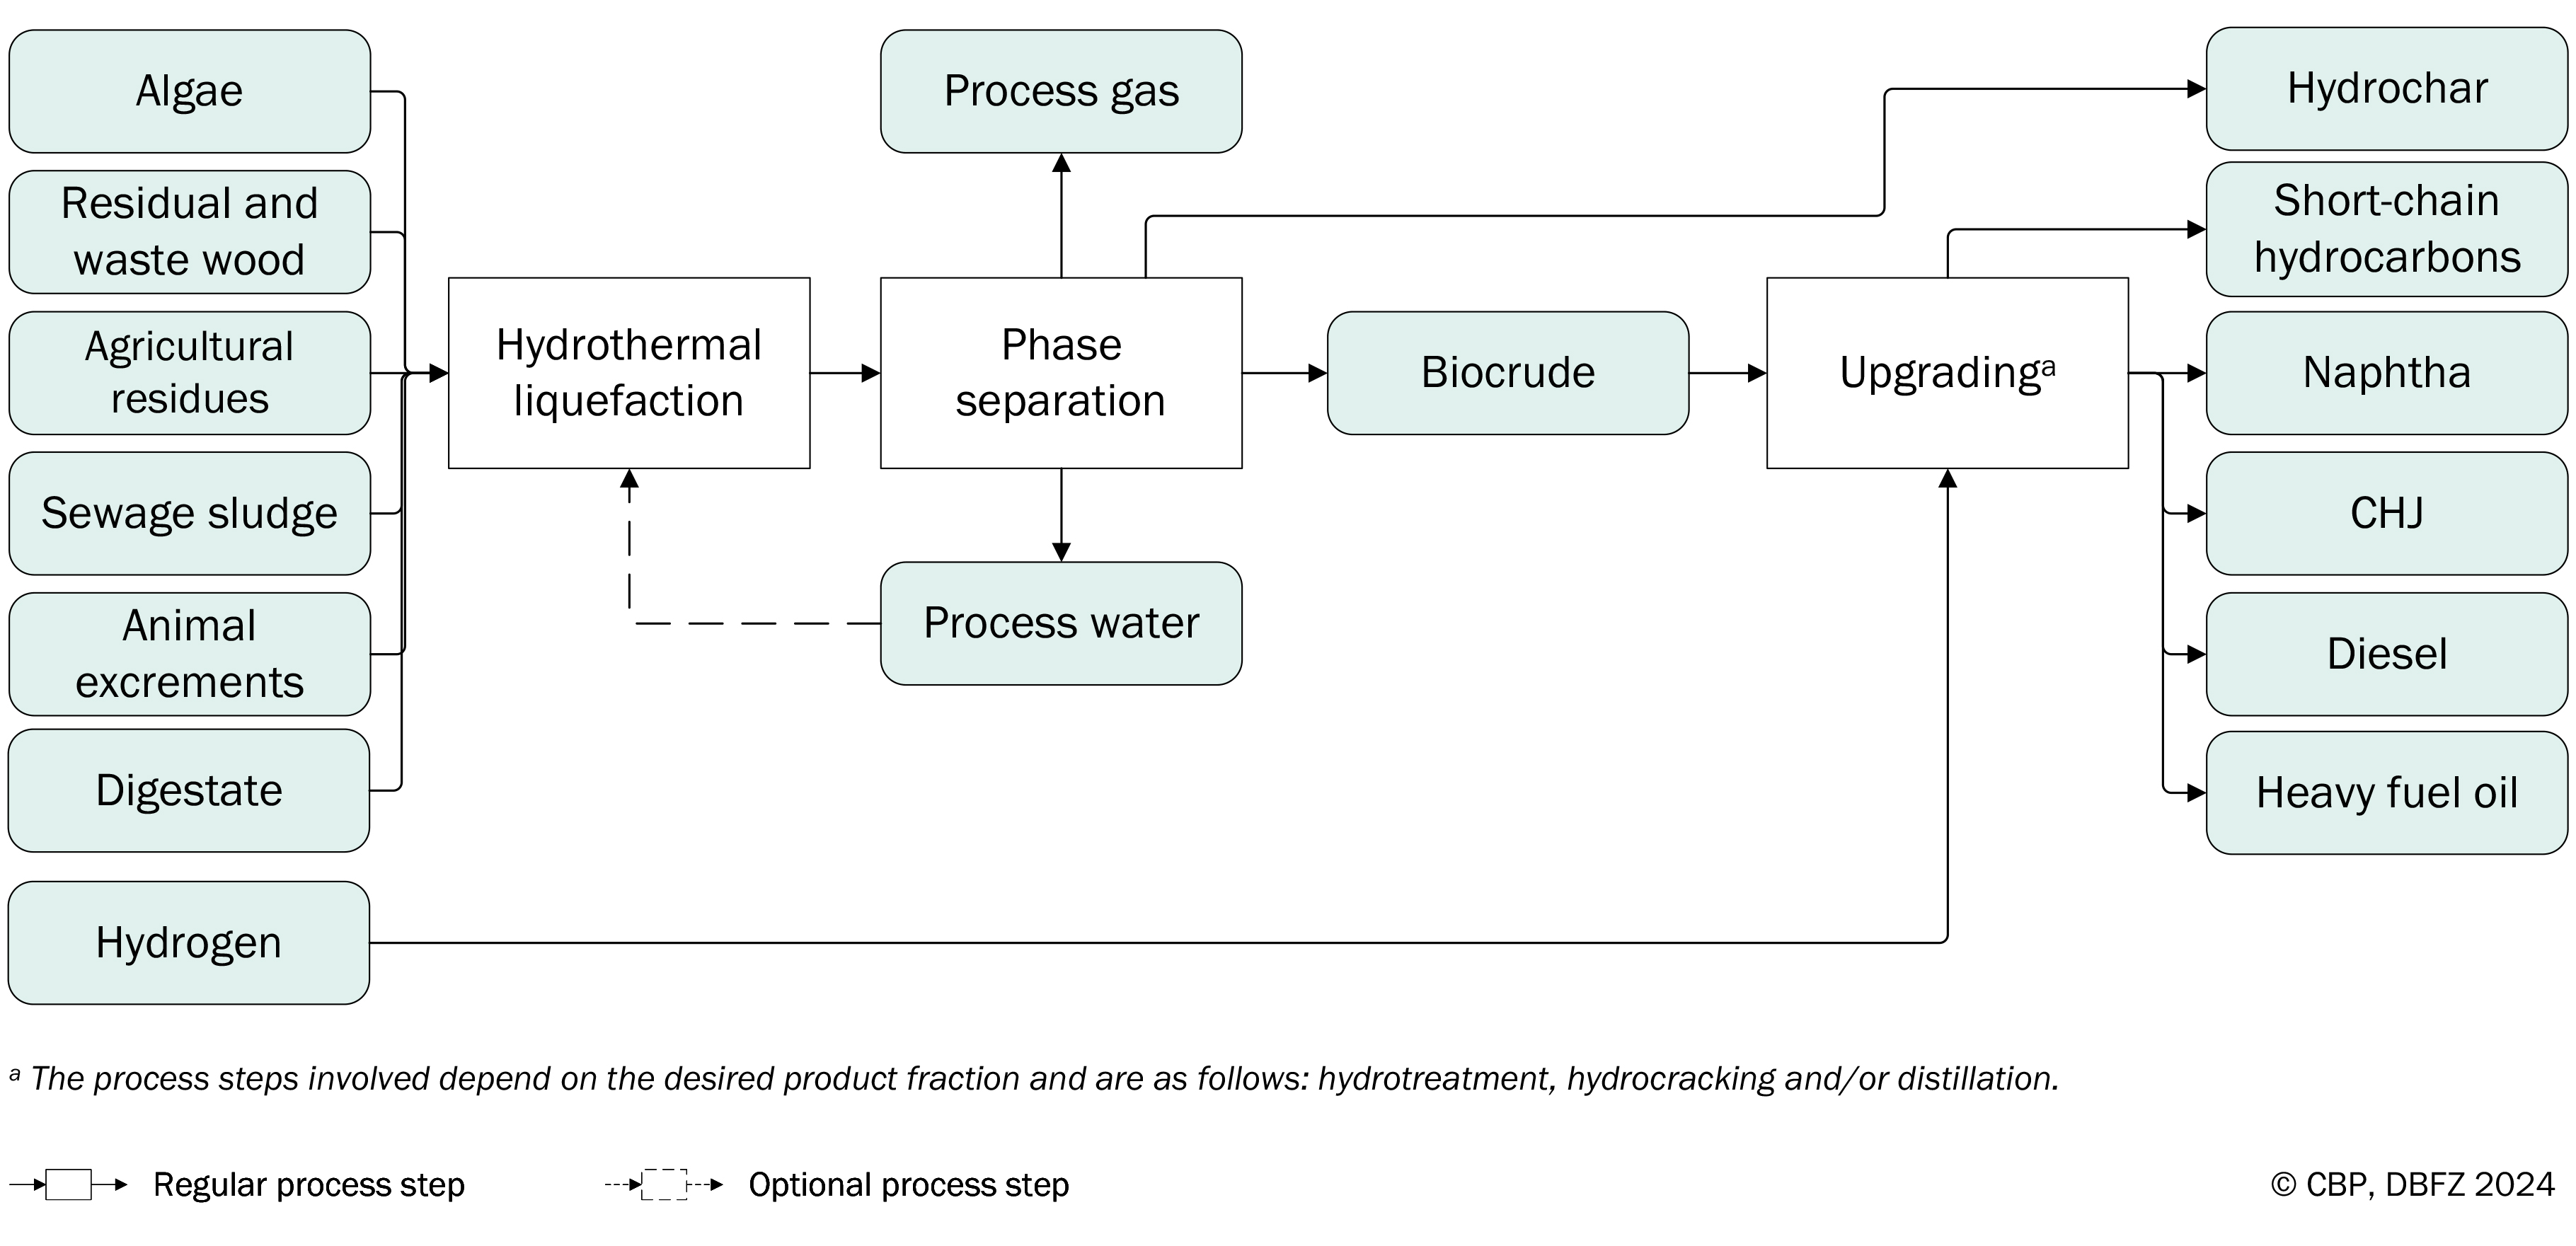
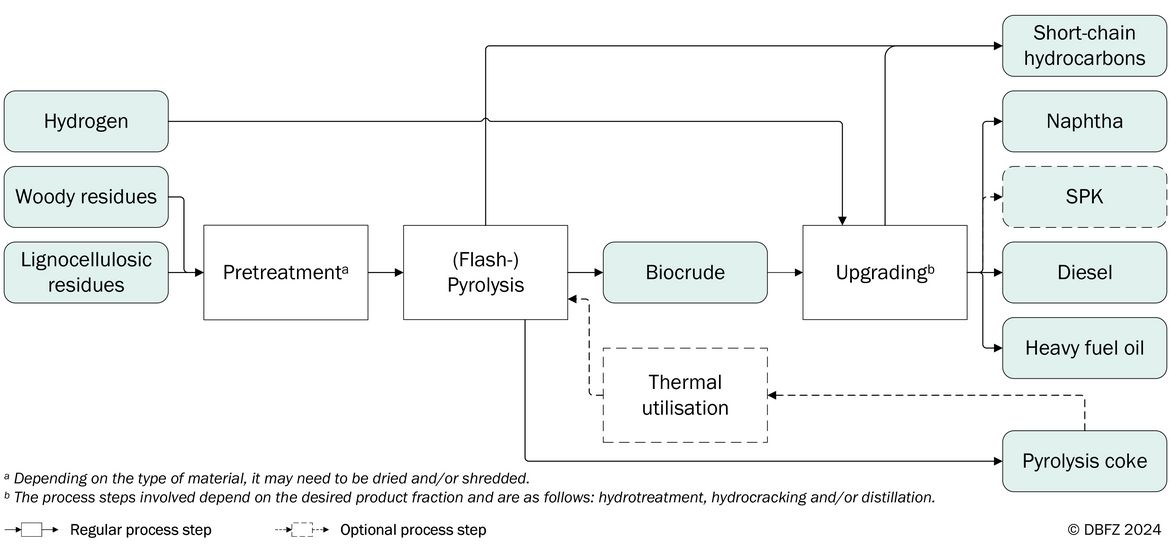
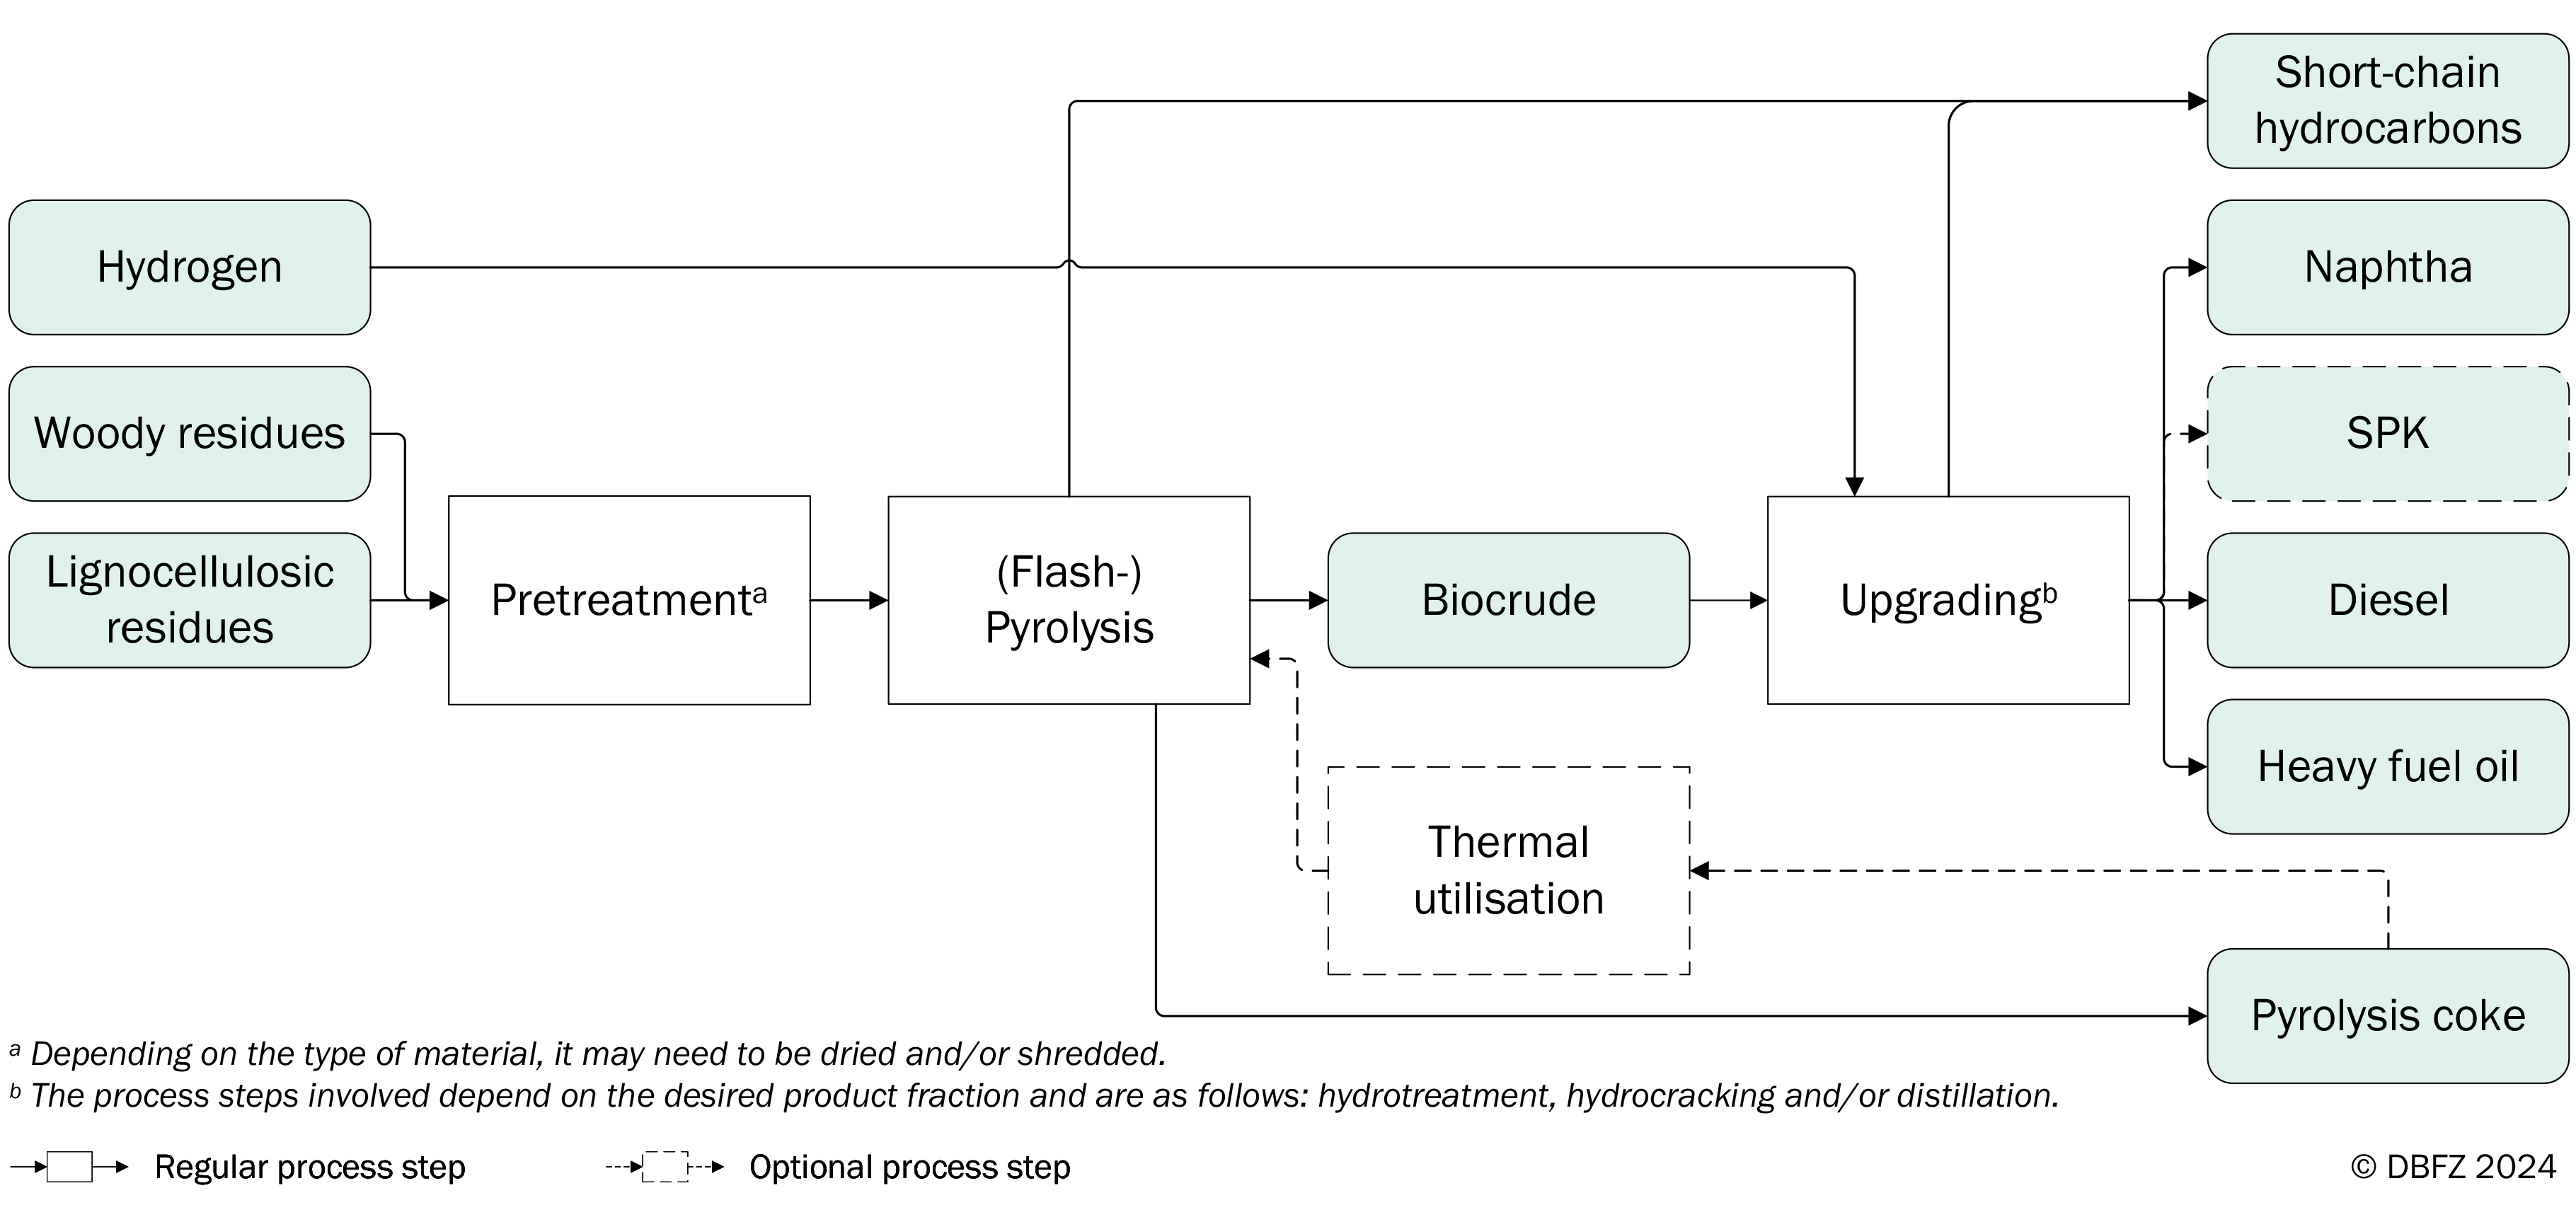
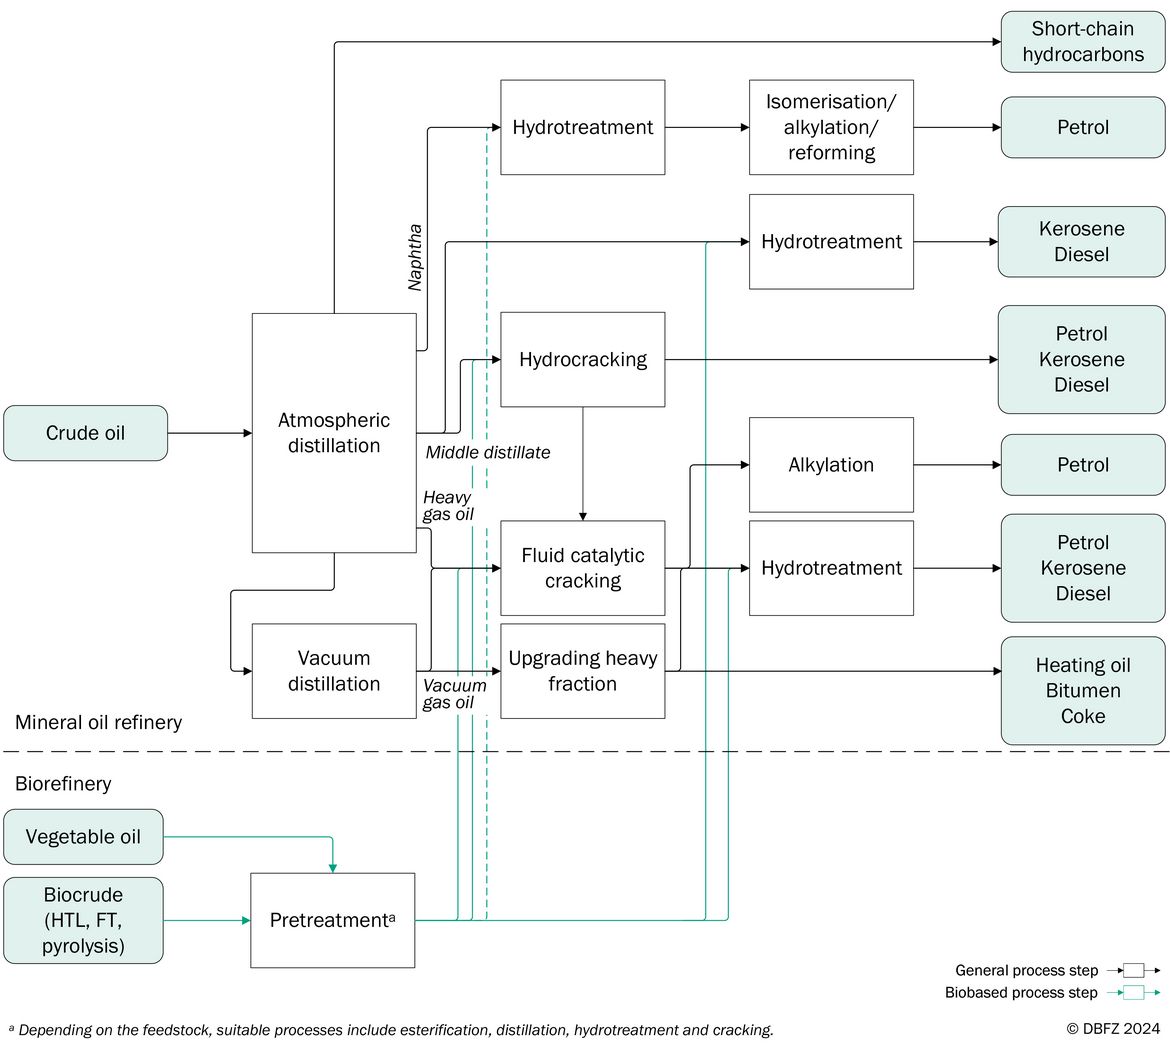
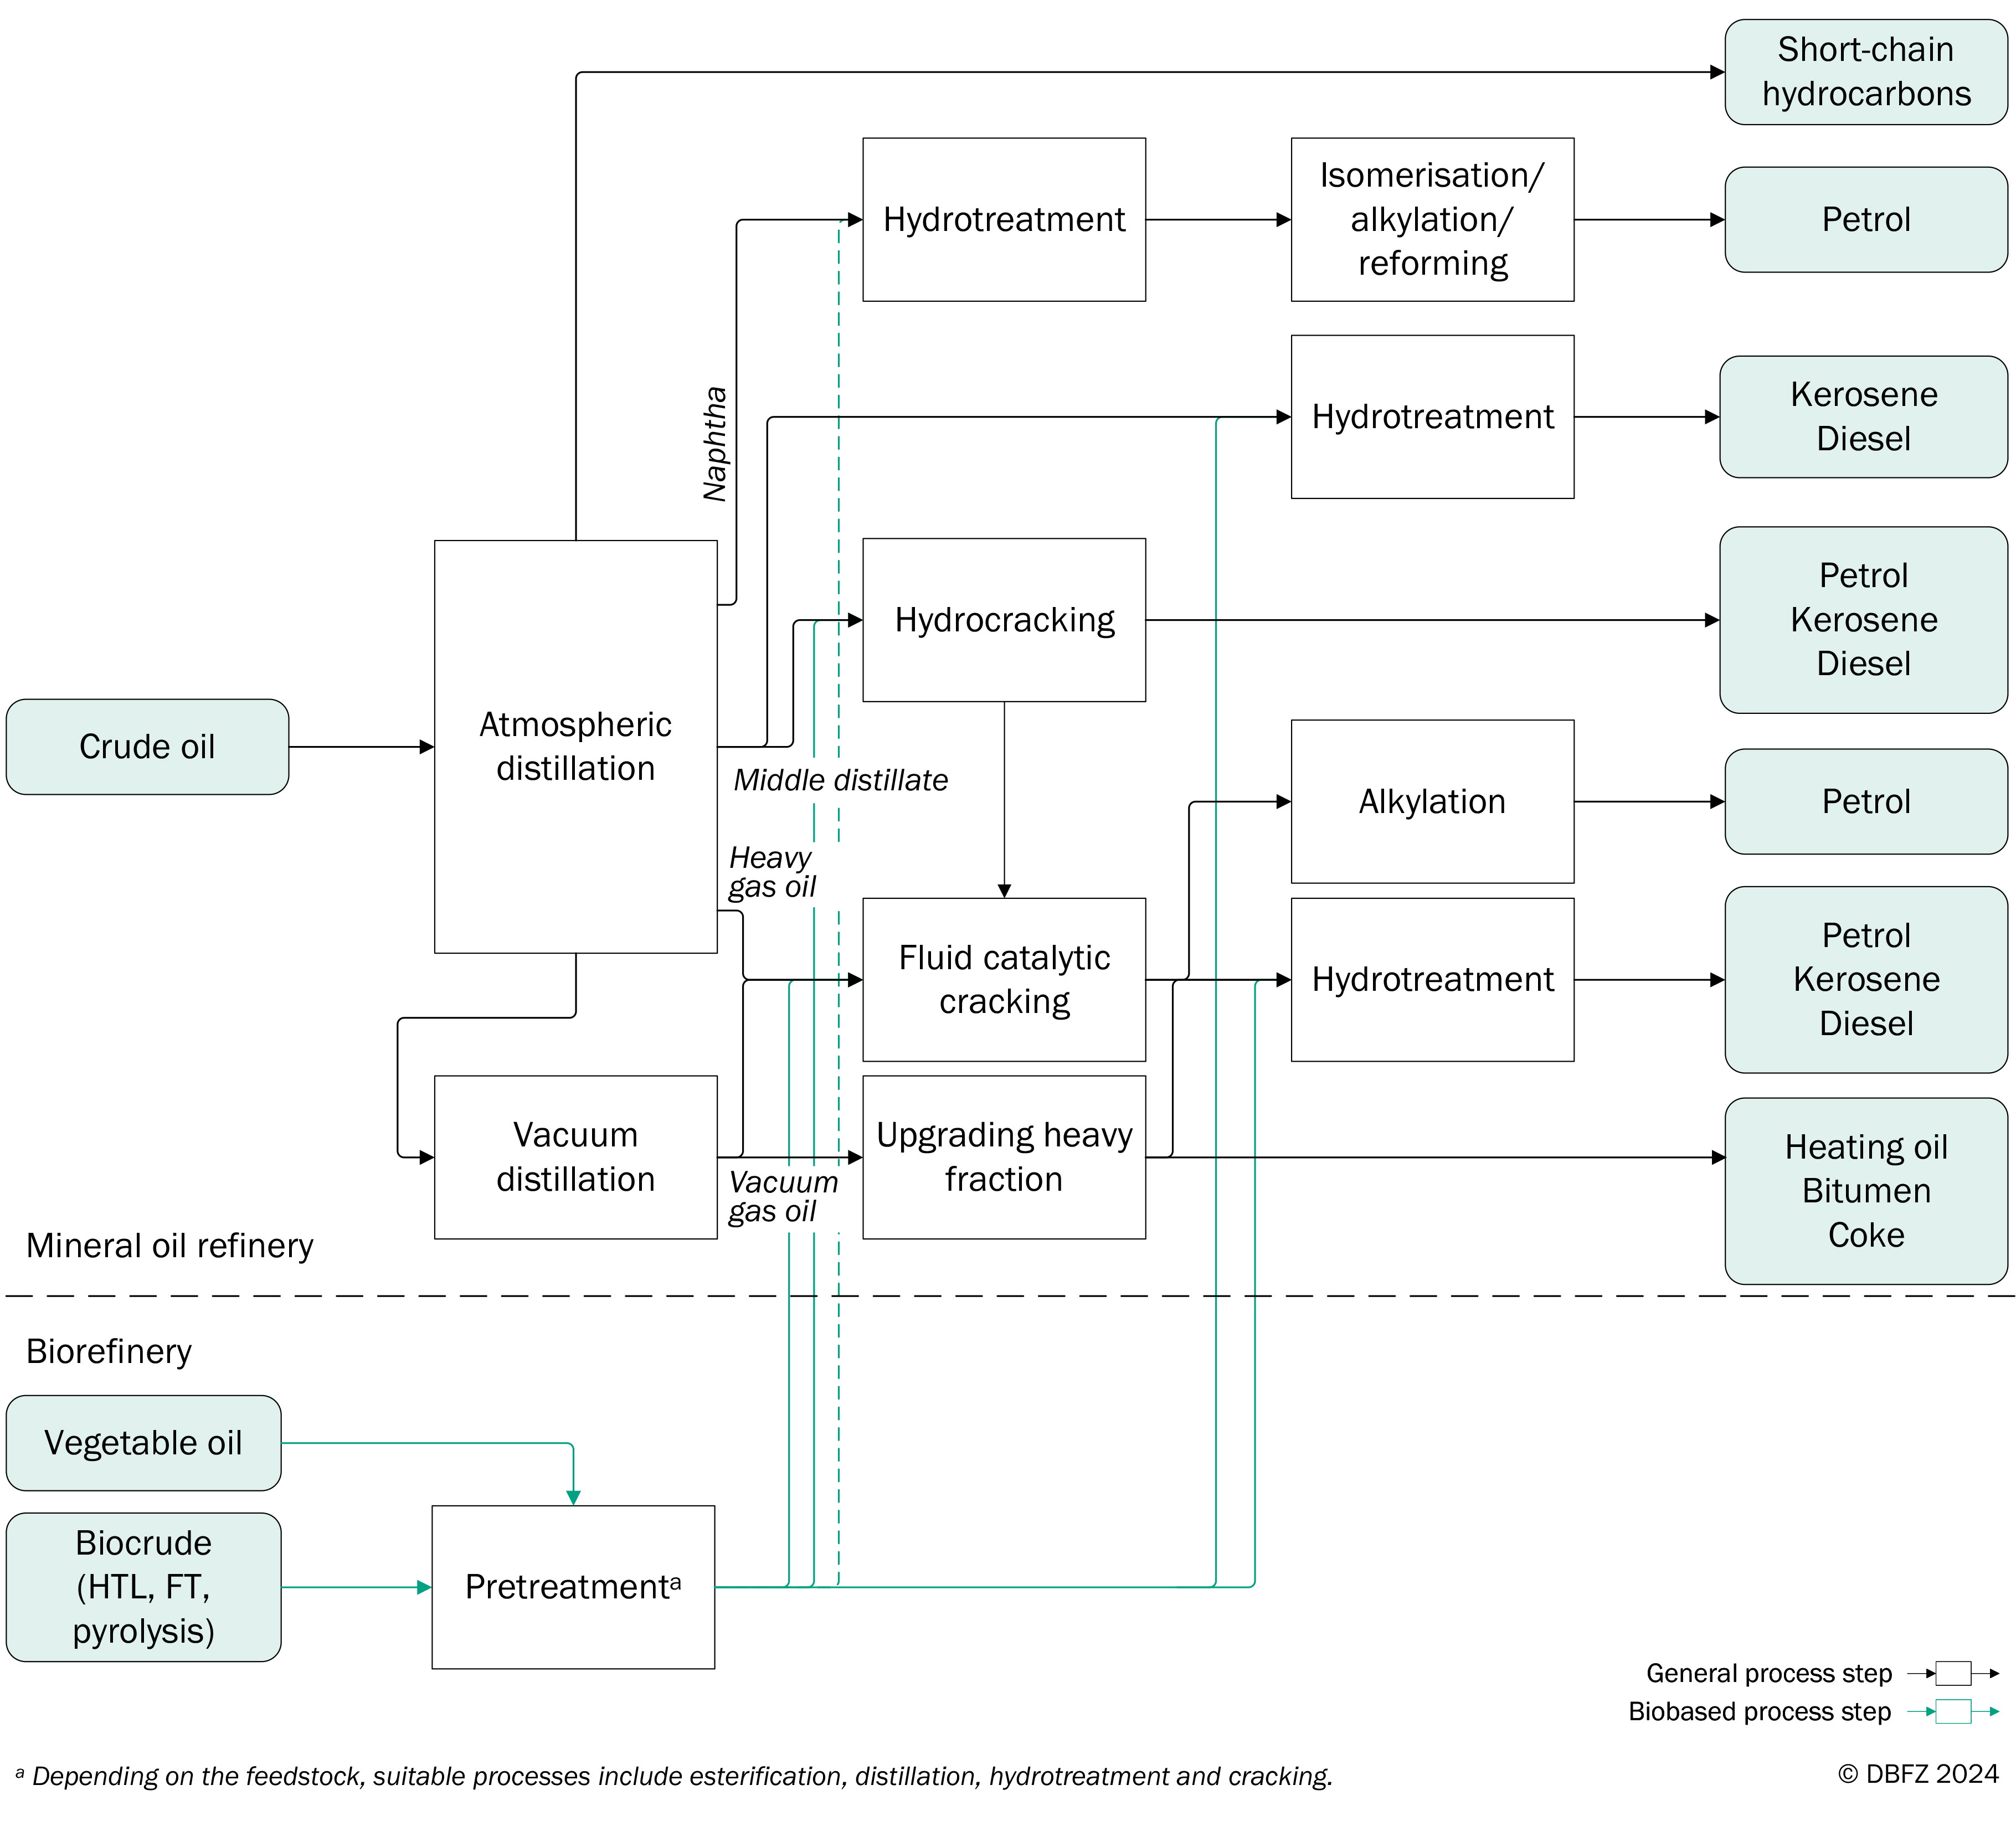
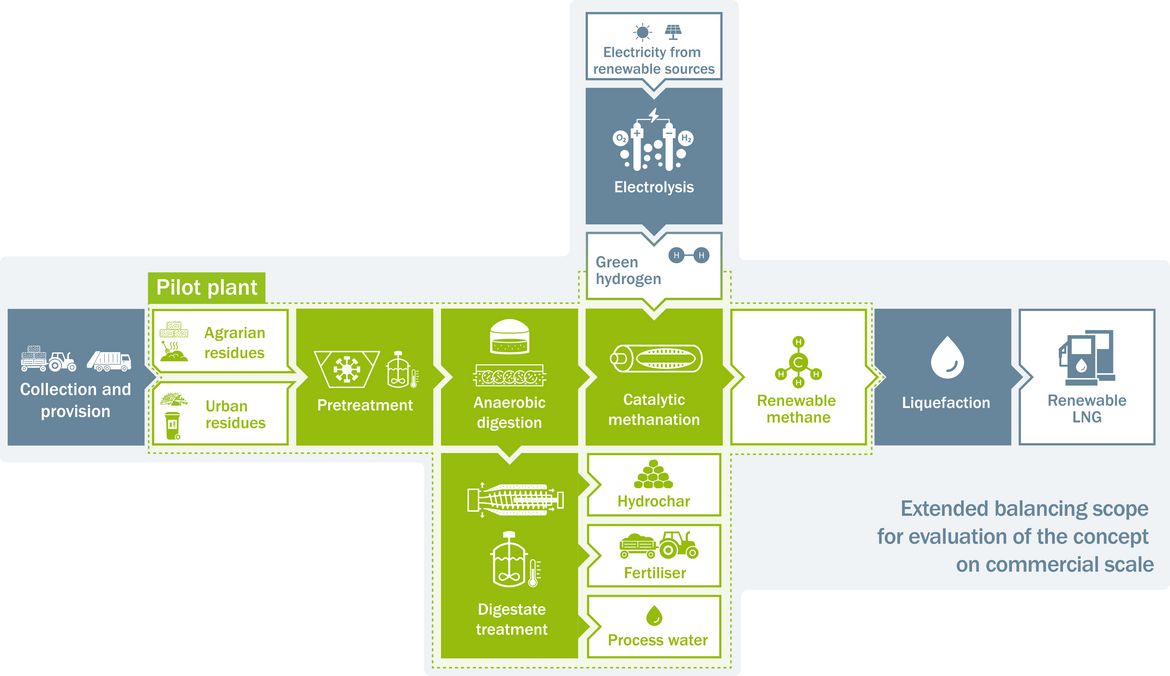
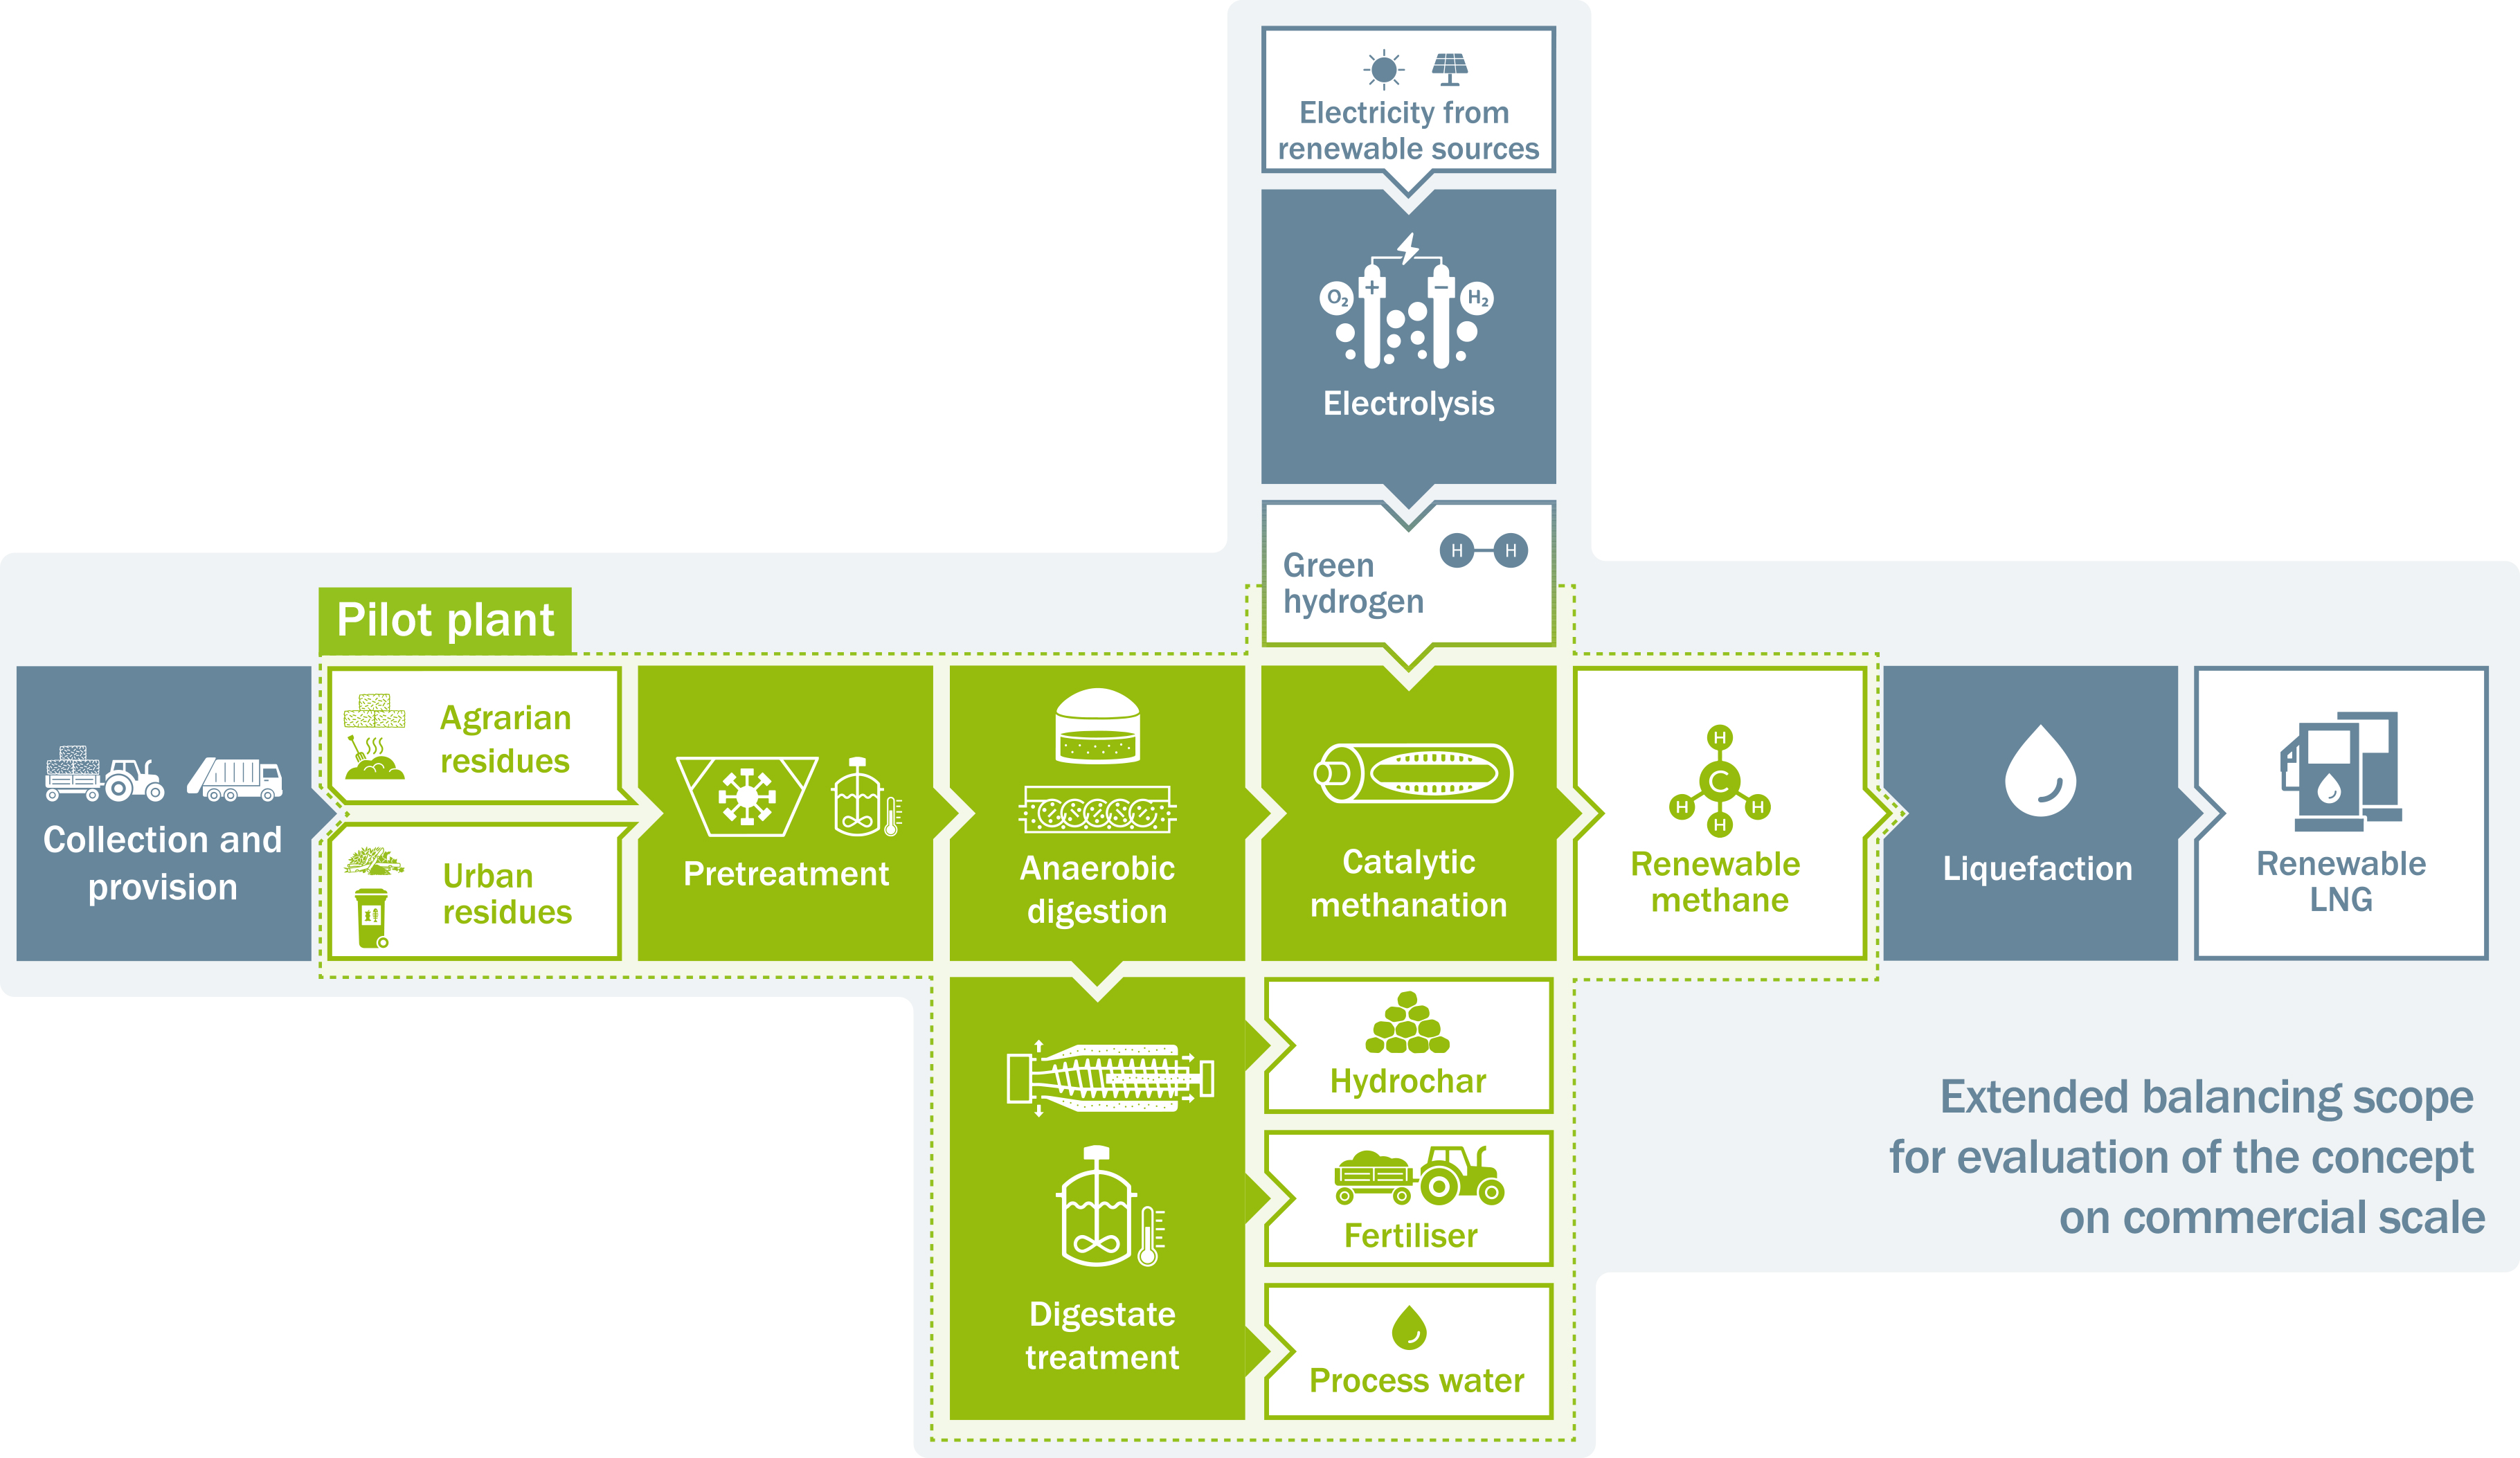
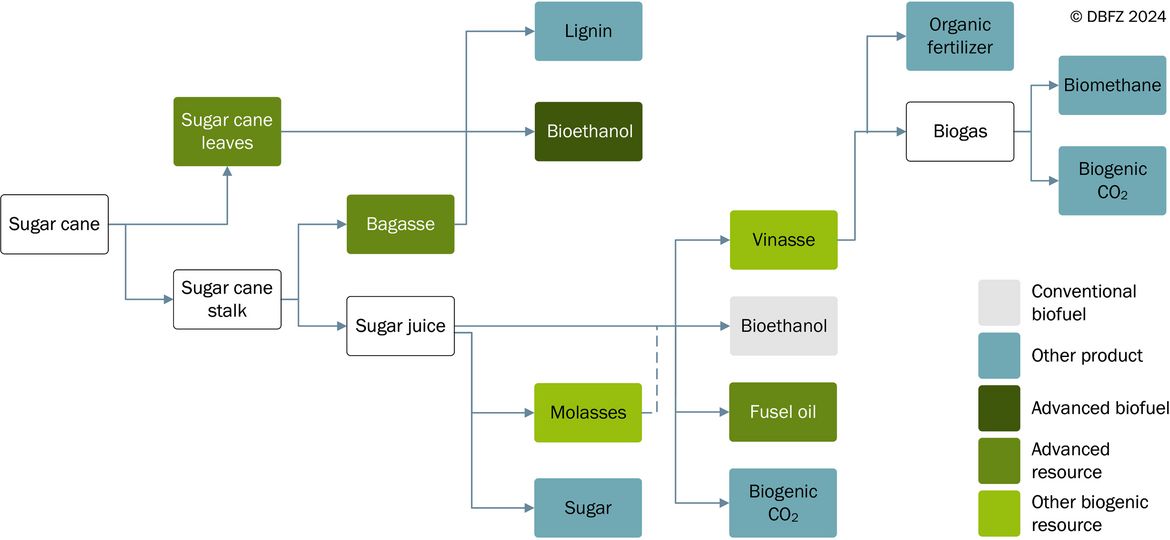
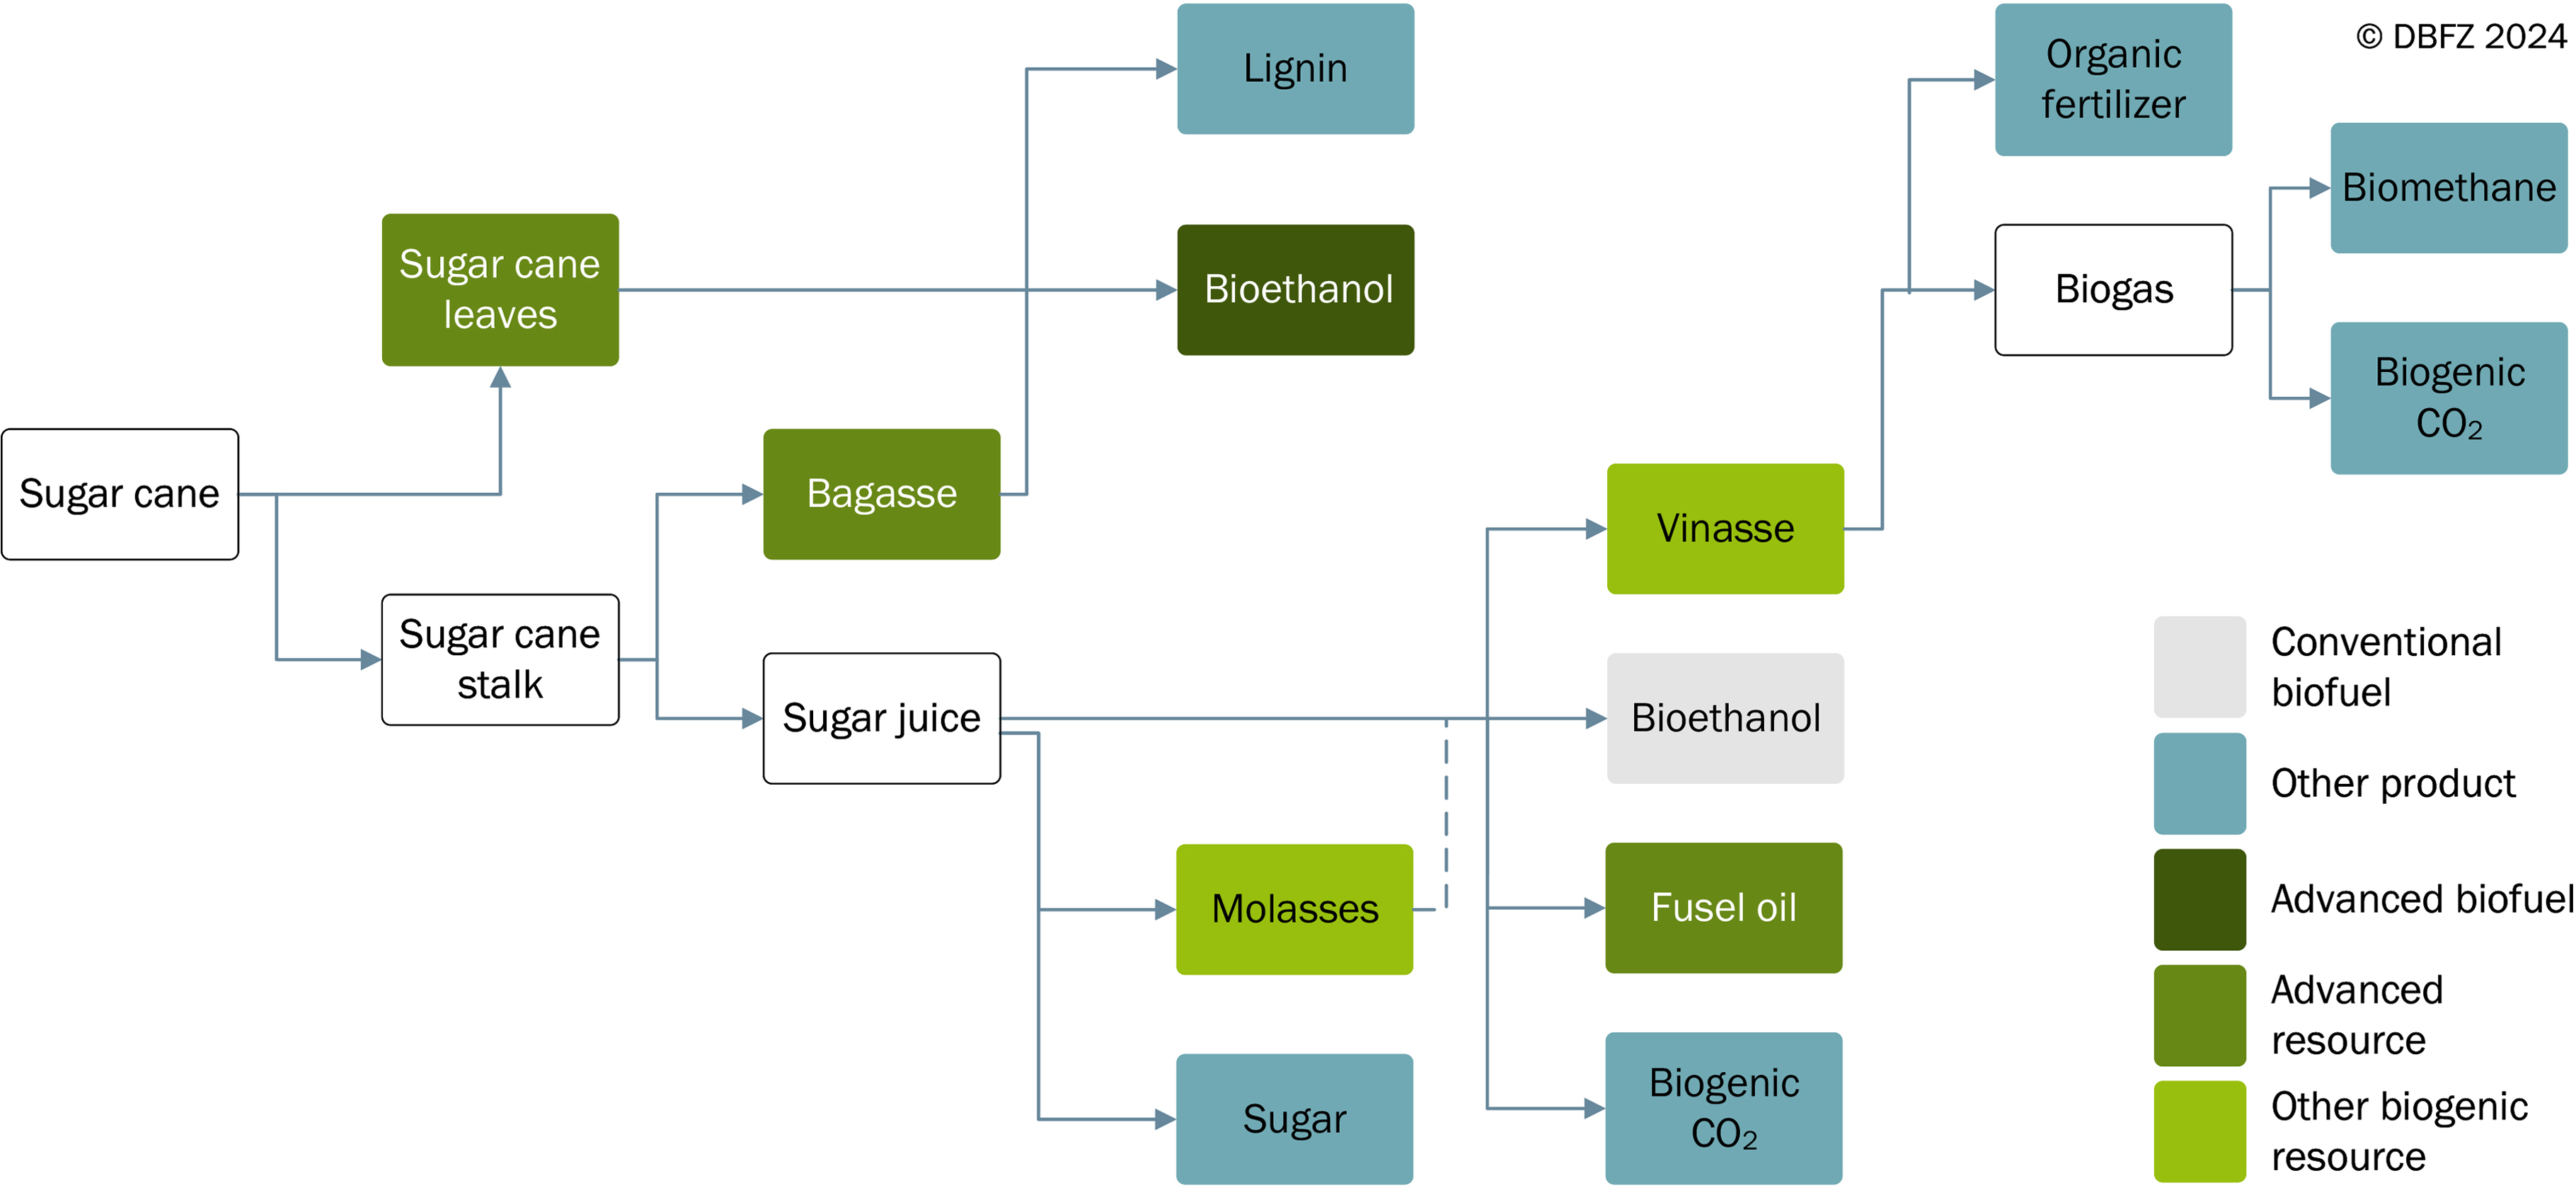
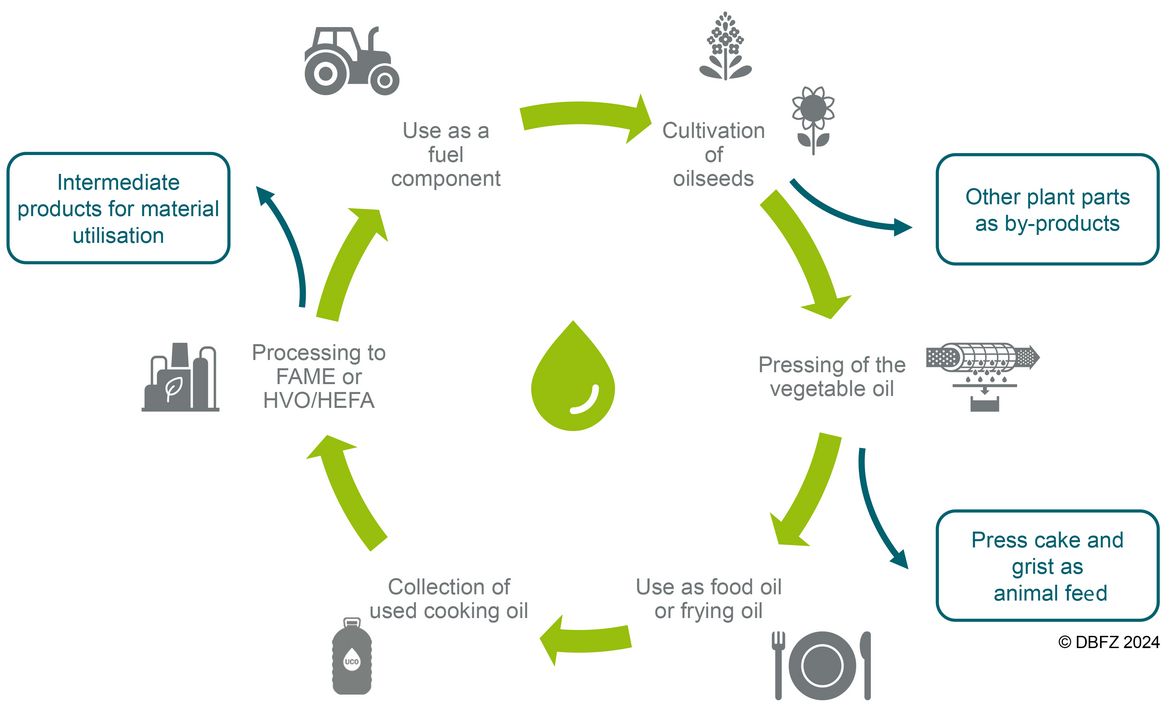
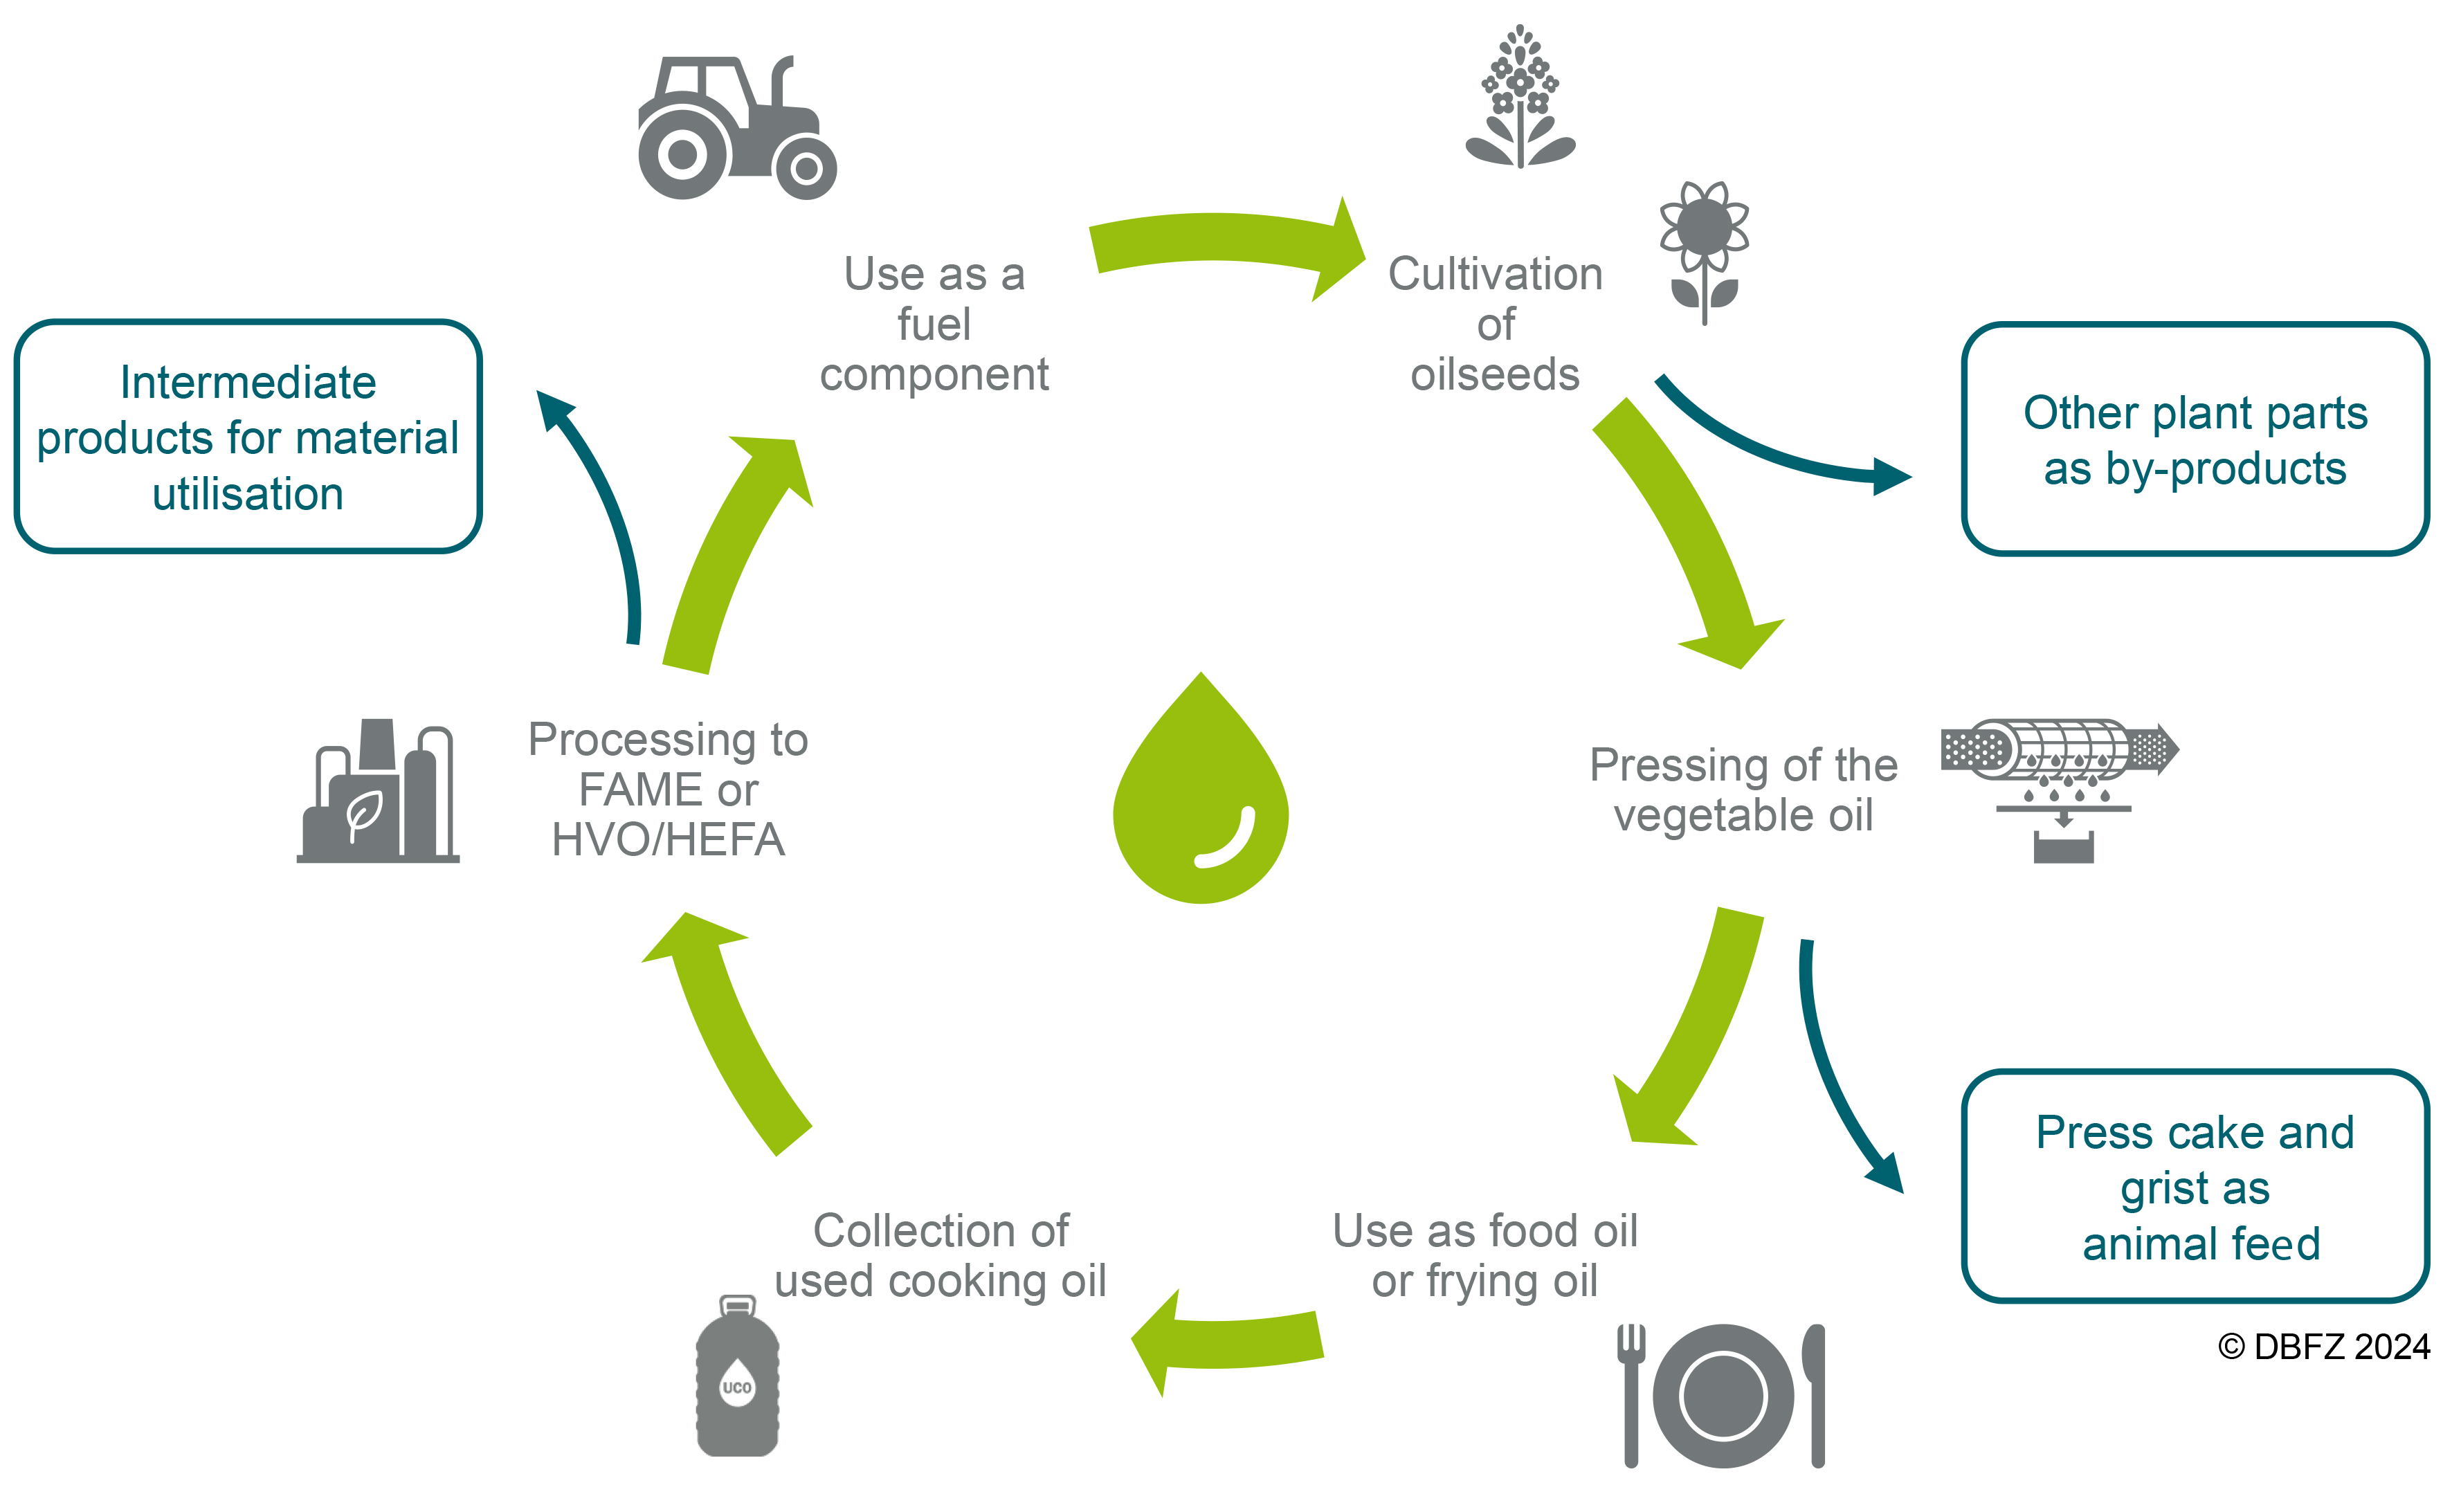
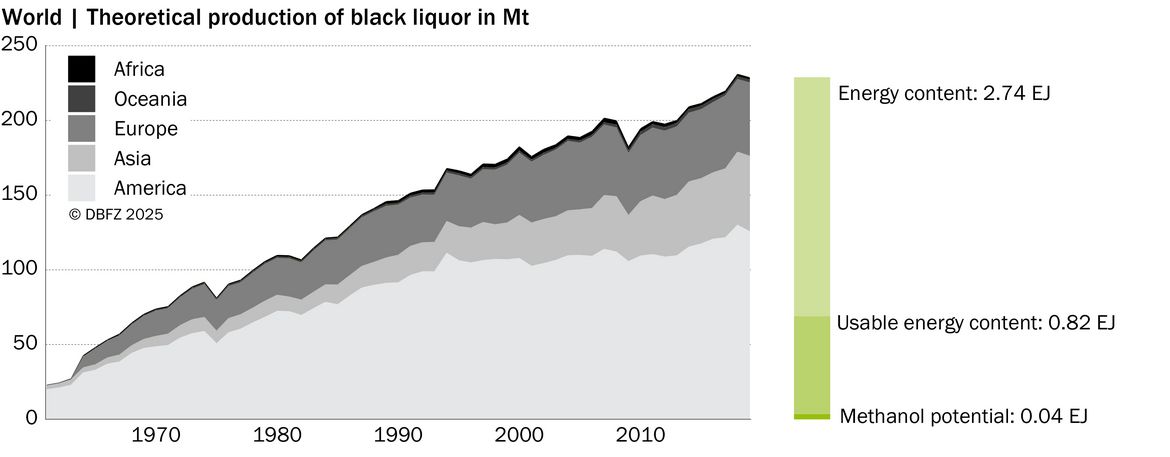
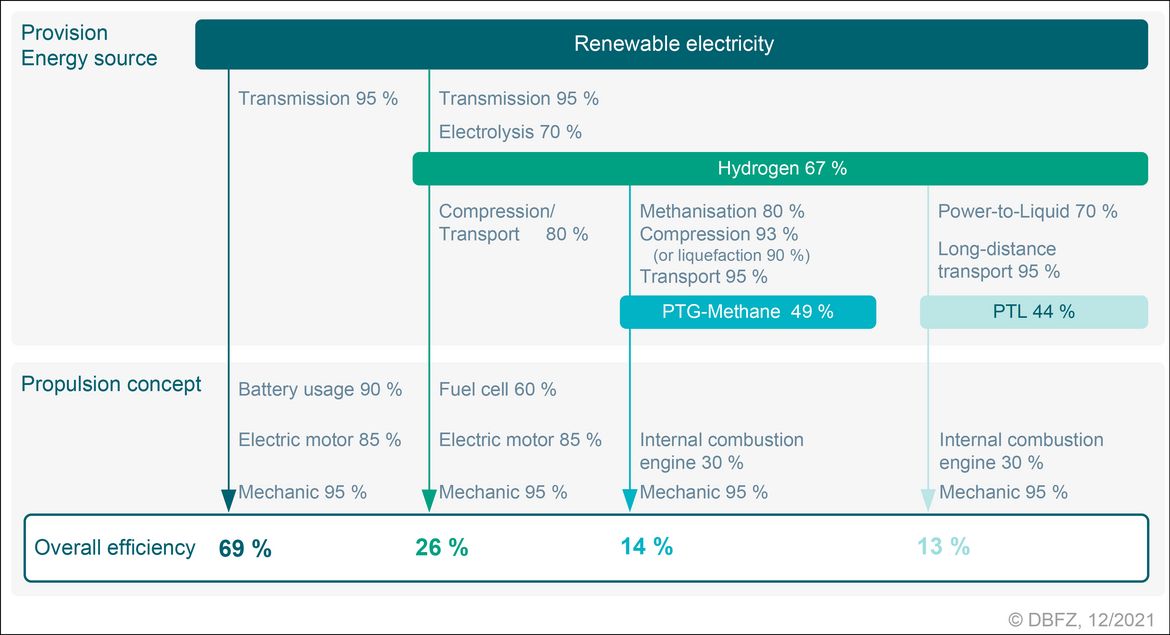
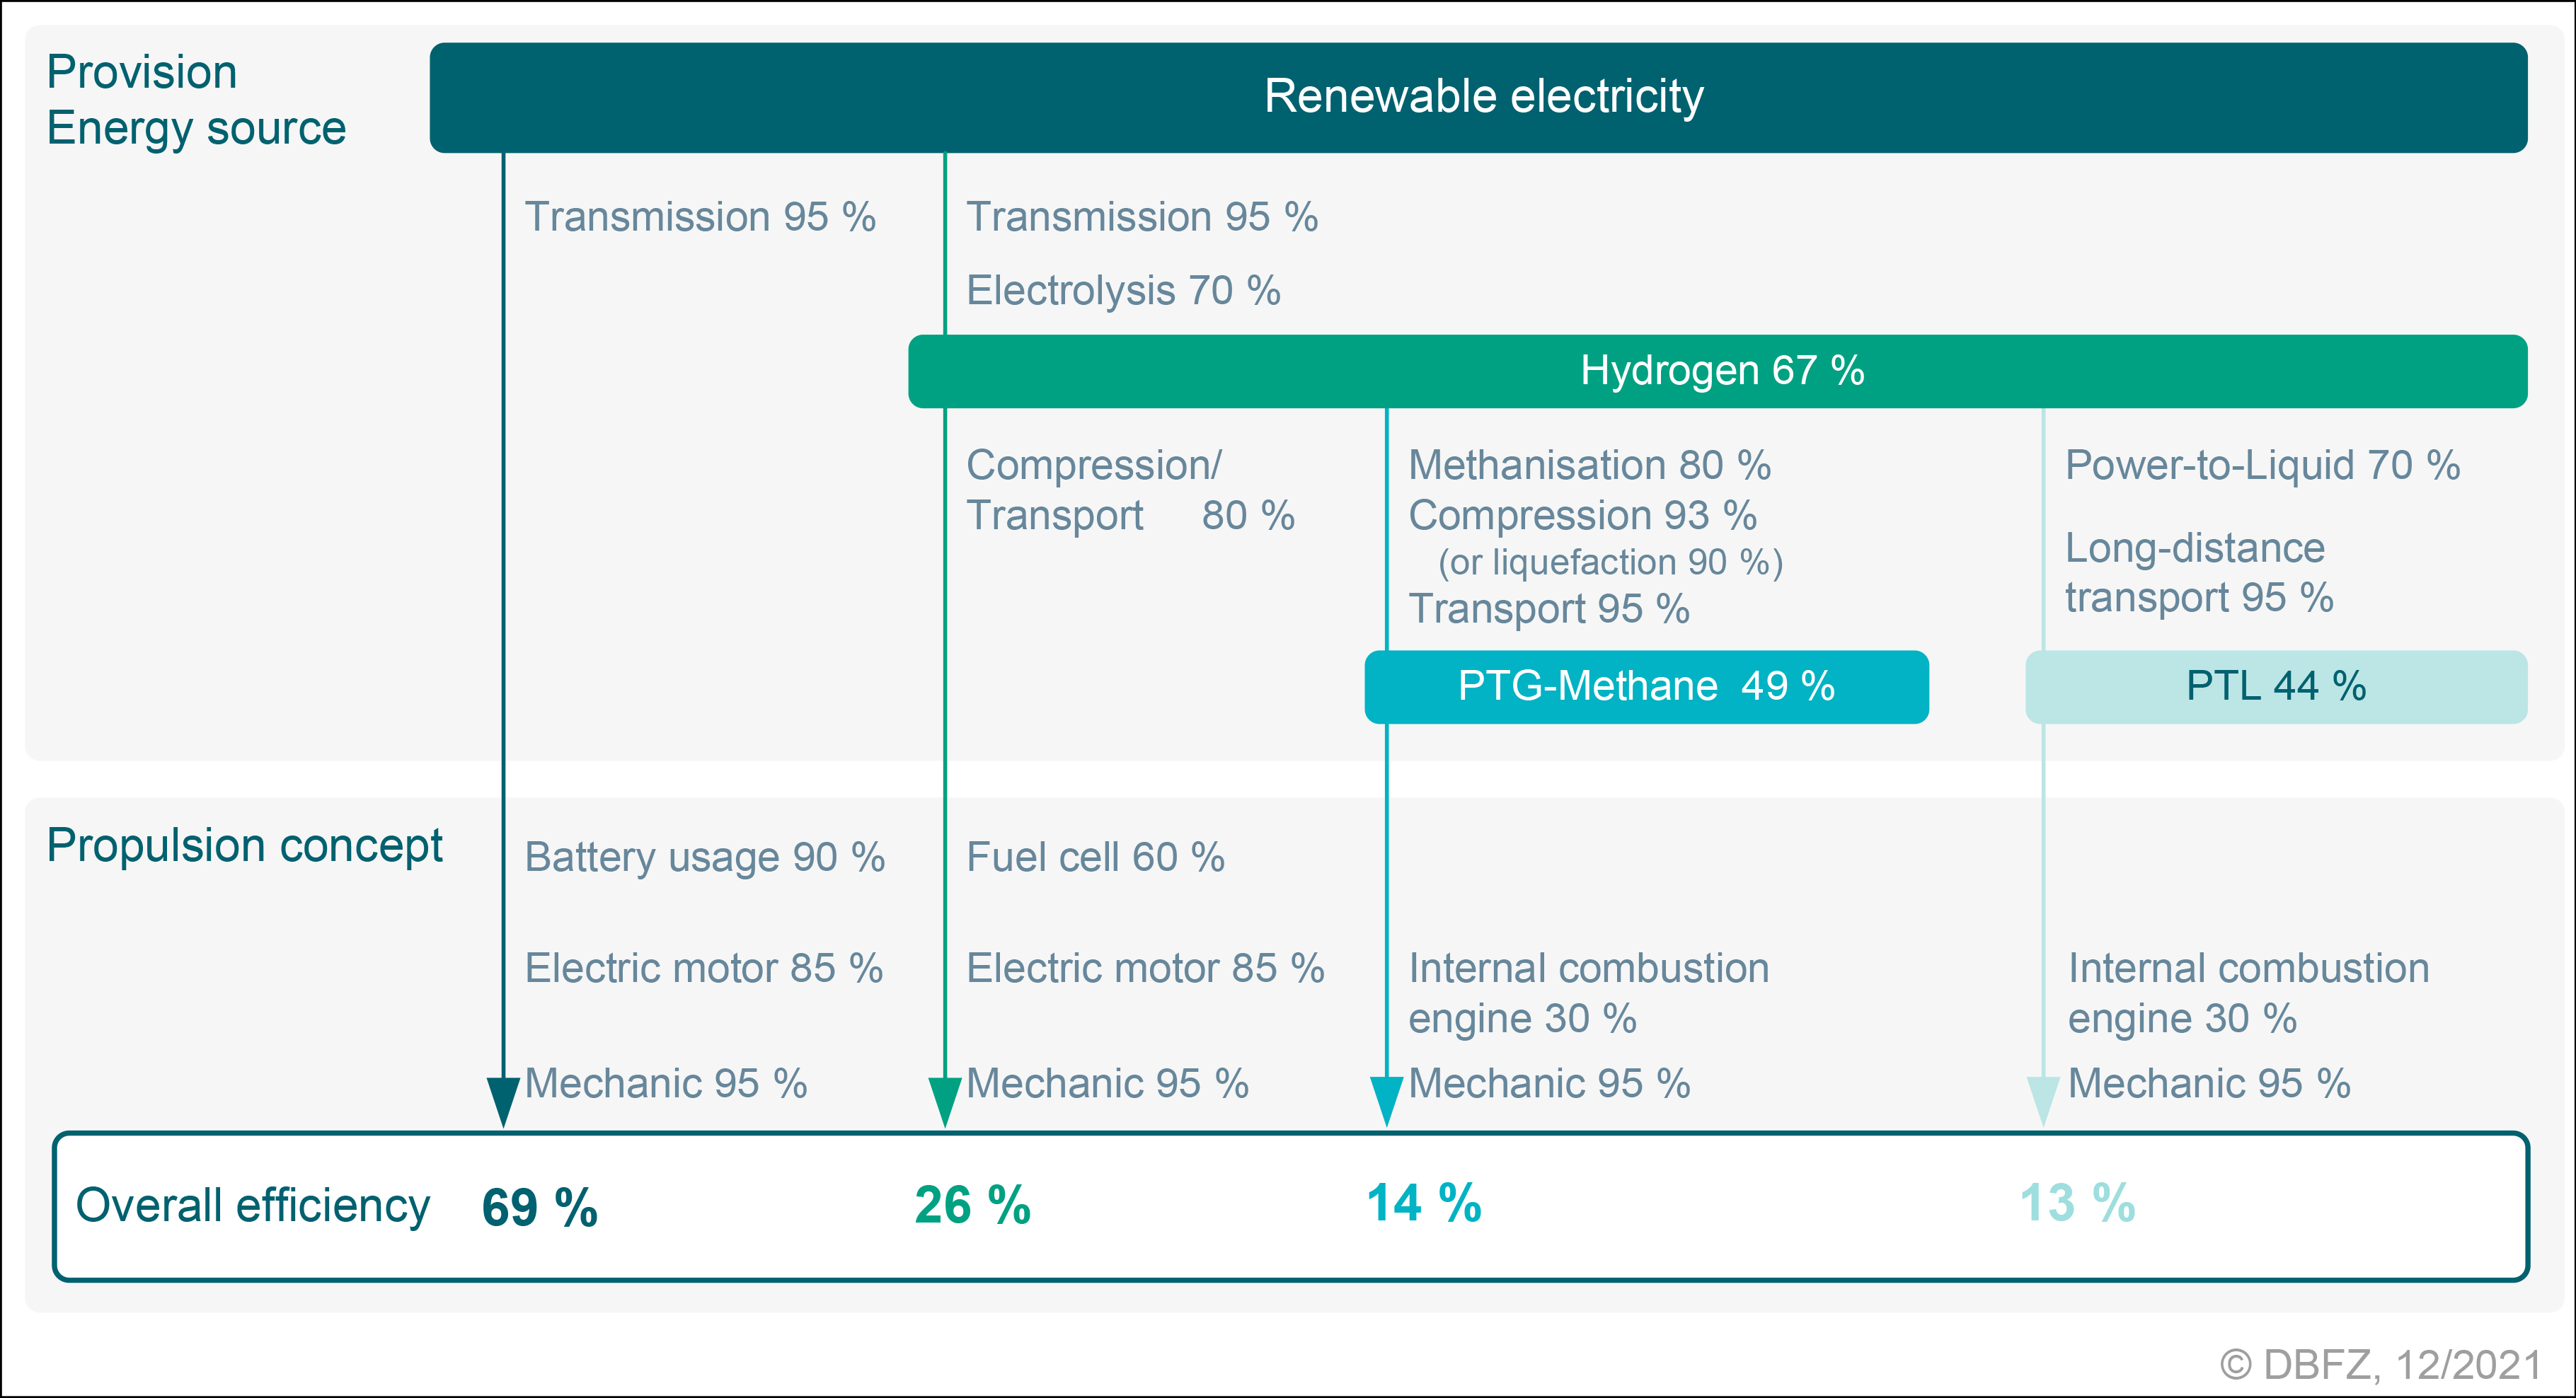
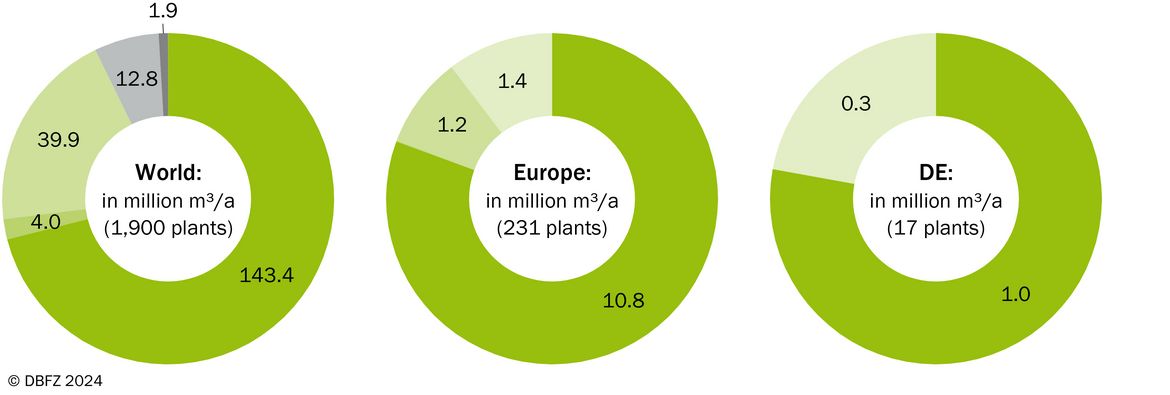
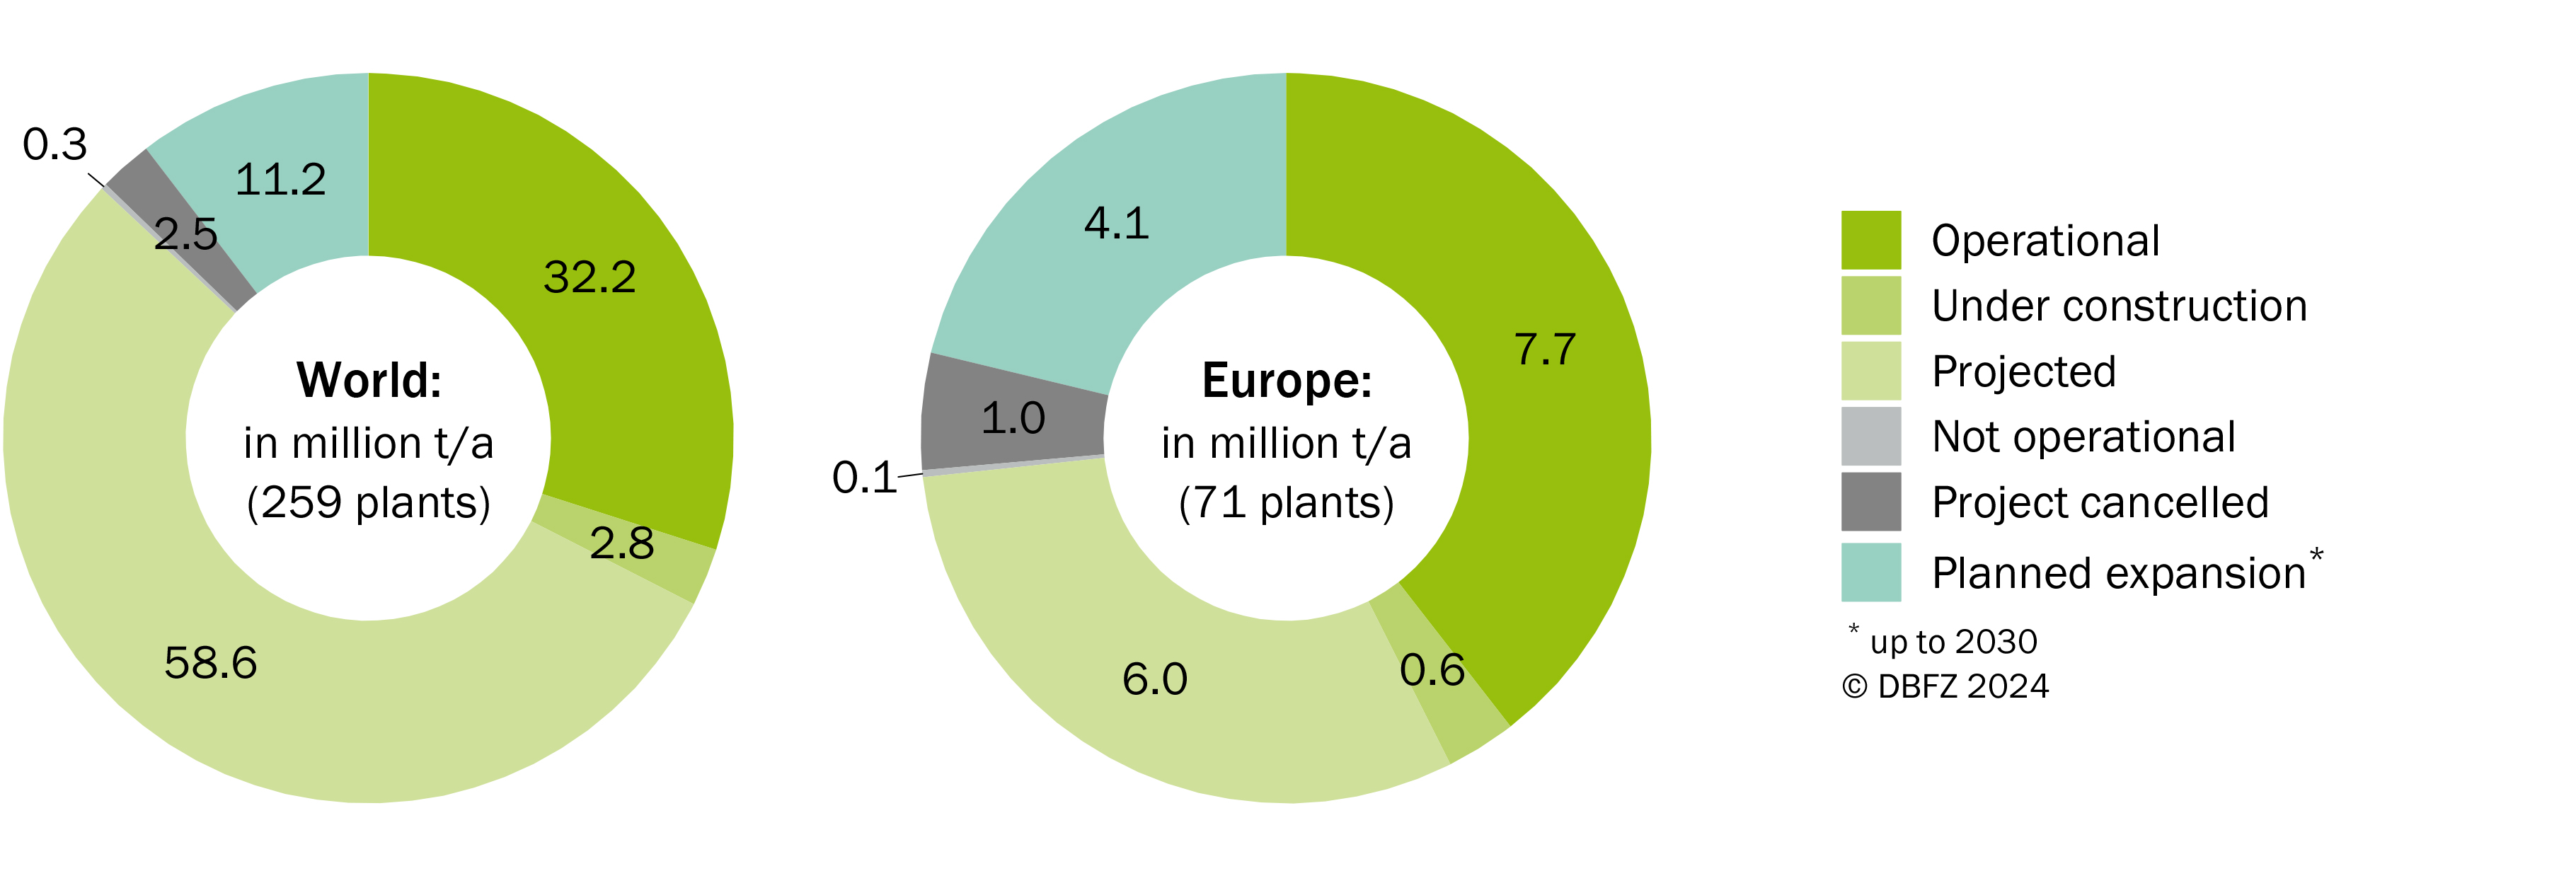
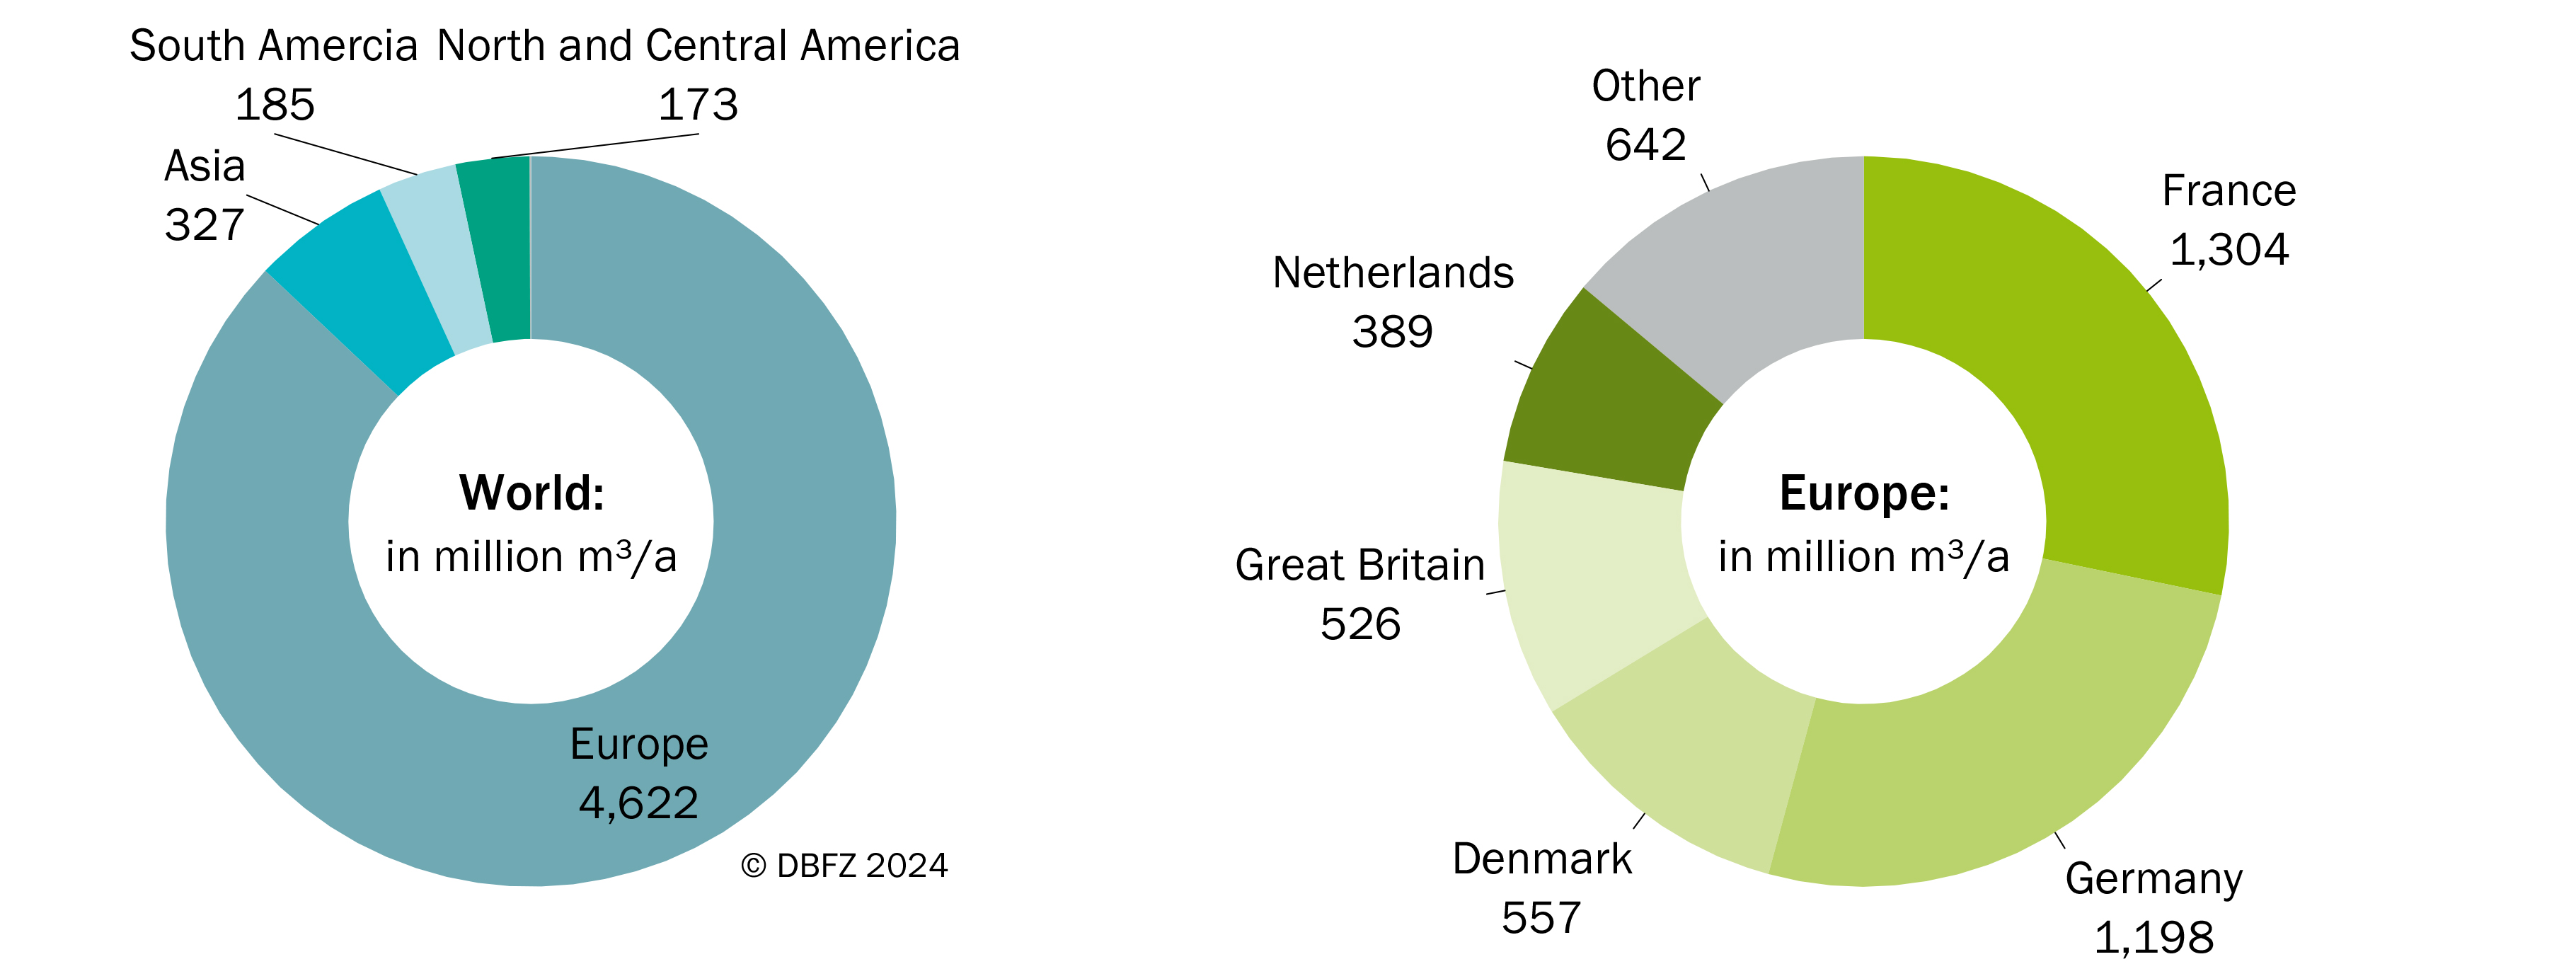
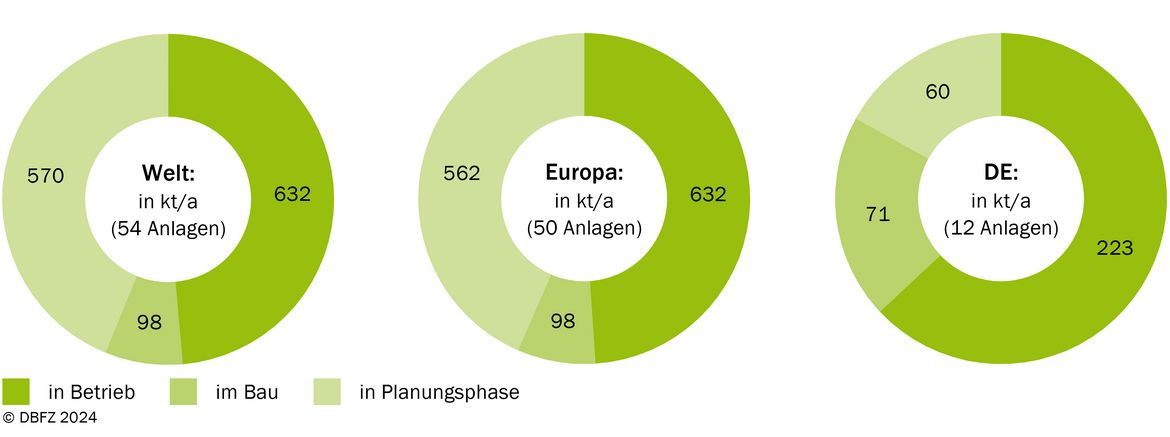
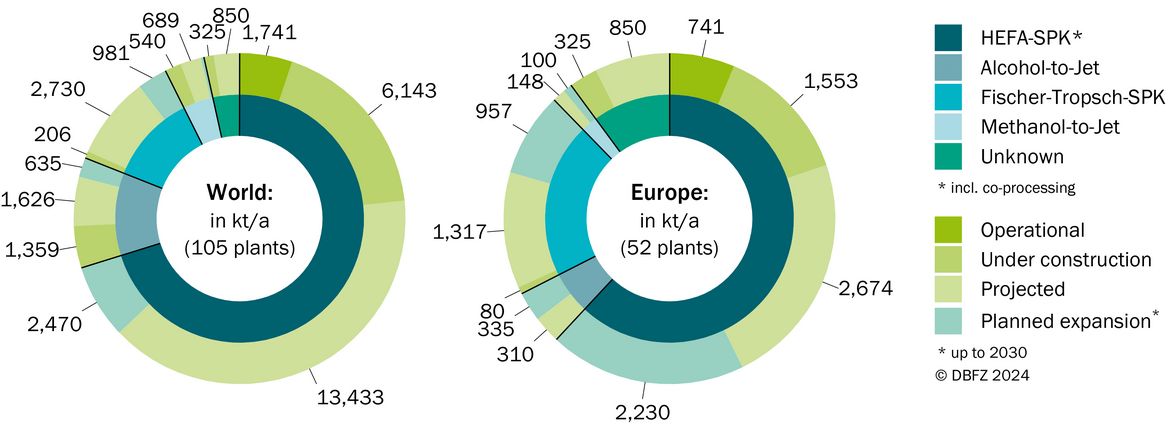
Chapter 4: Production technologies for the provision of renewable fuels
When using the illustrations in Chapter 4, please cite them as follows:
Hauschild, S.; Costa de Paiva, G.; Tuschewitzki, W.; Prieß, T.; Mendler, F.; Neuling, U.; Zitscher, T.; Klüpfel, C.; Köchermann, J.; Thuneke, K.; Görsch, K. (2025): Technologien zur Kraftstoffbereitstellung. In: Schröder, J.; Görsch, K. (Hrsg.) (2025). Erneuerbare Energien im Verkehr: Monitoringbericht. Leipzig: DBFZ. 205 S. ISBN: 978-3-949807-23-7. DOI: 10.48480/w11j-9w27 S. 54–76.


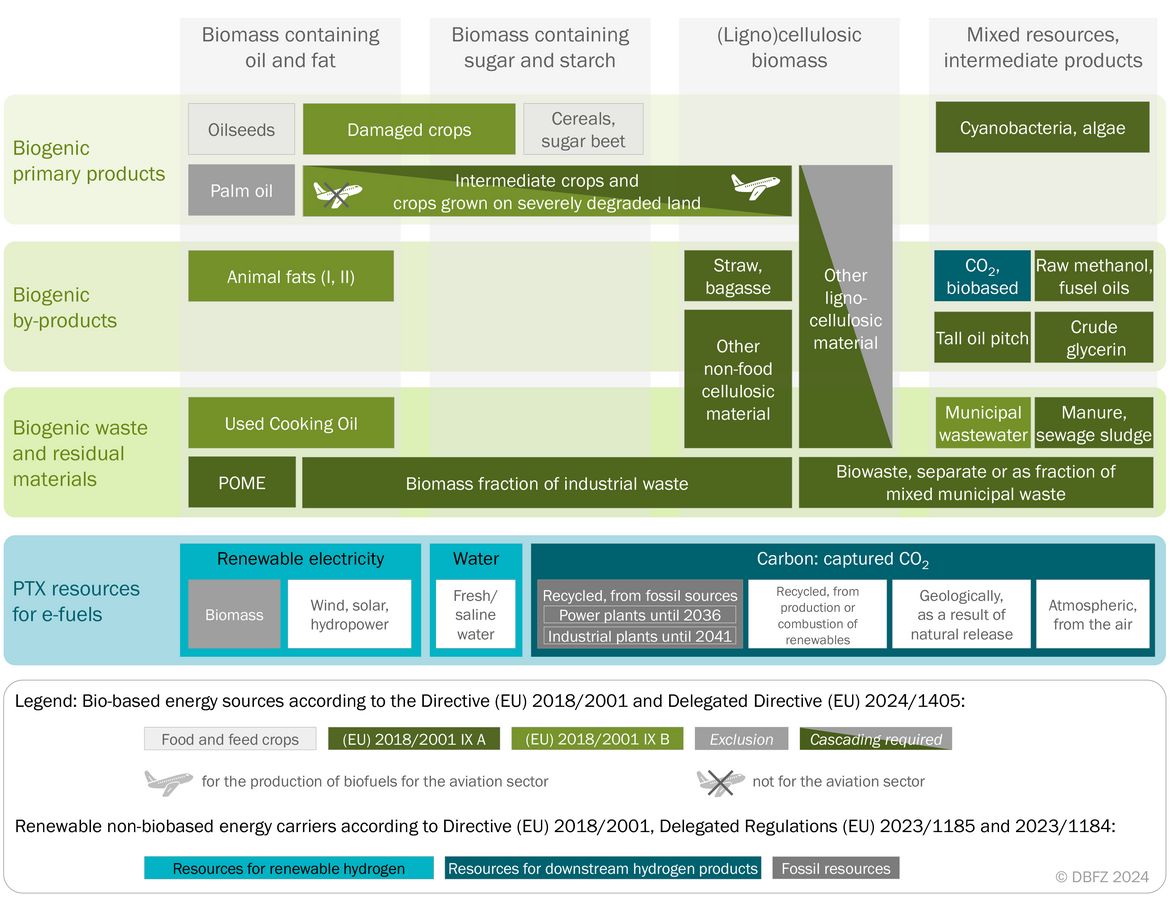
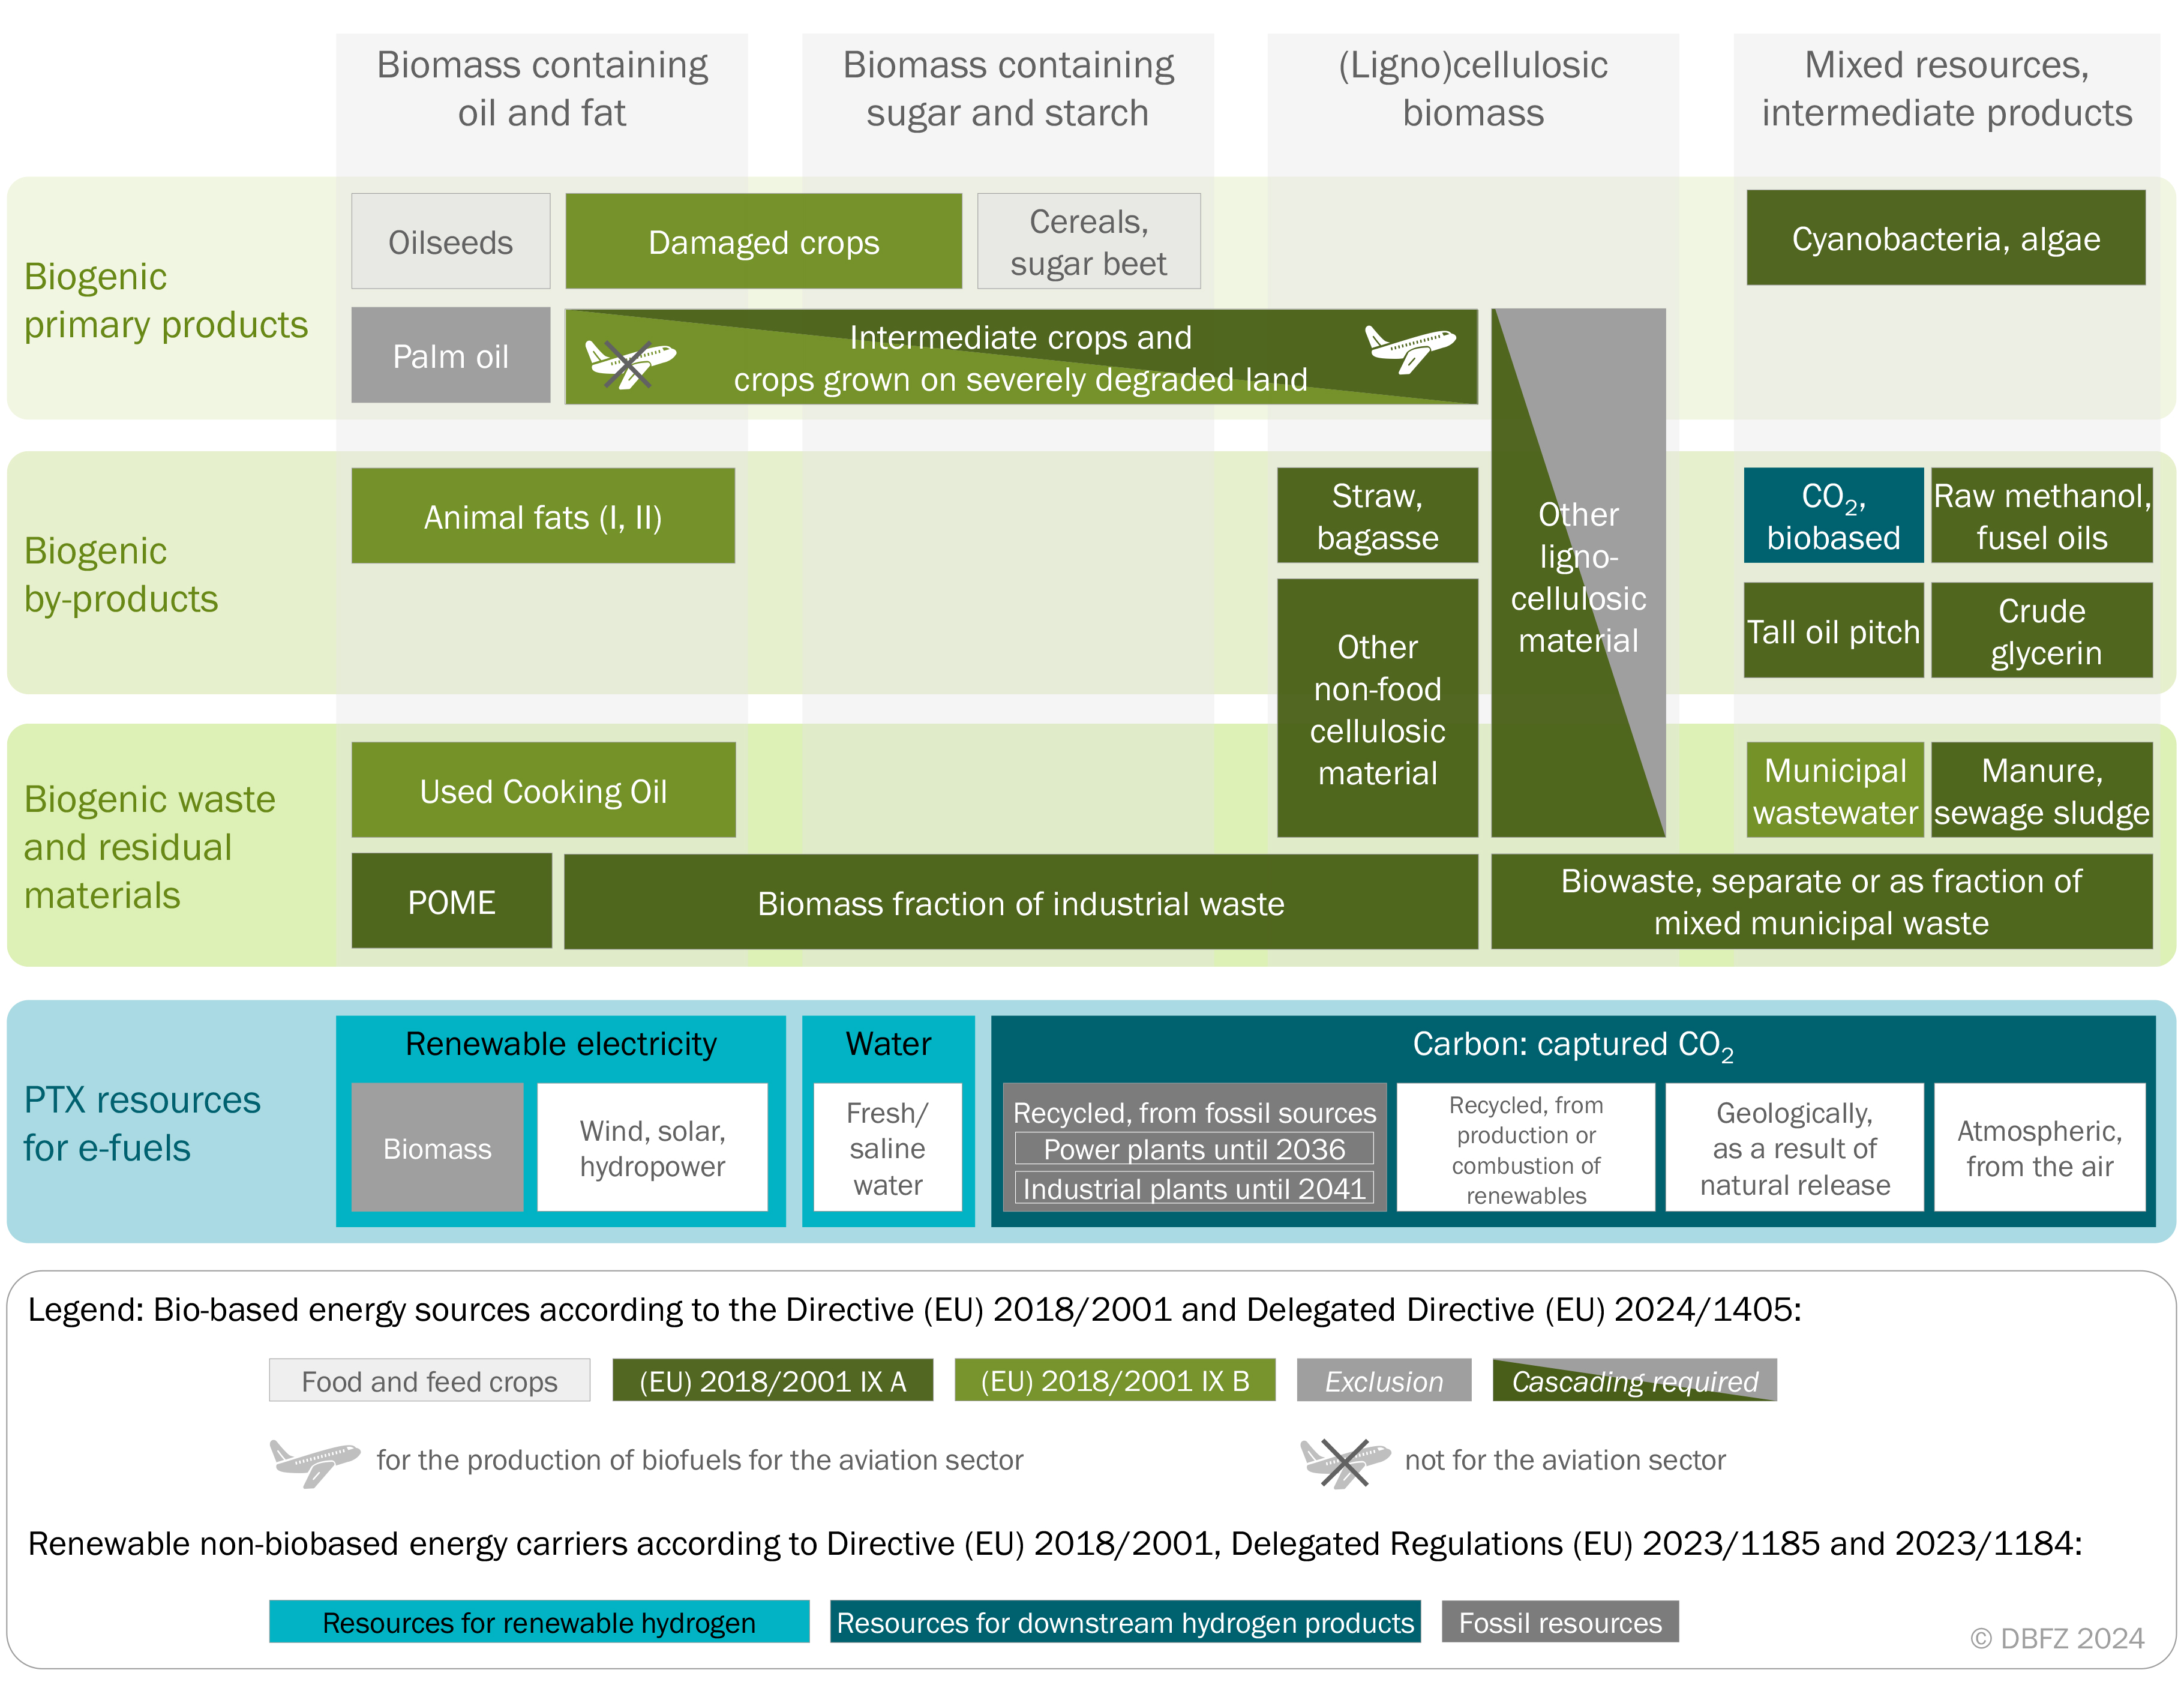
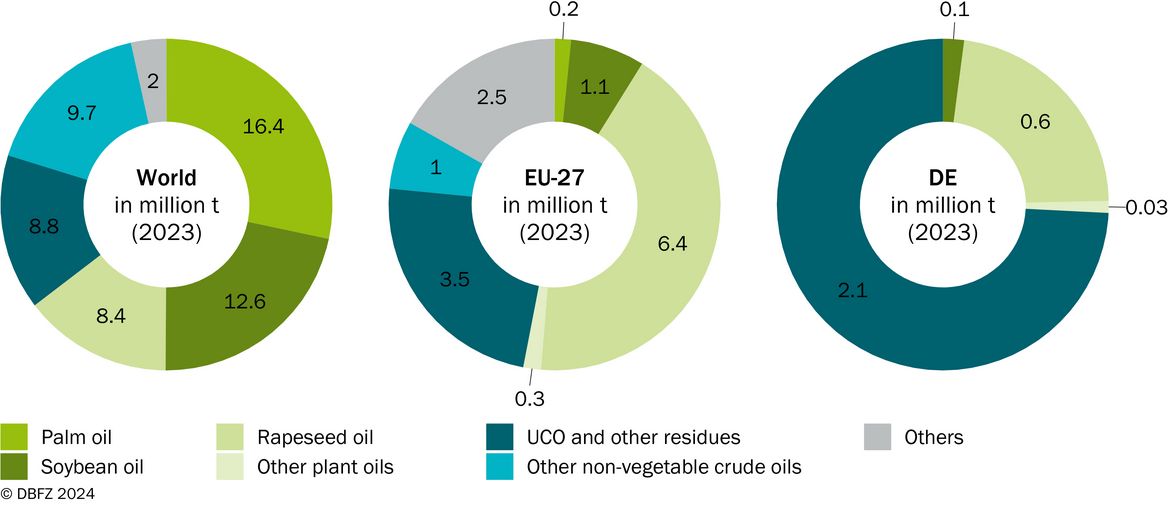
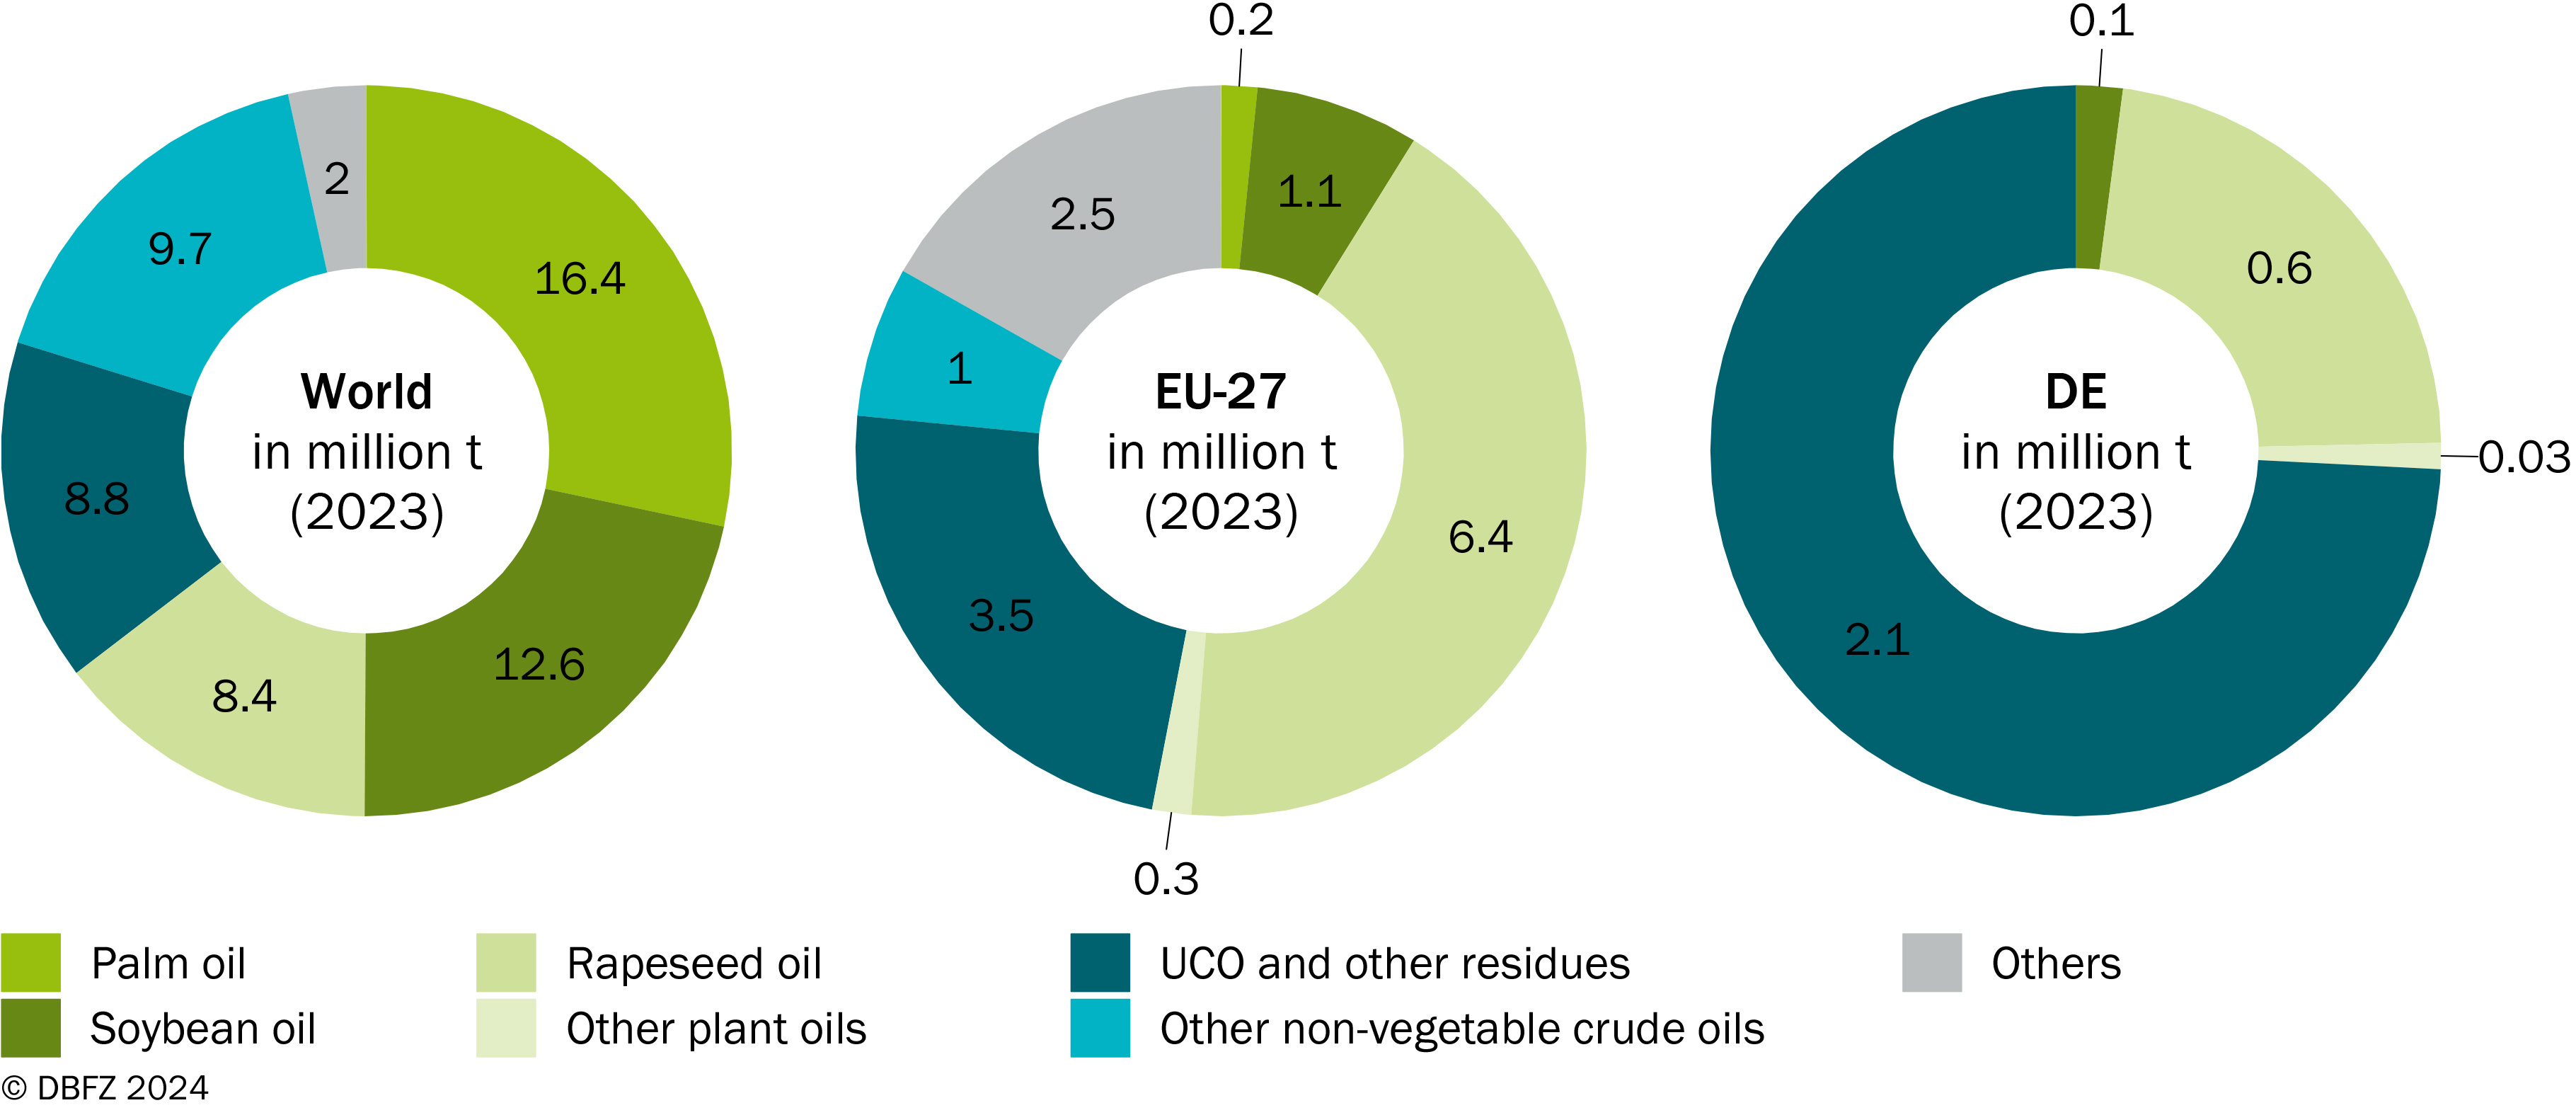
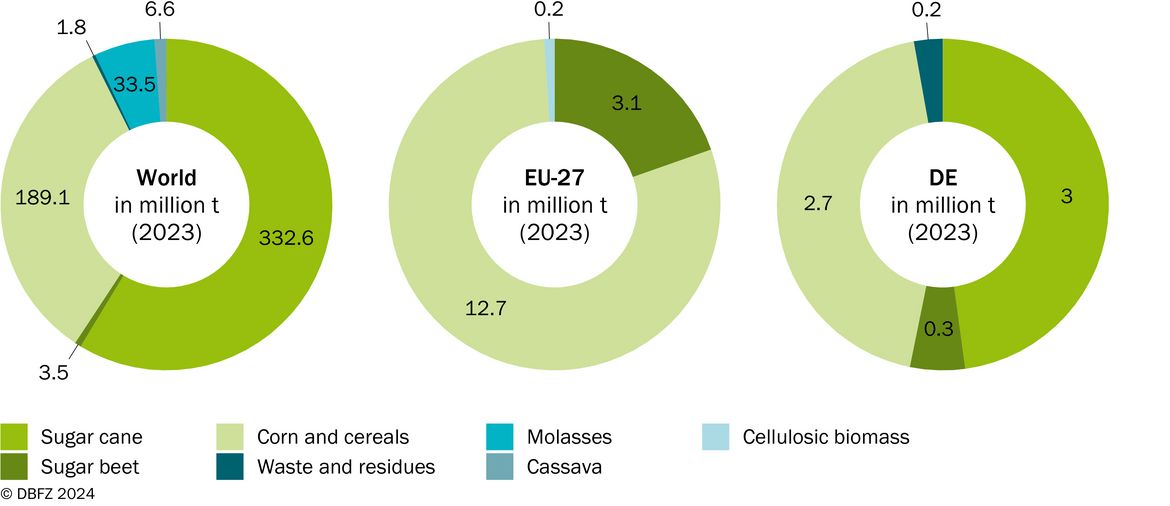
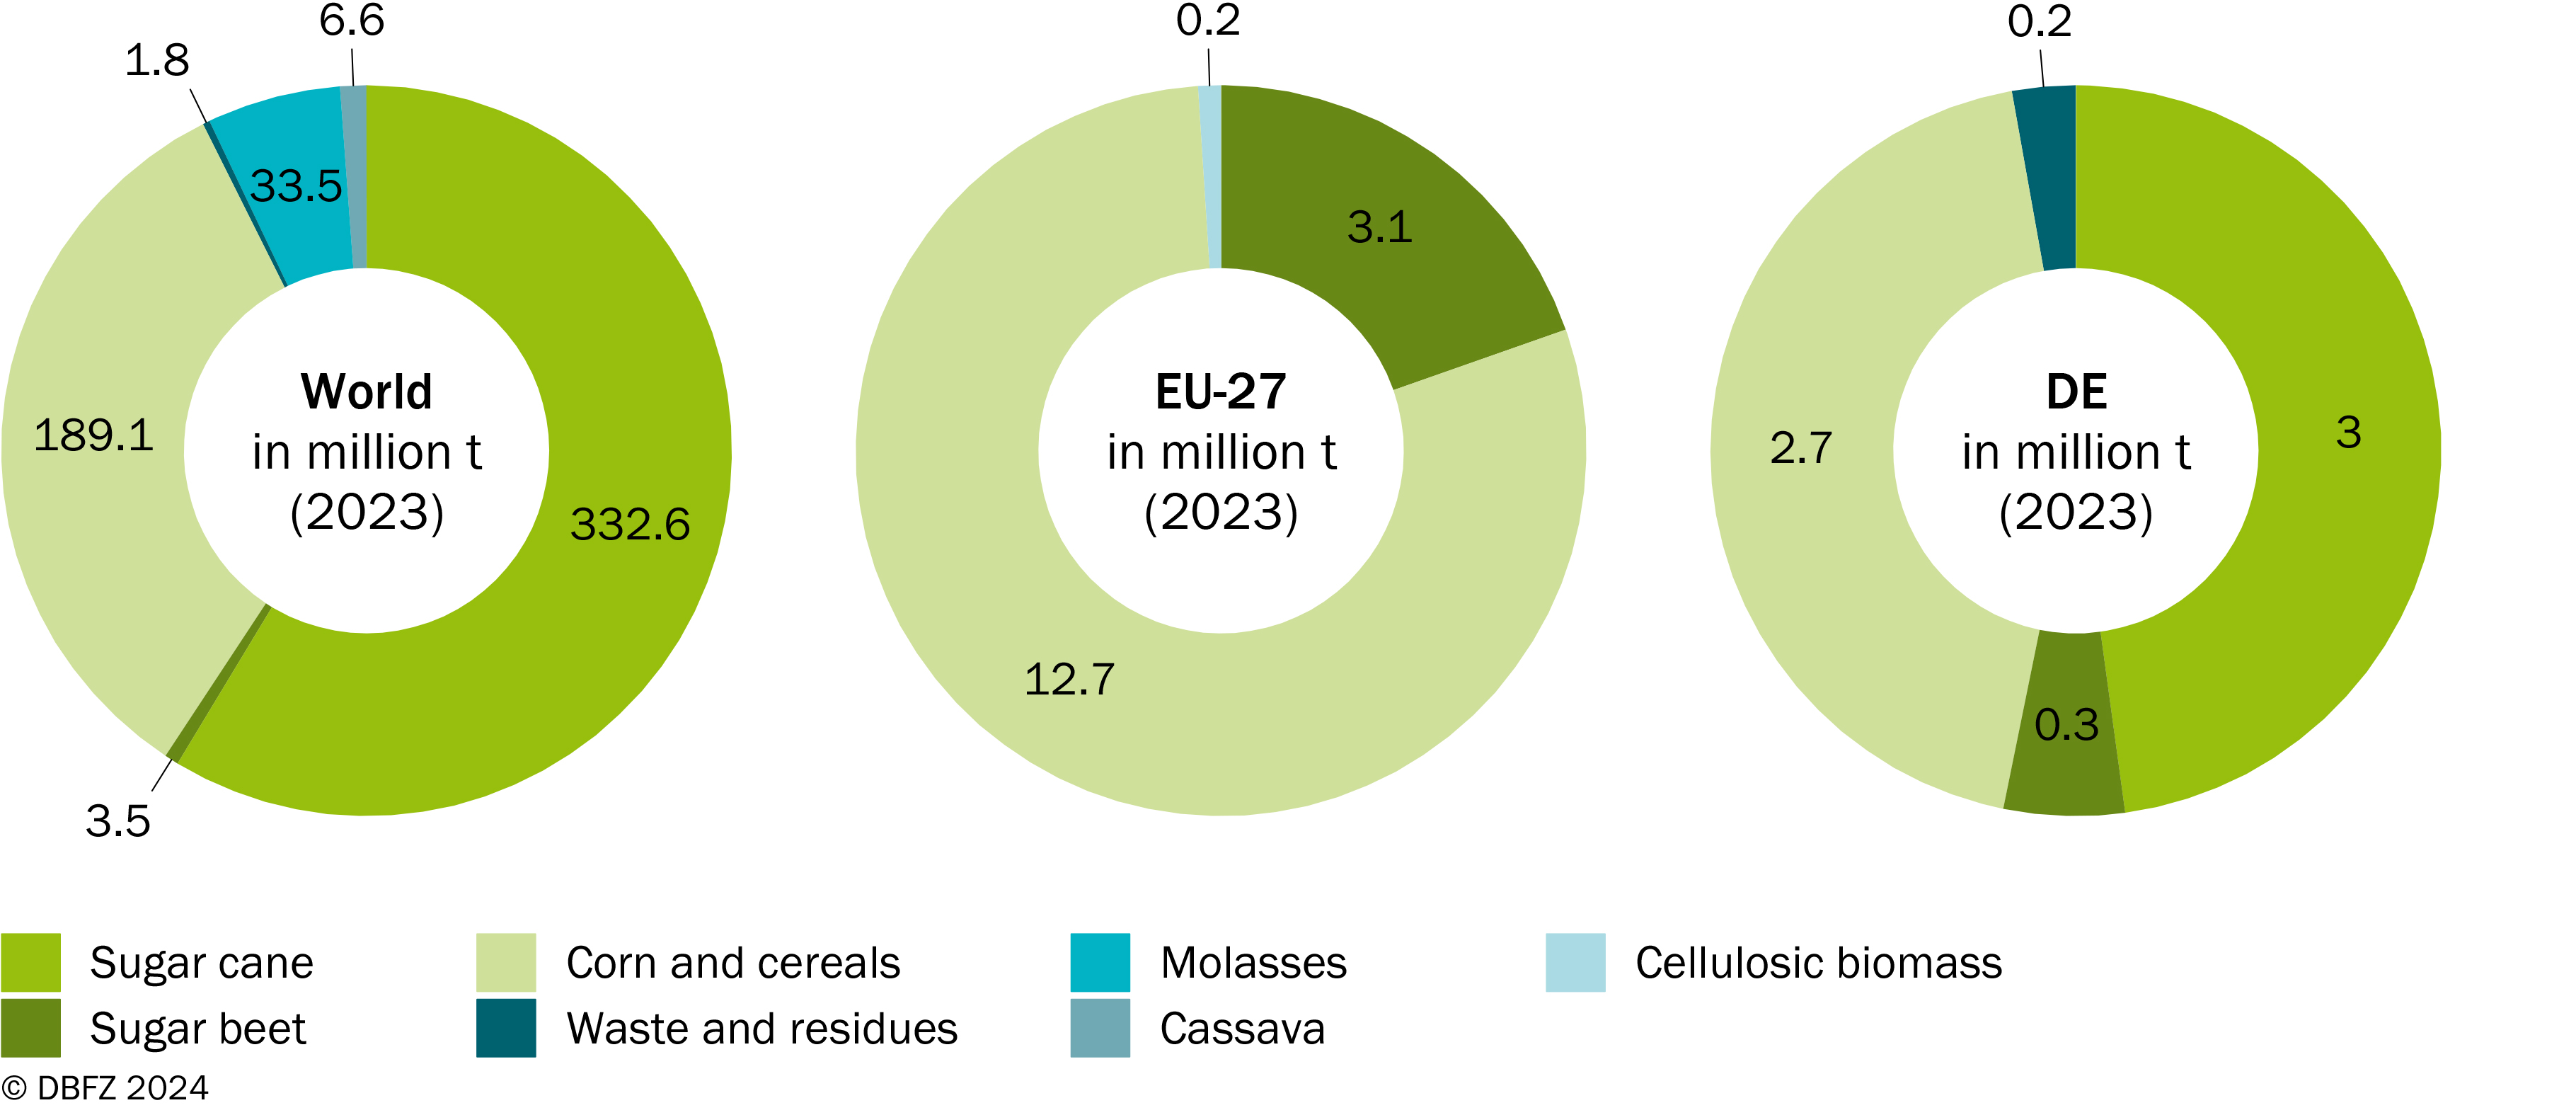
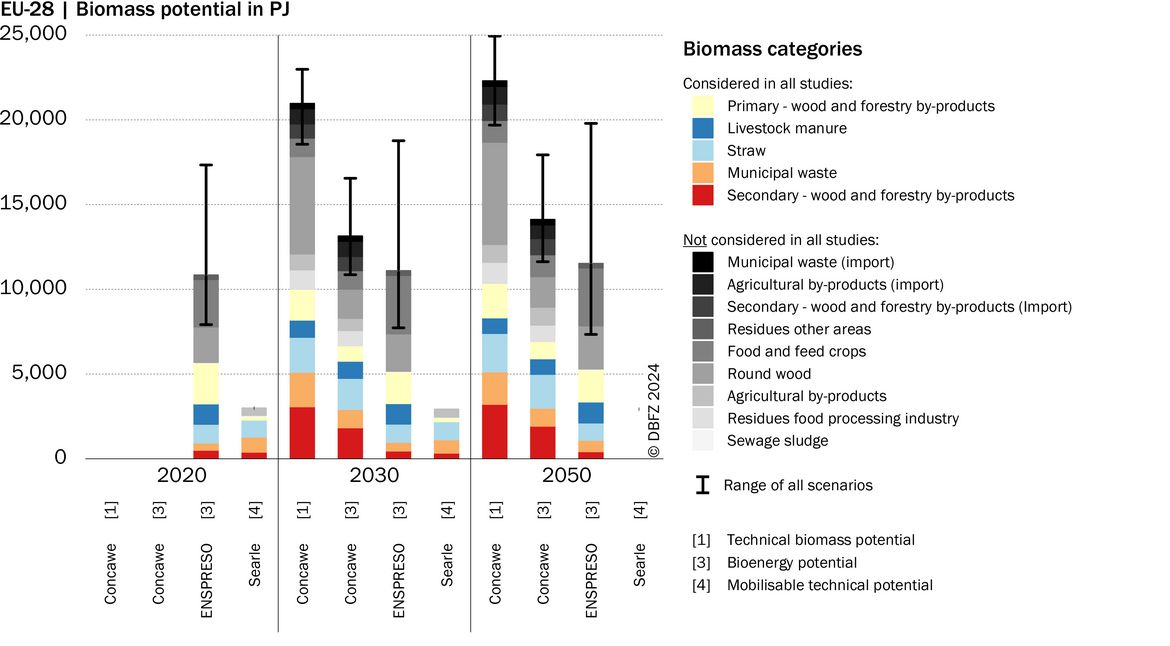
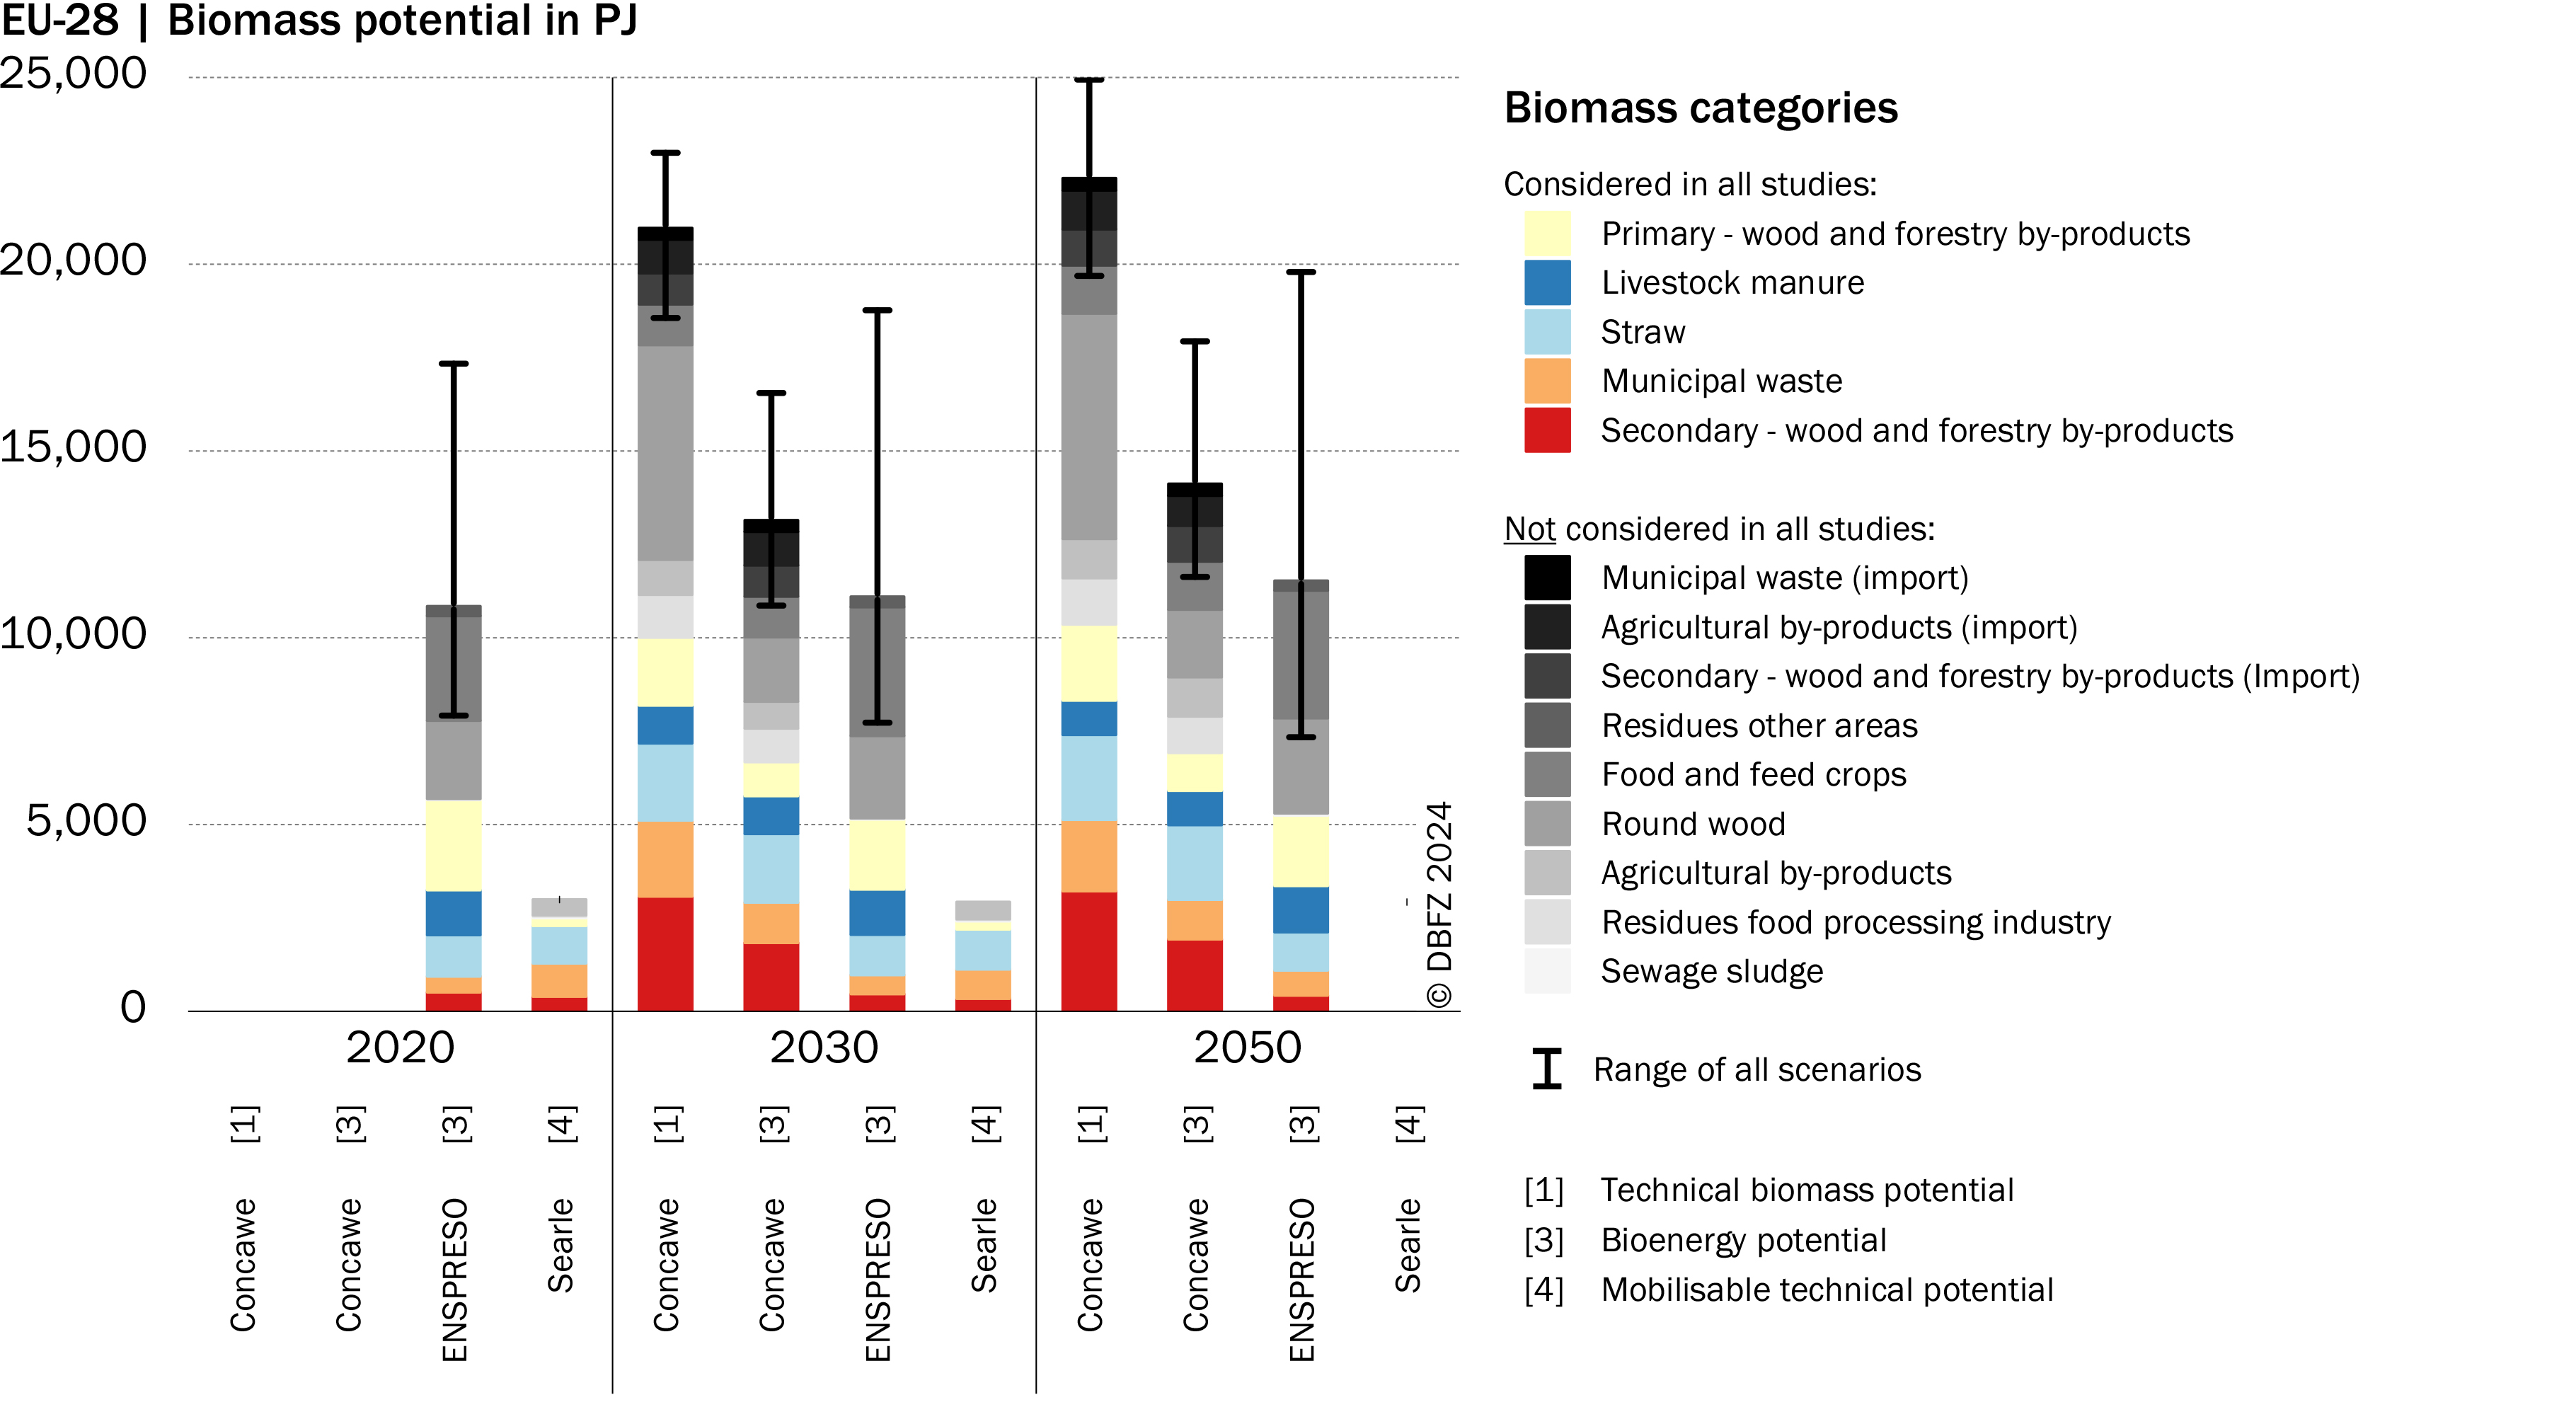
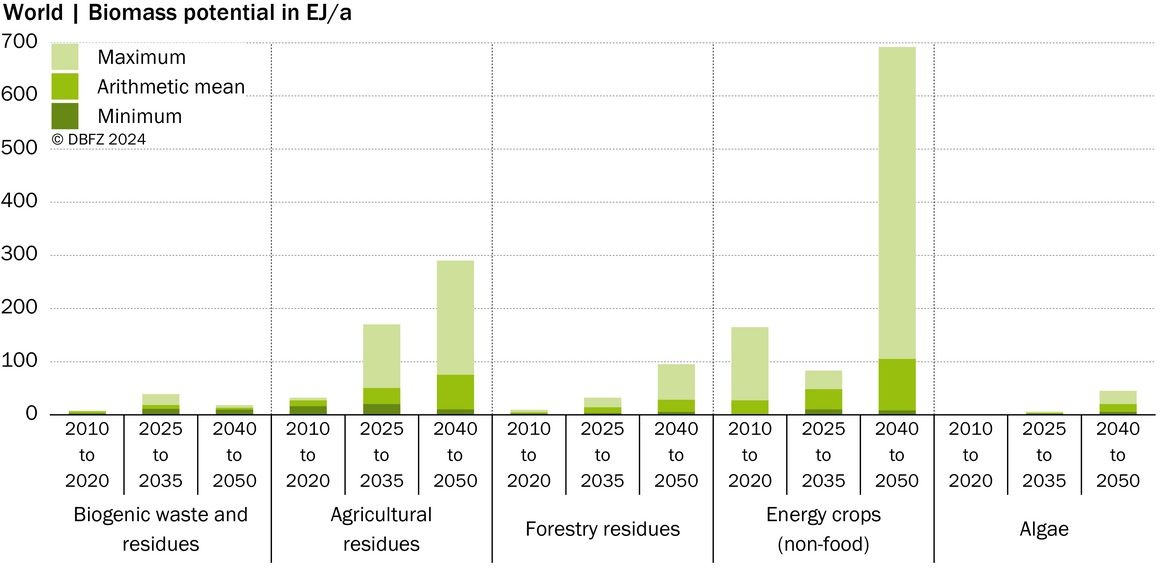
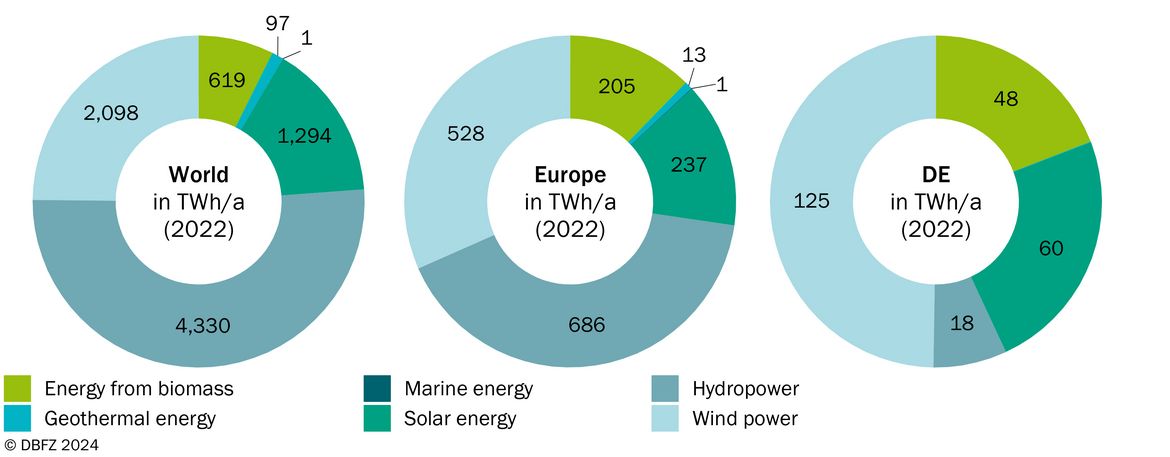
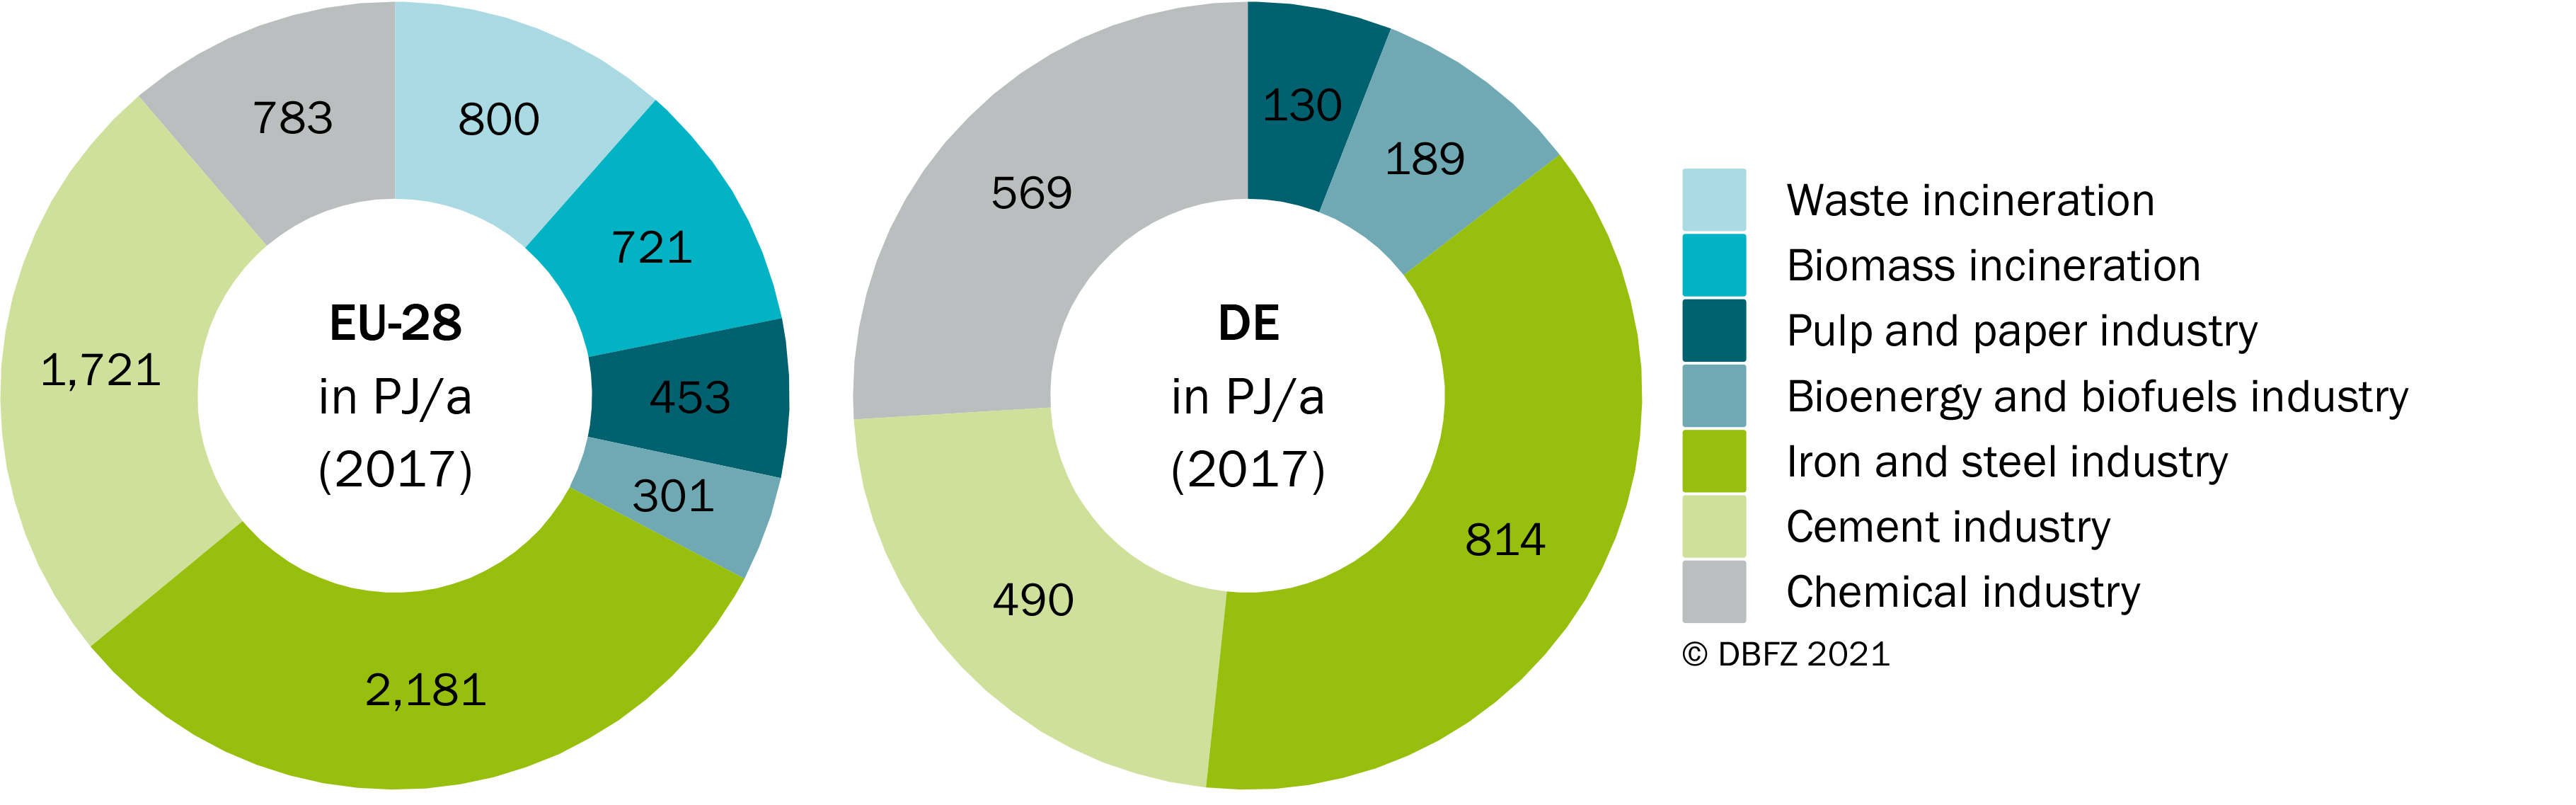
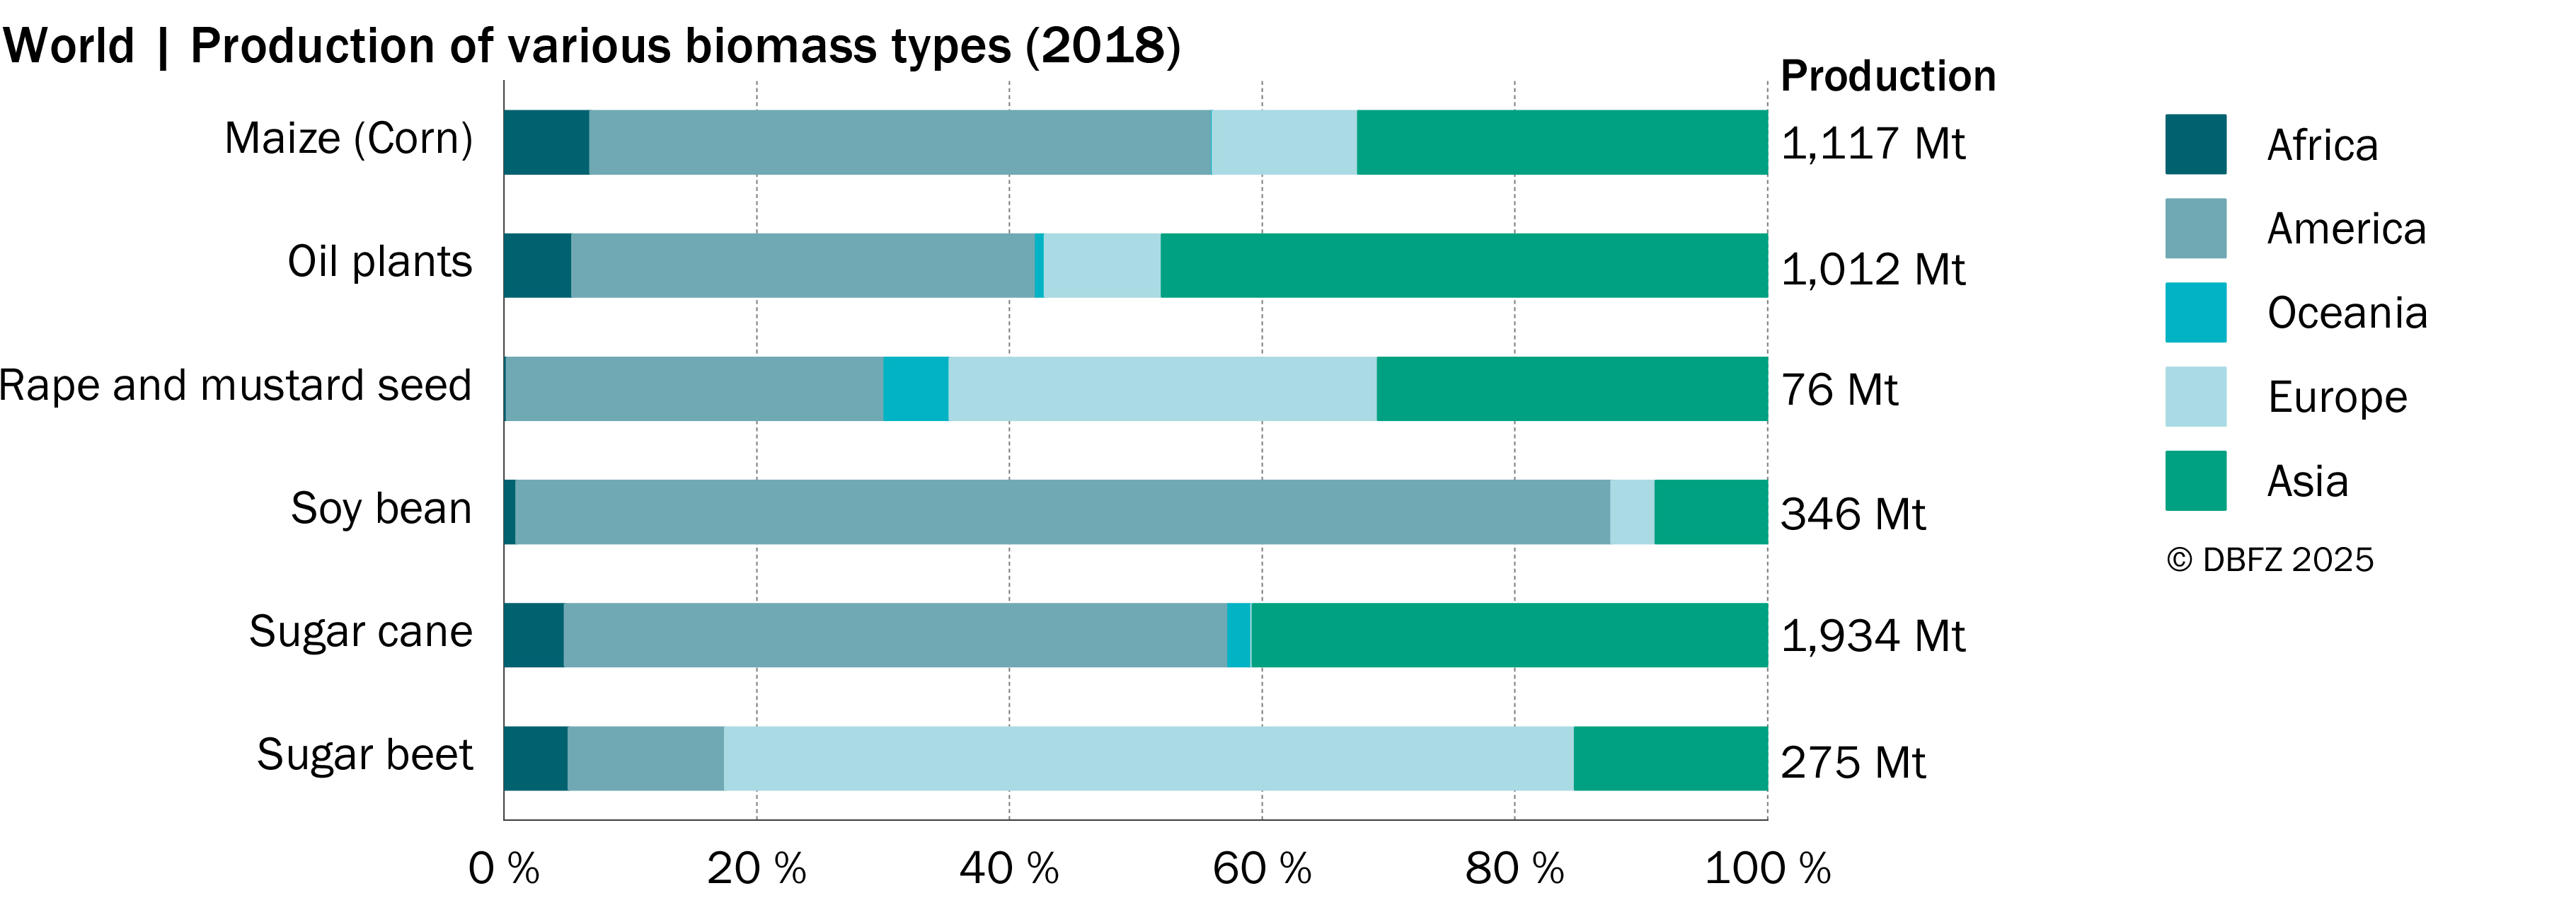
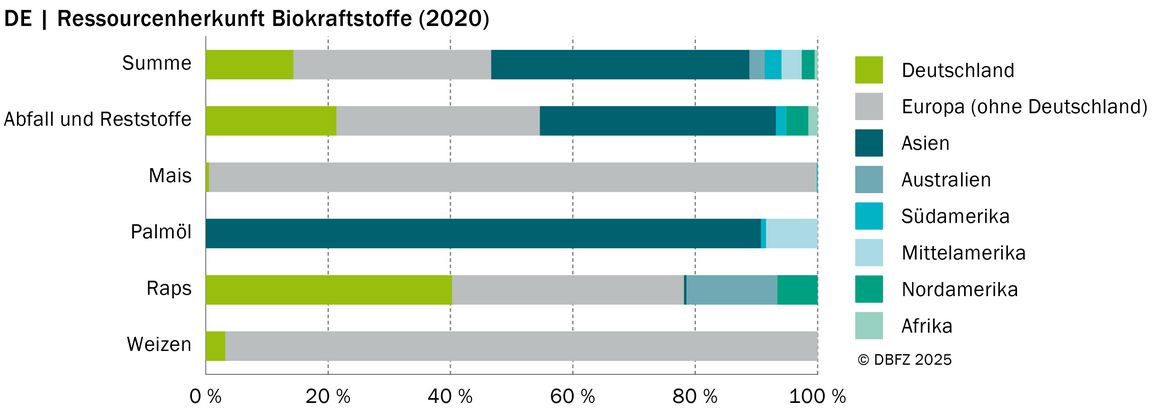
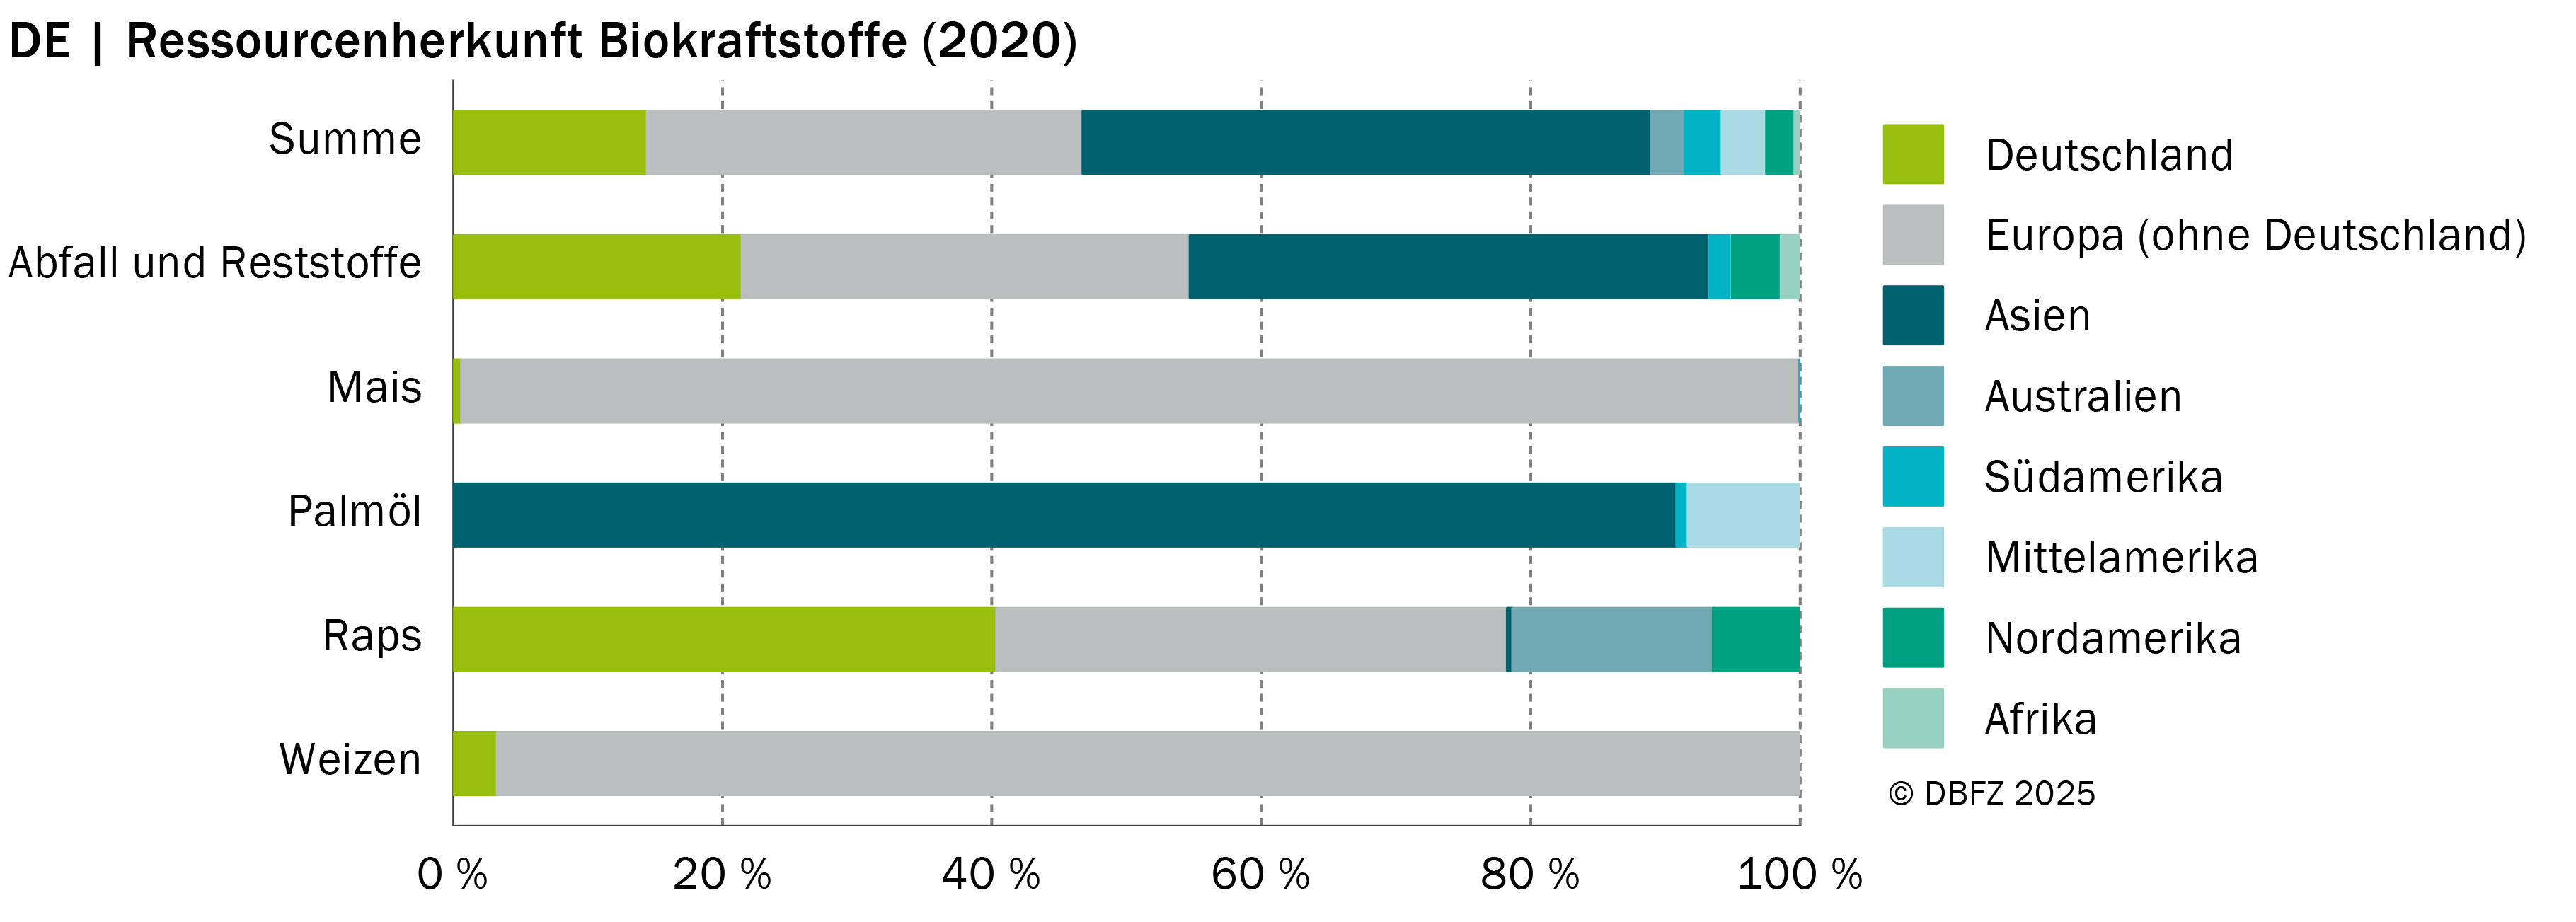
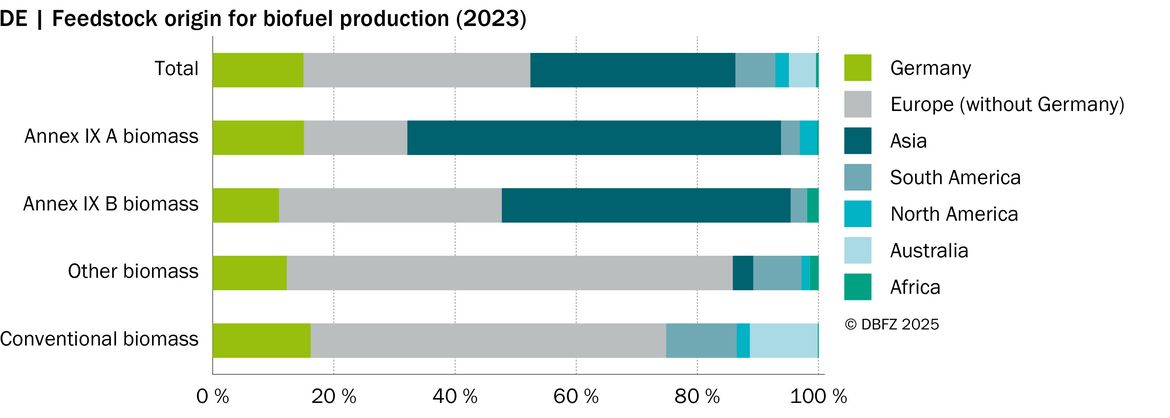
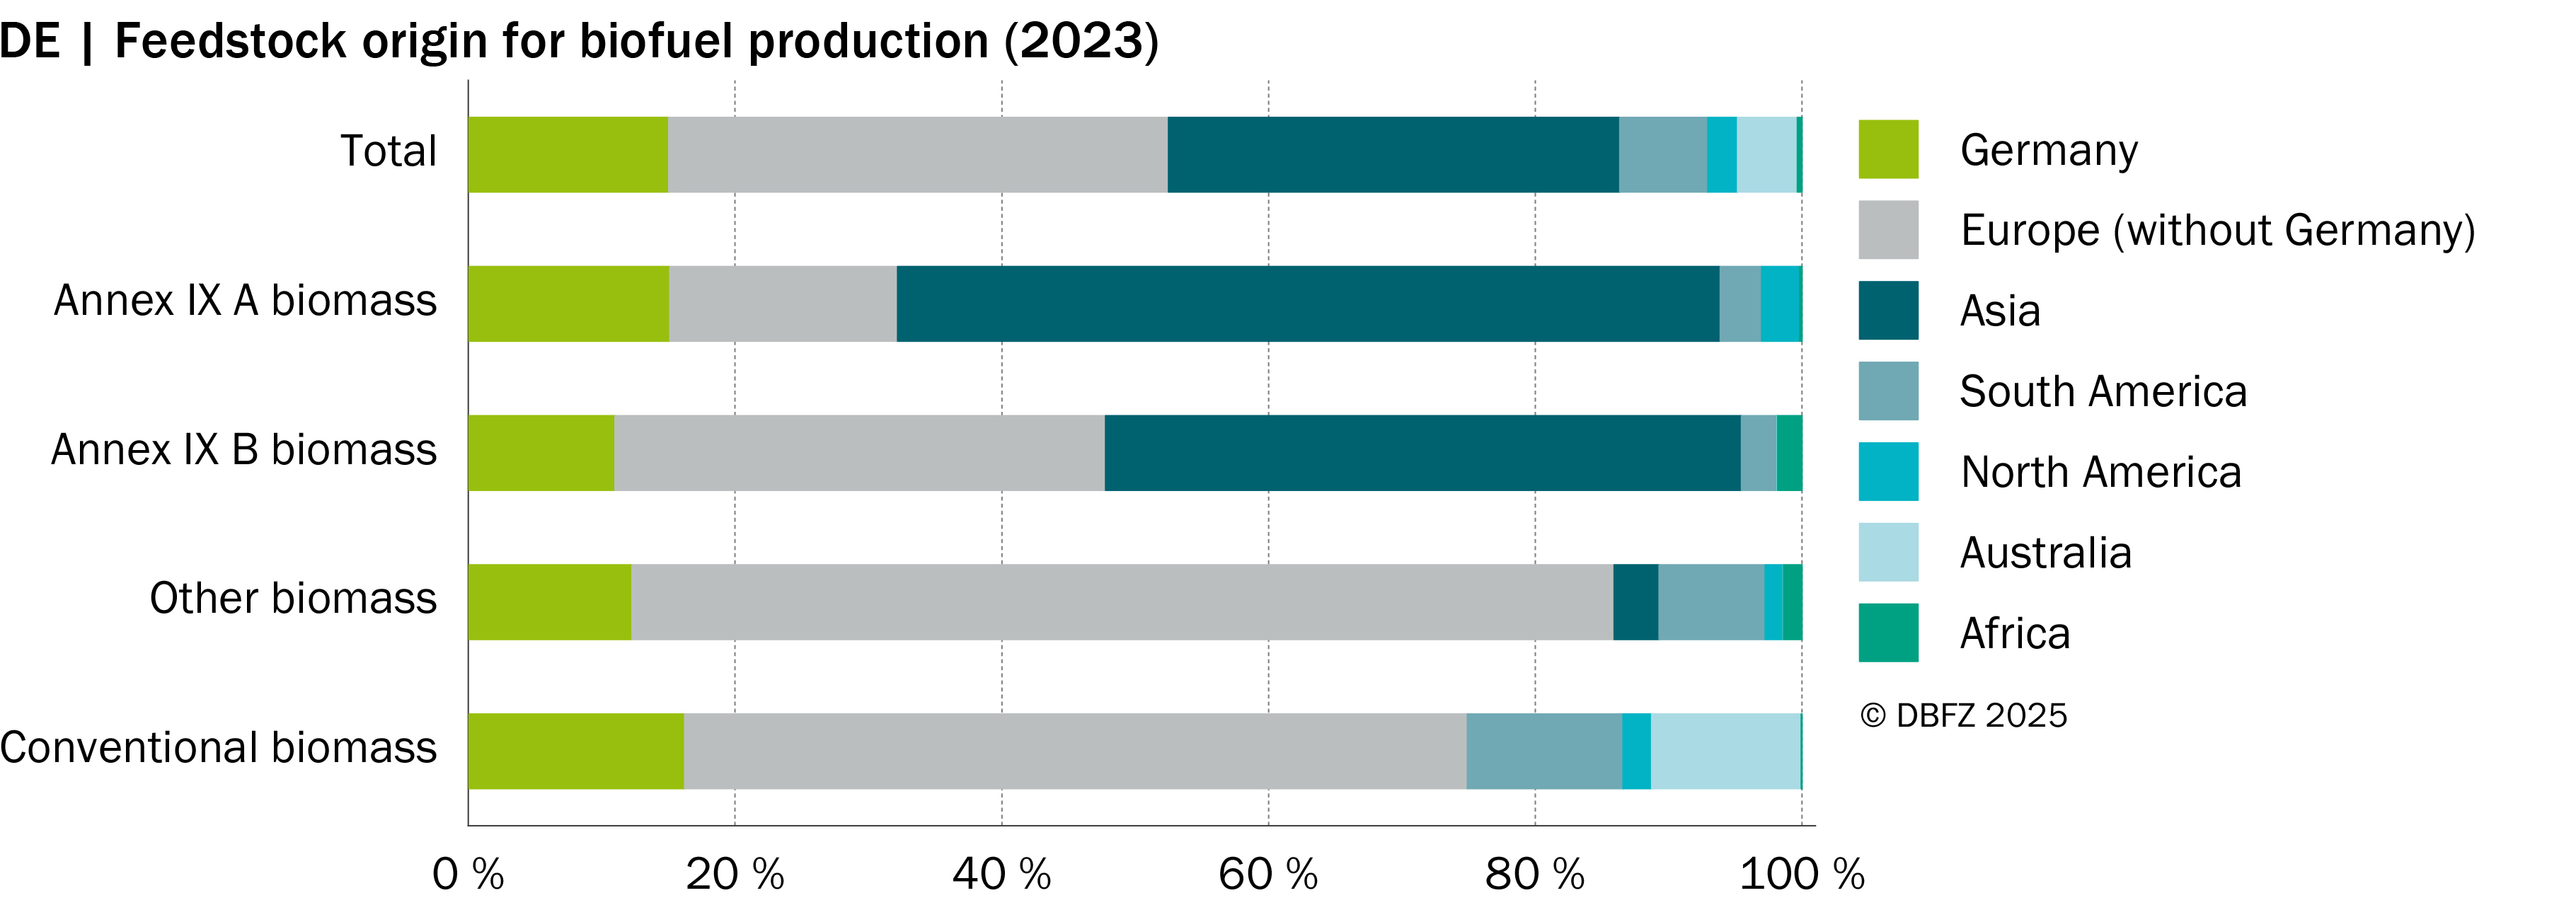
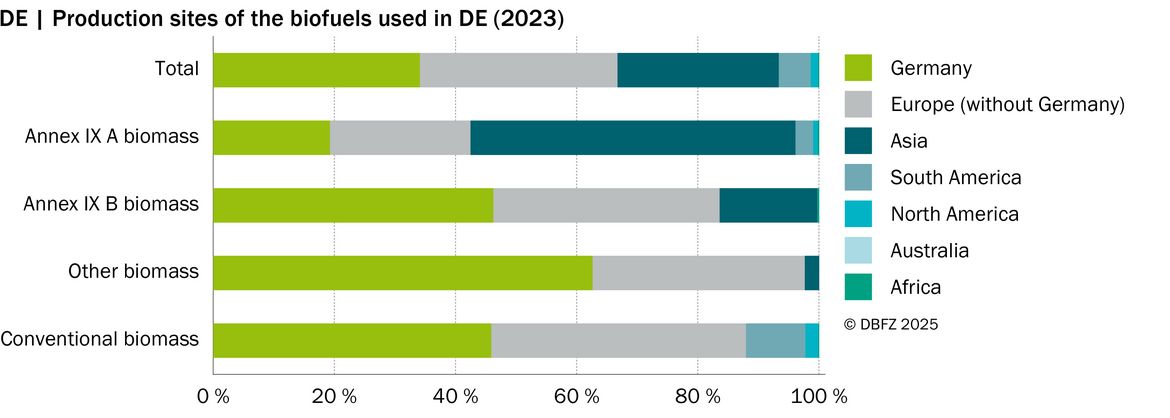
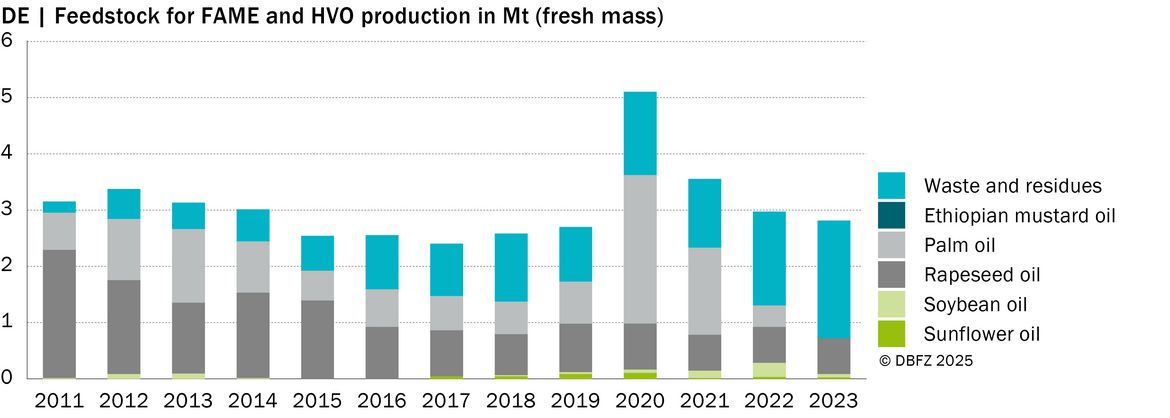
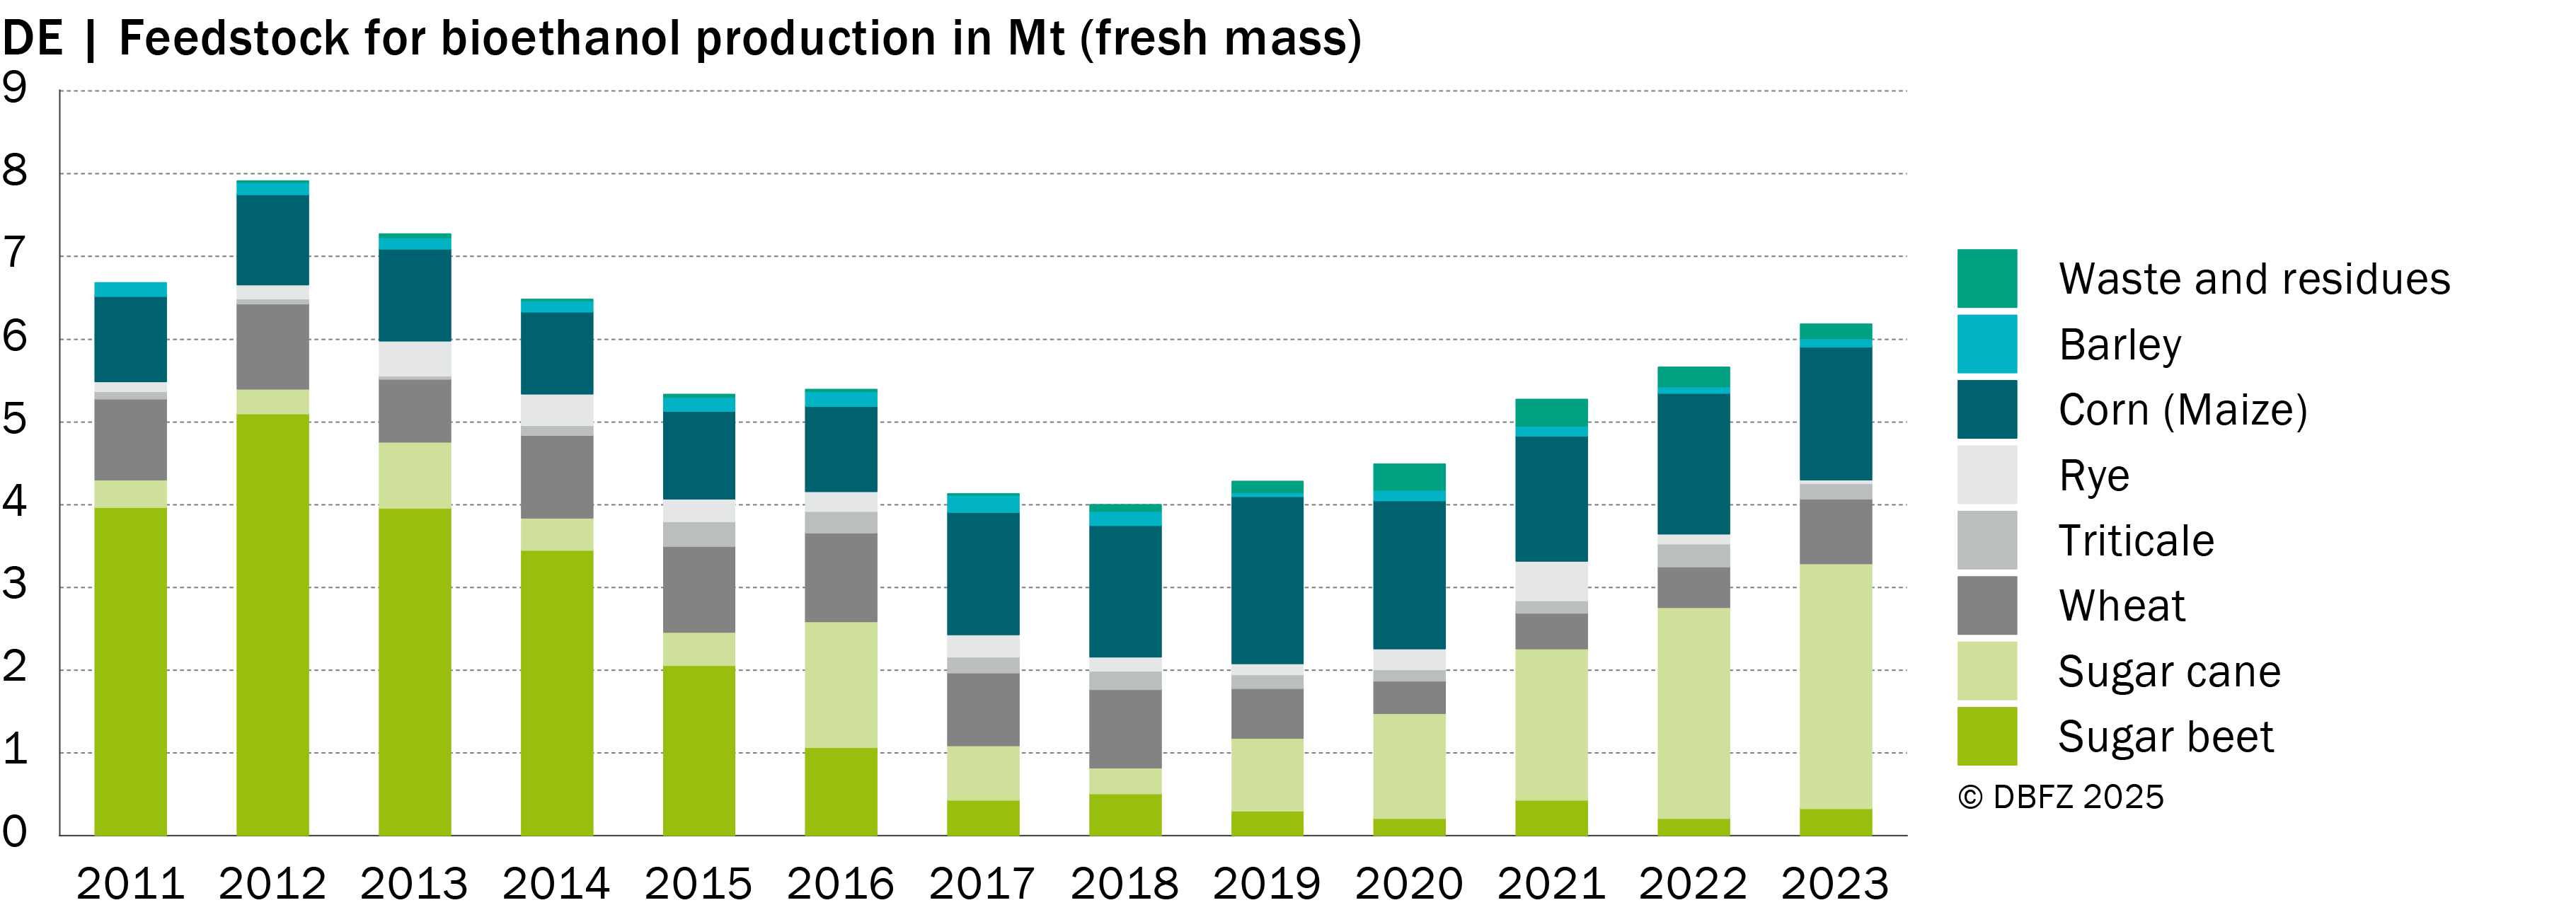
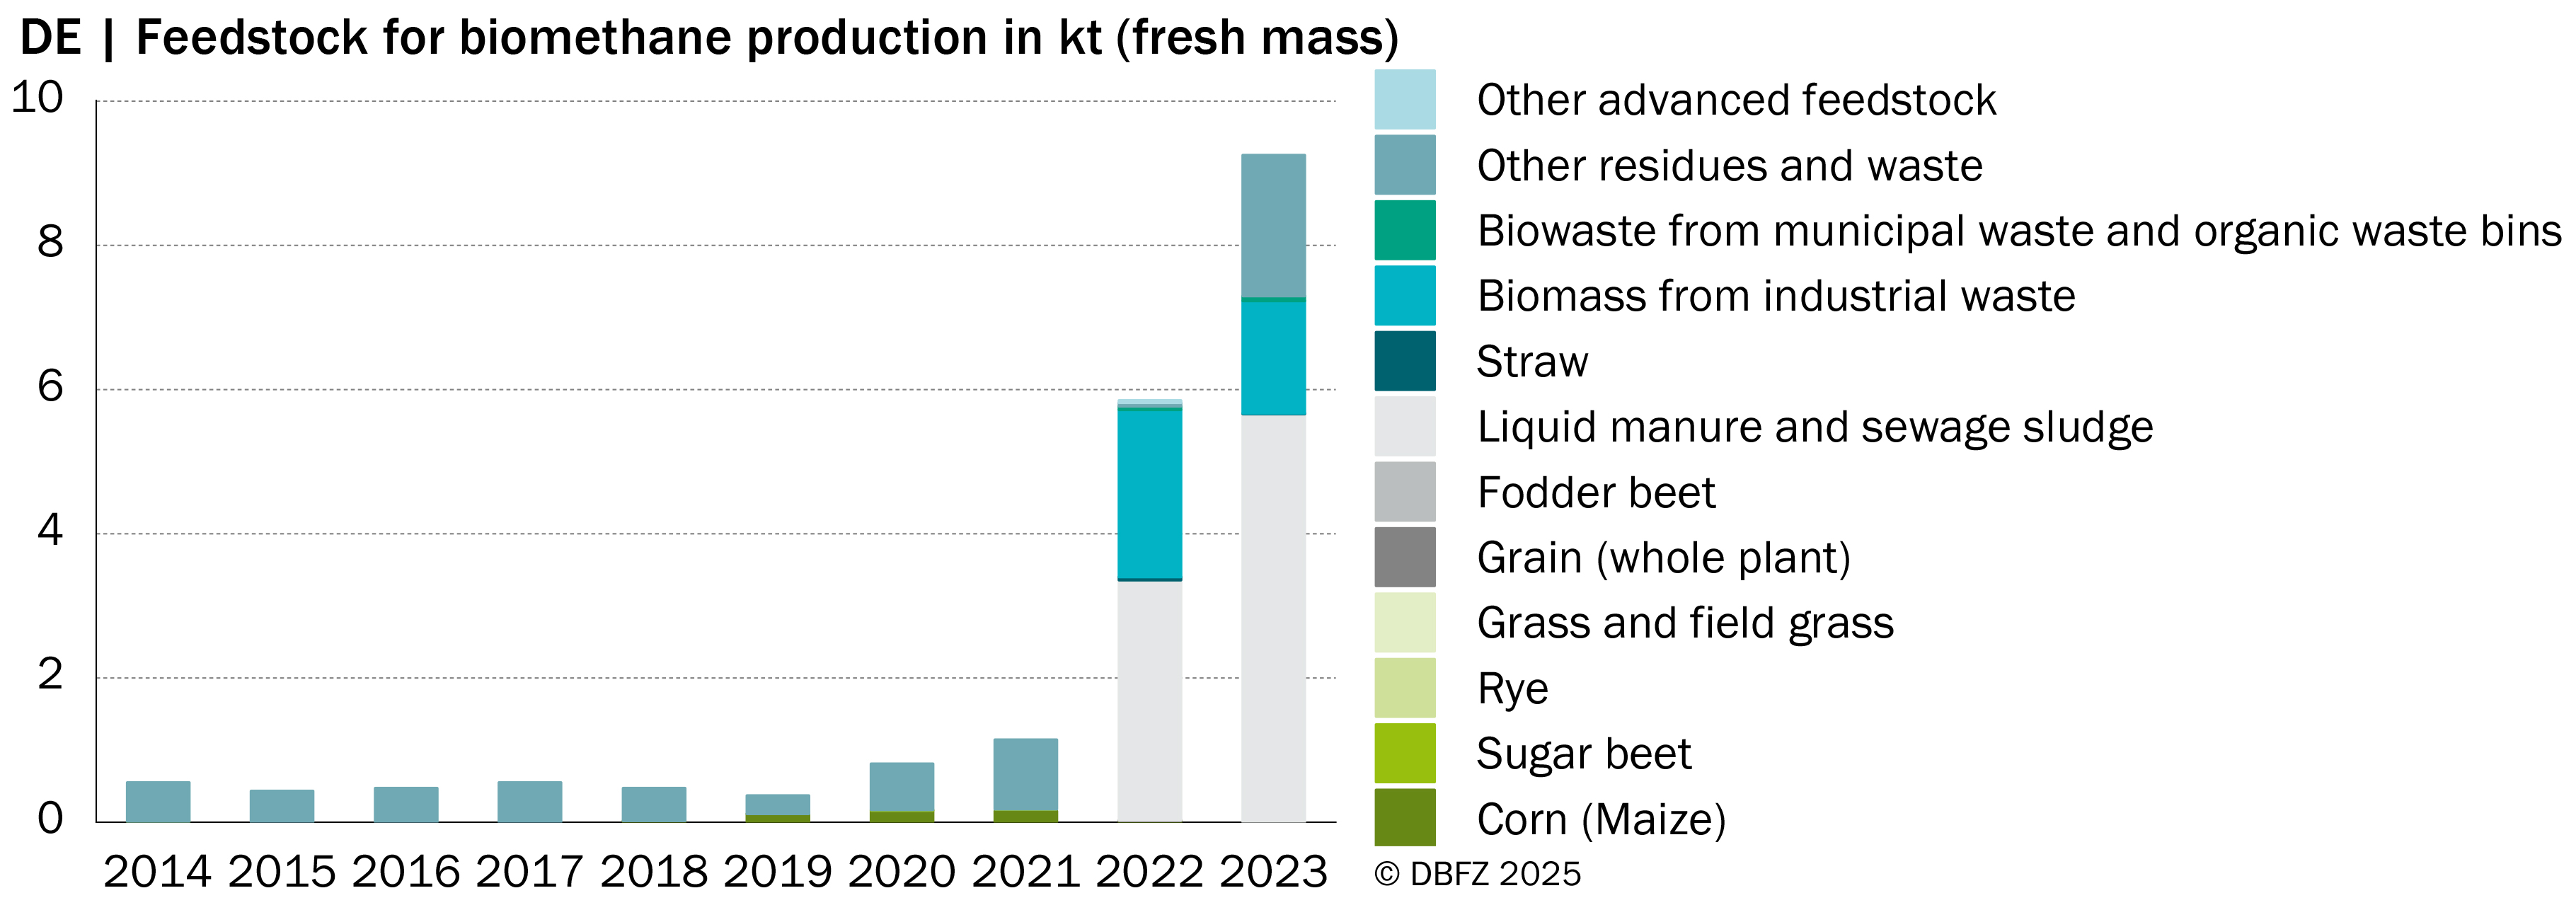
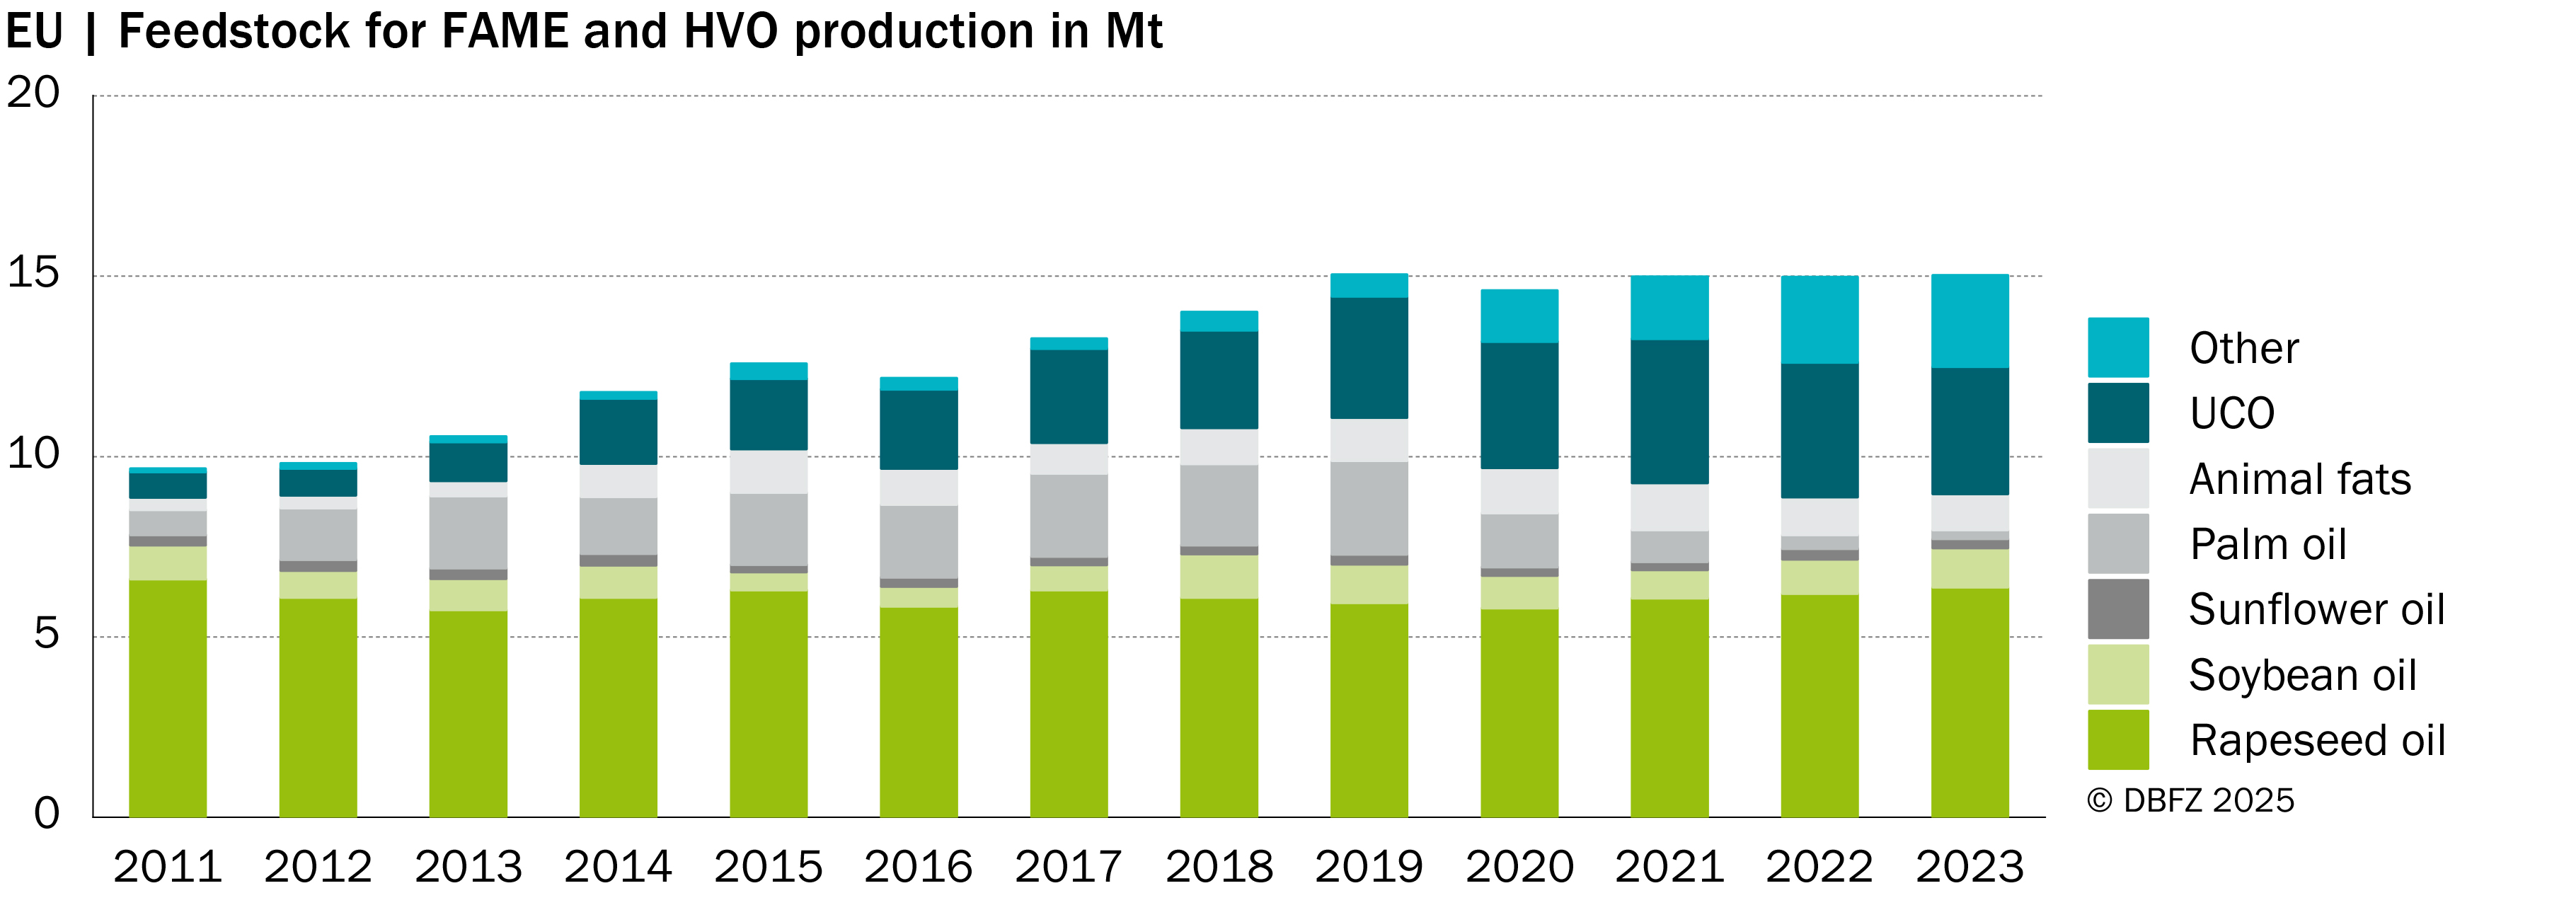
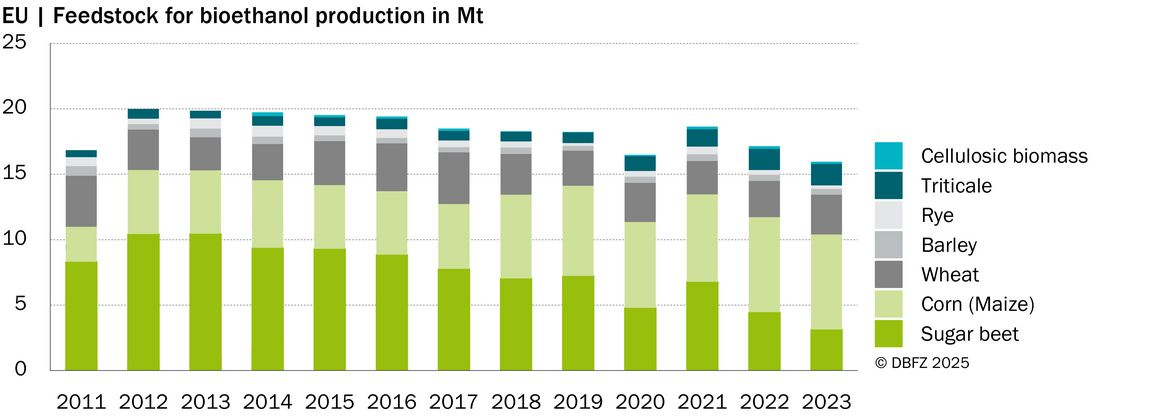
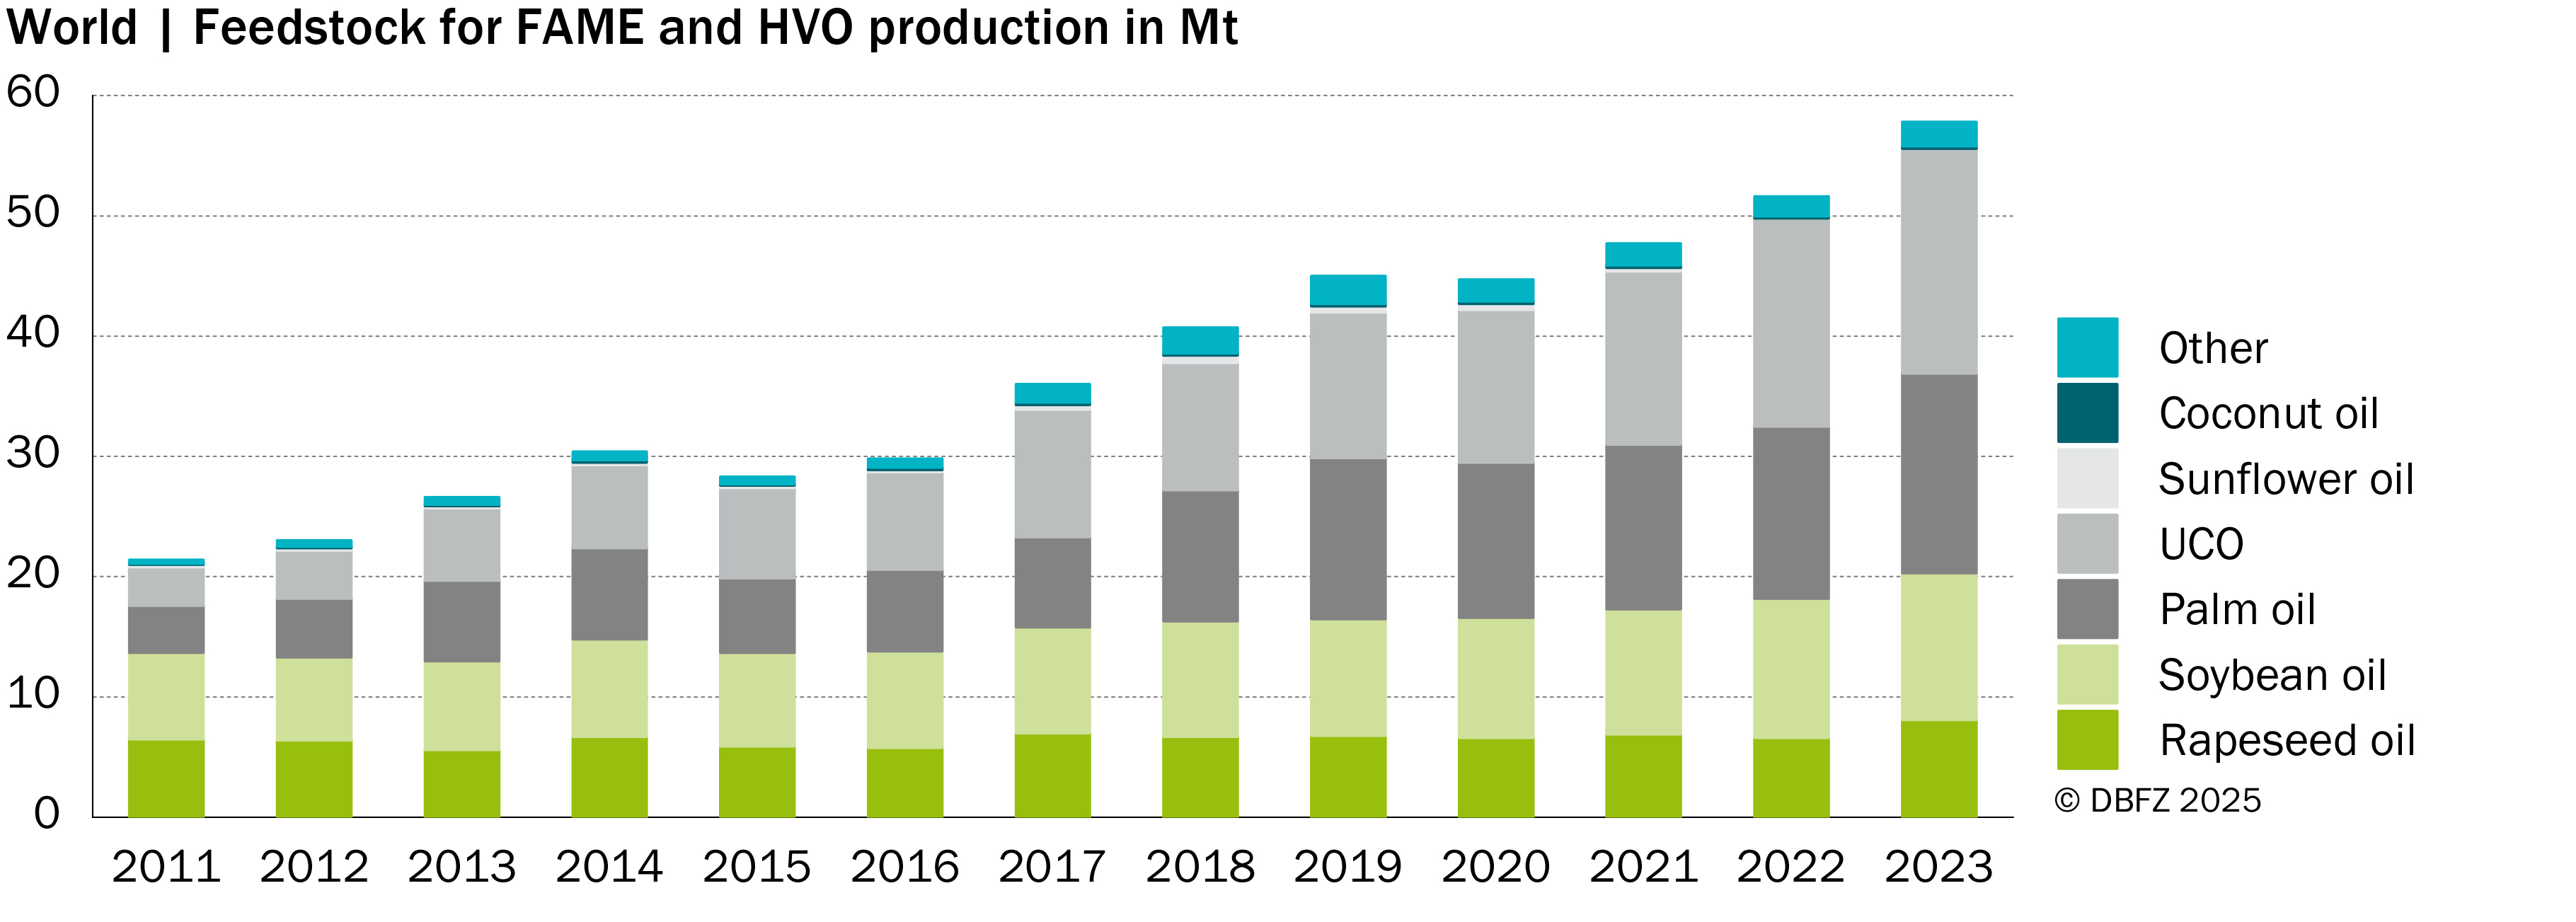
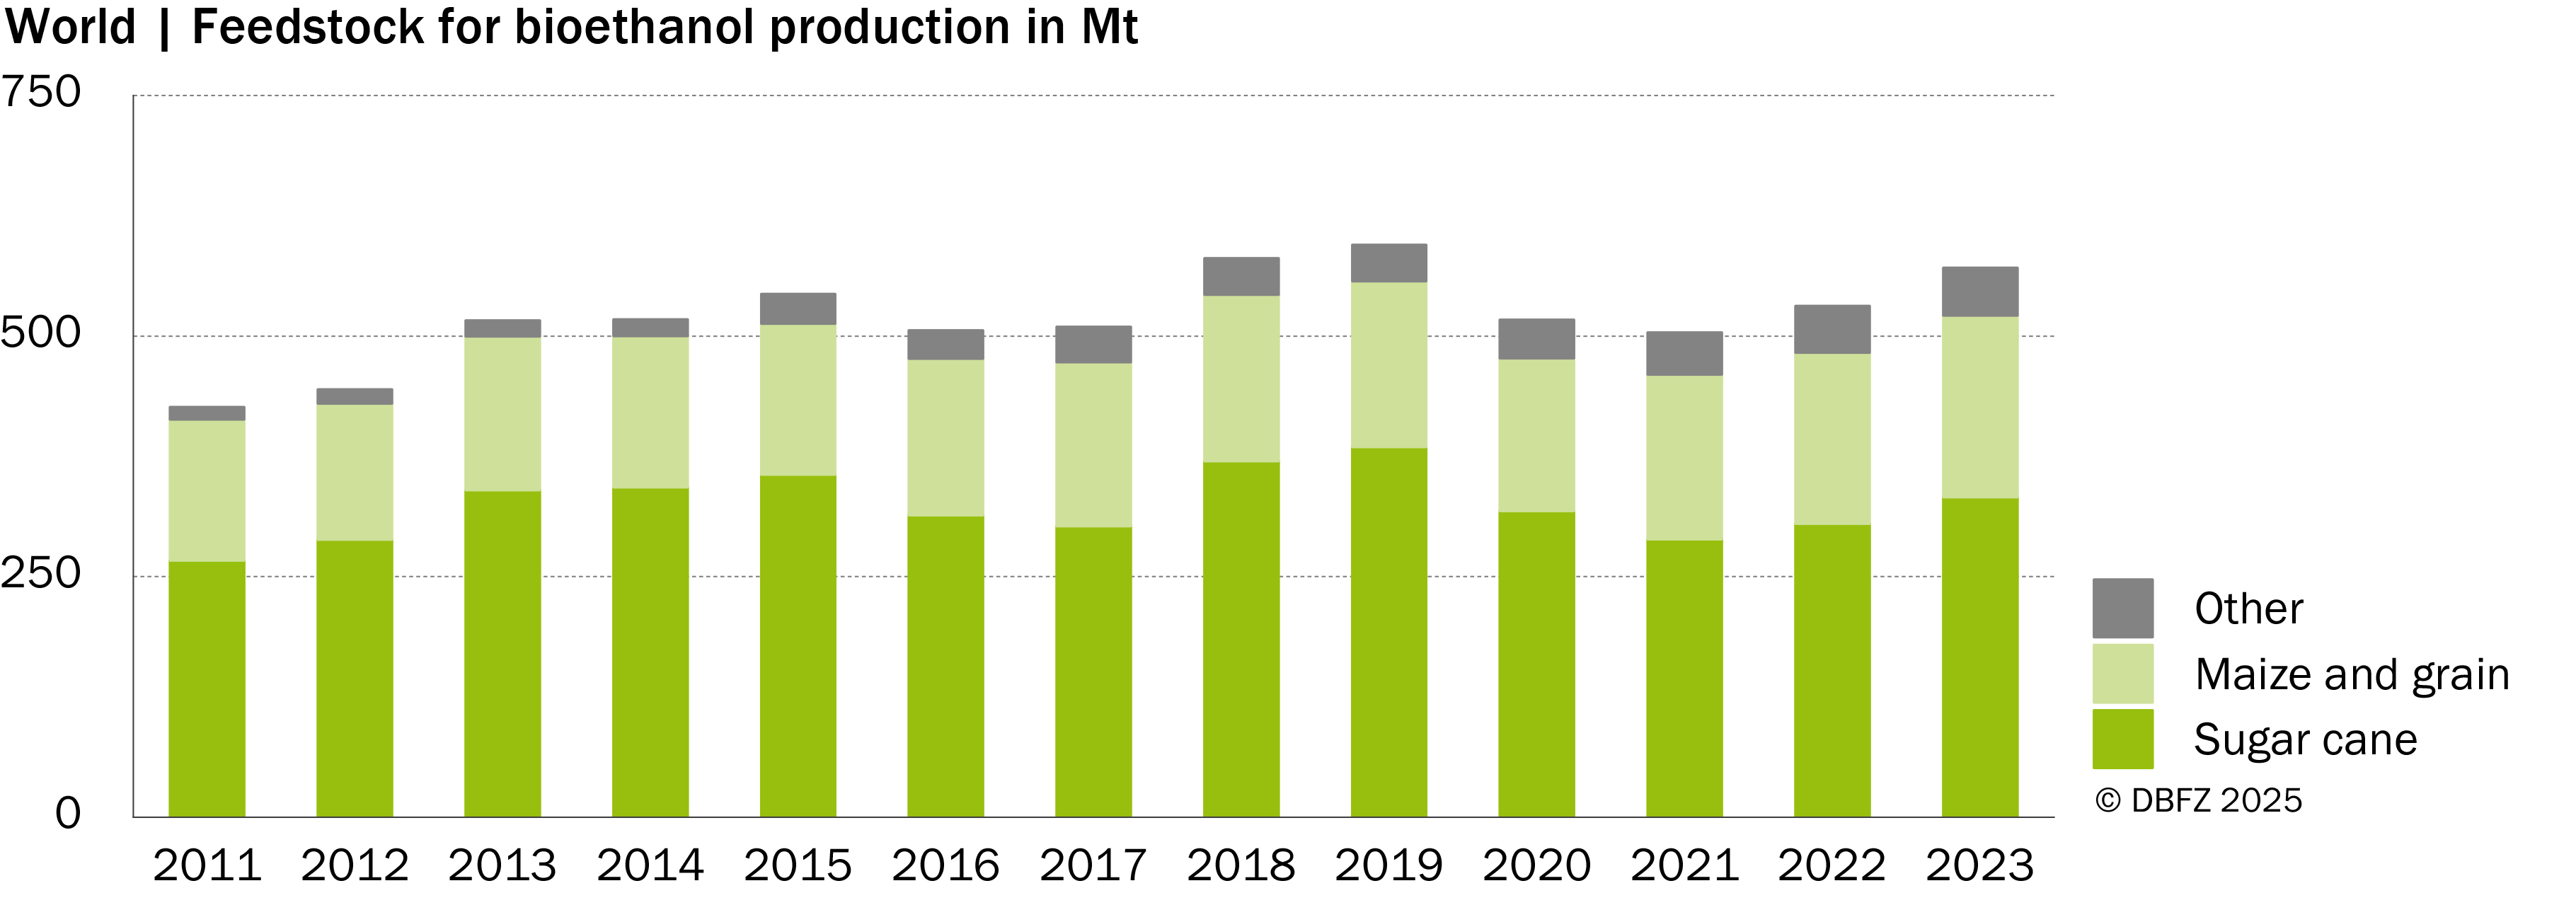
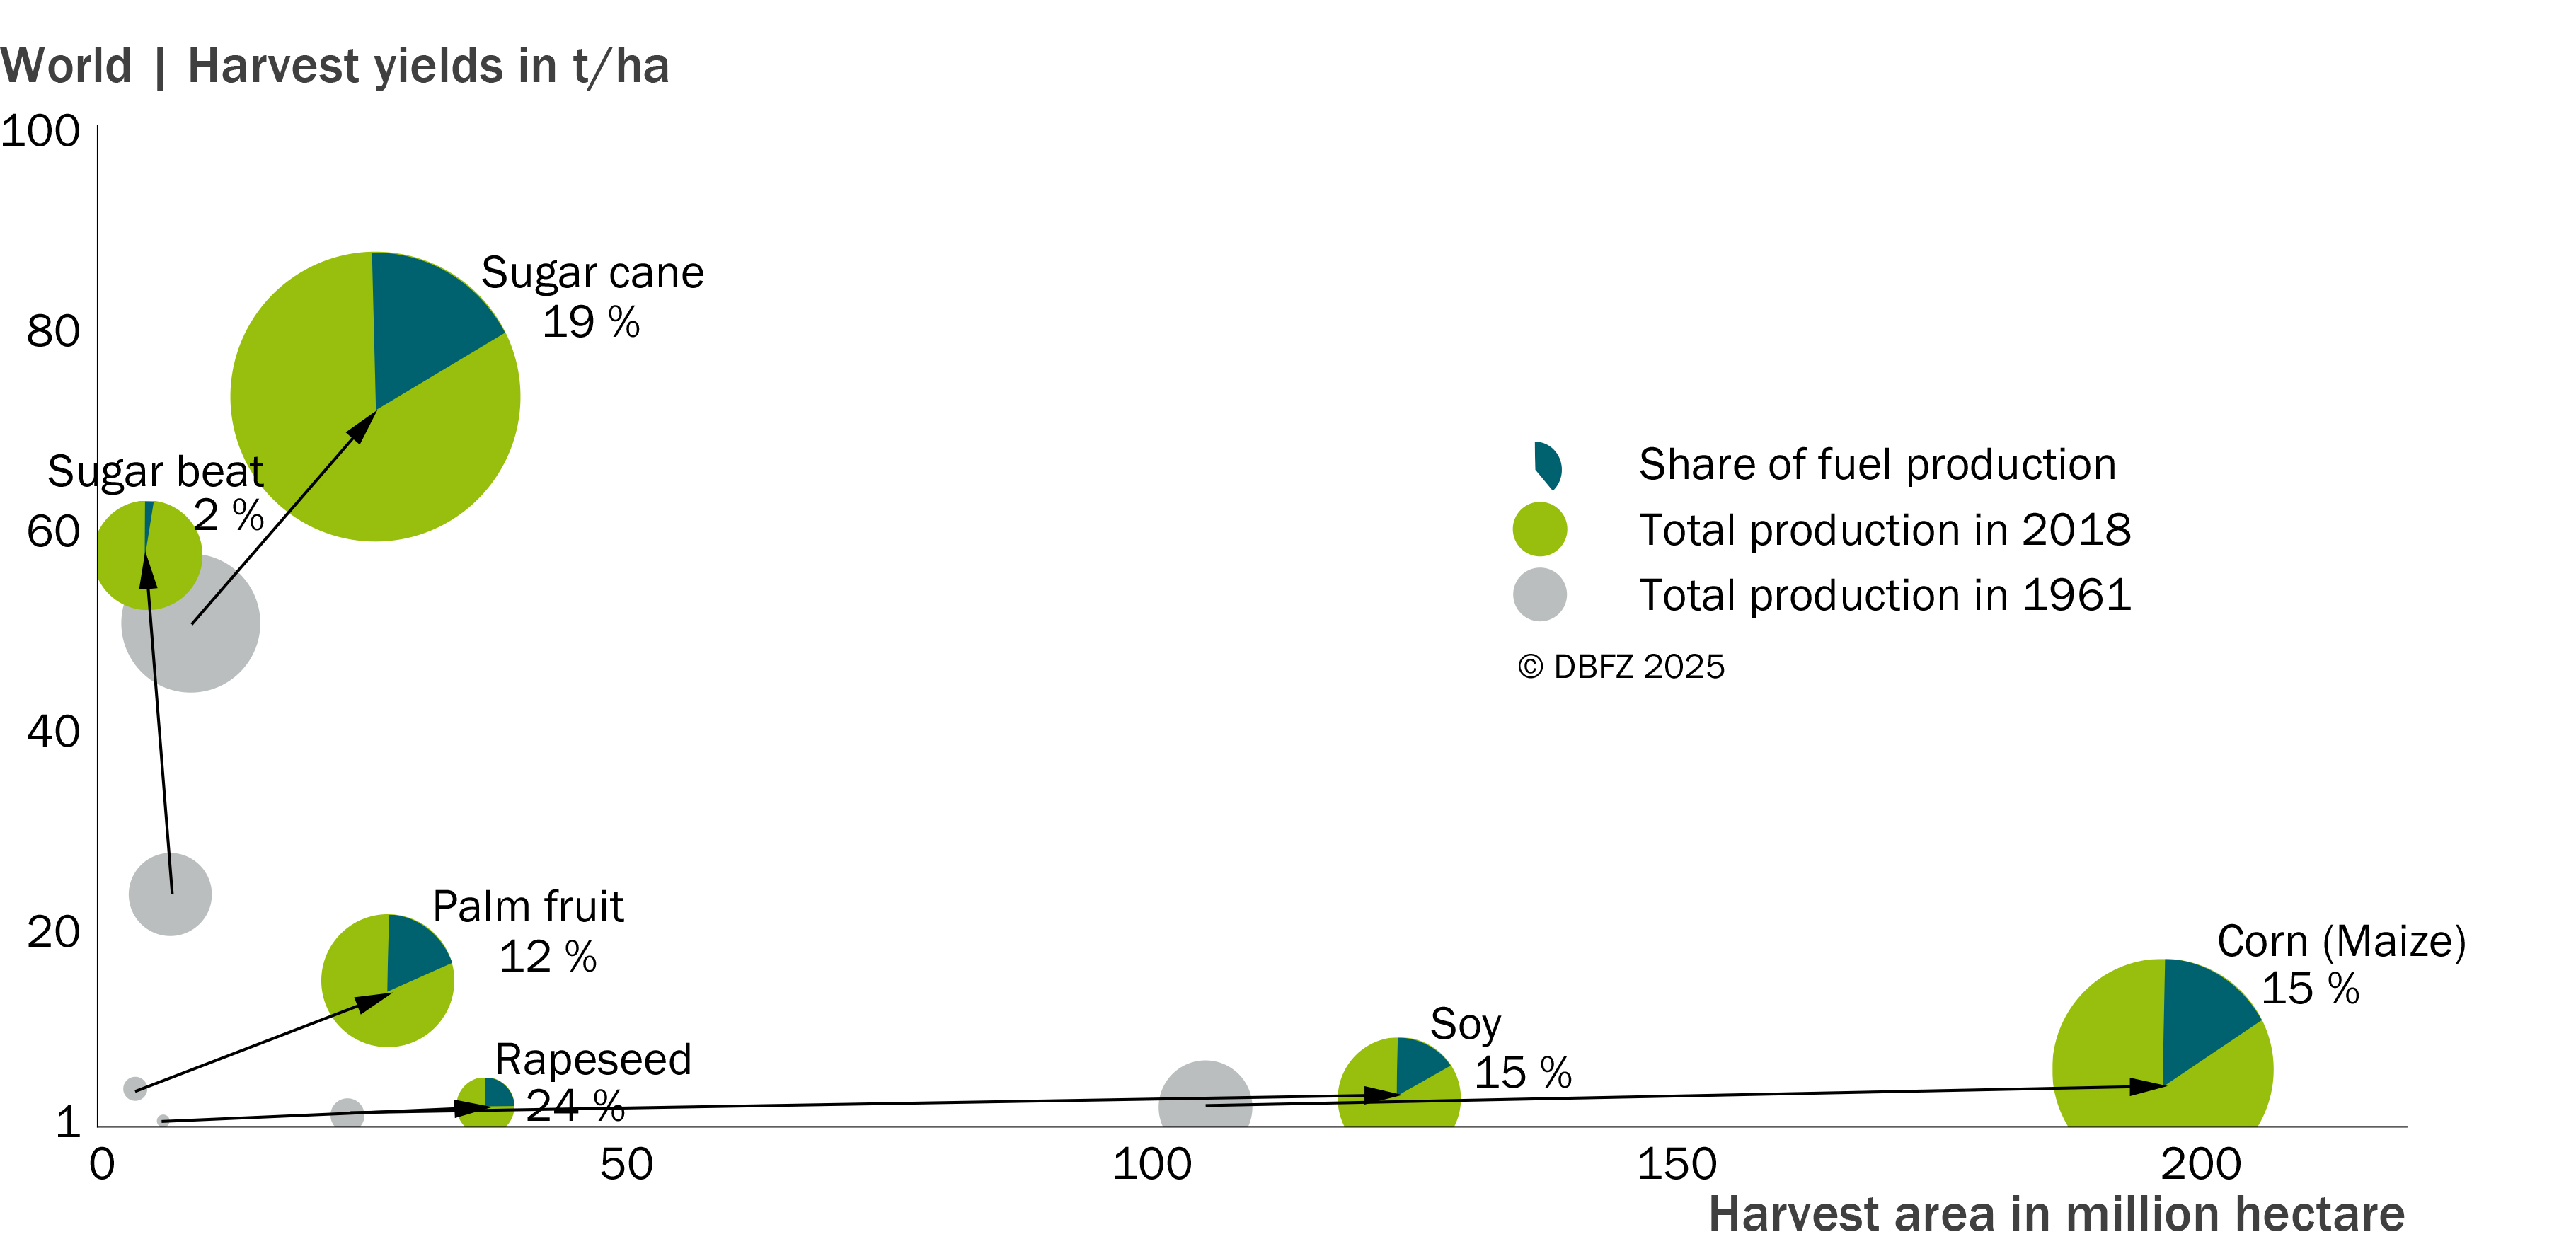
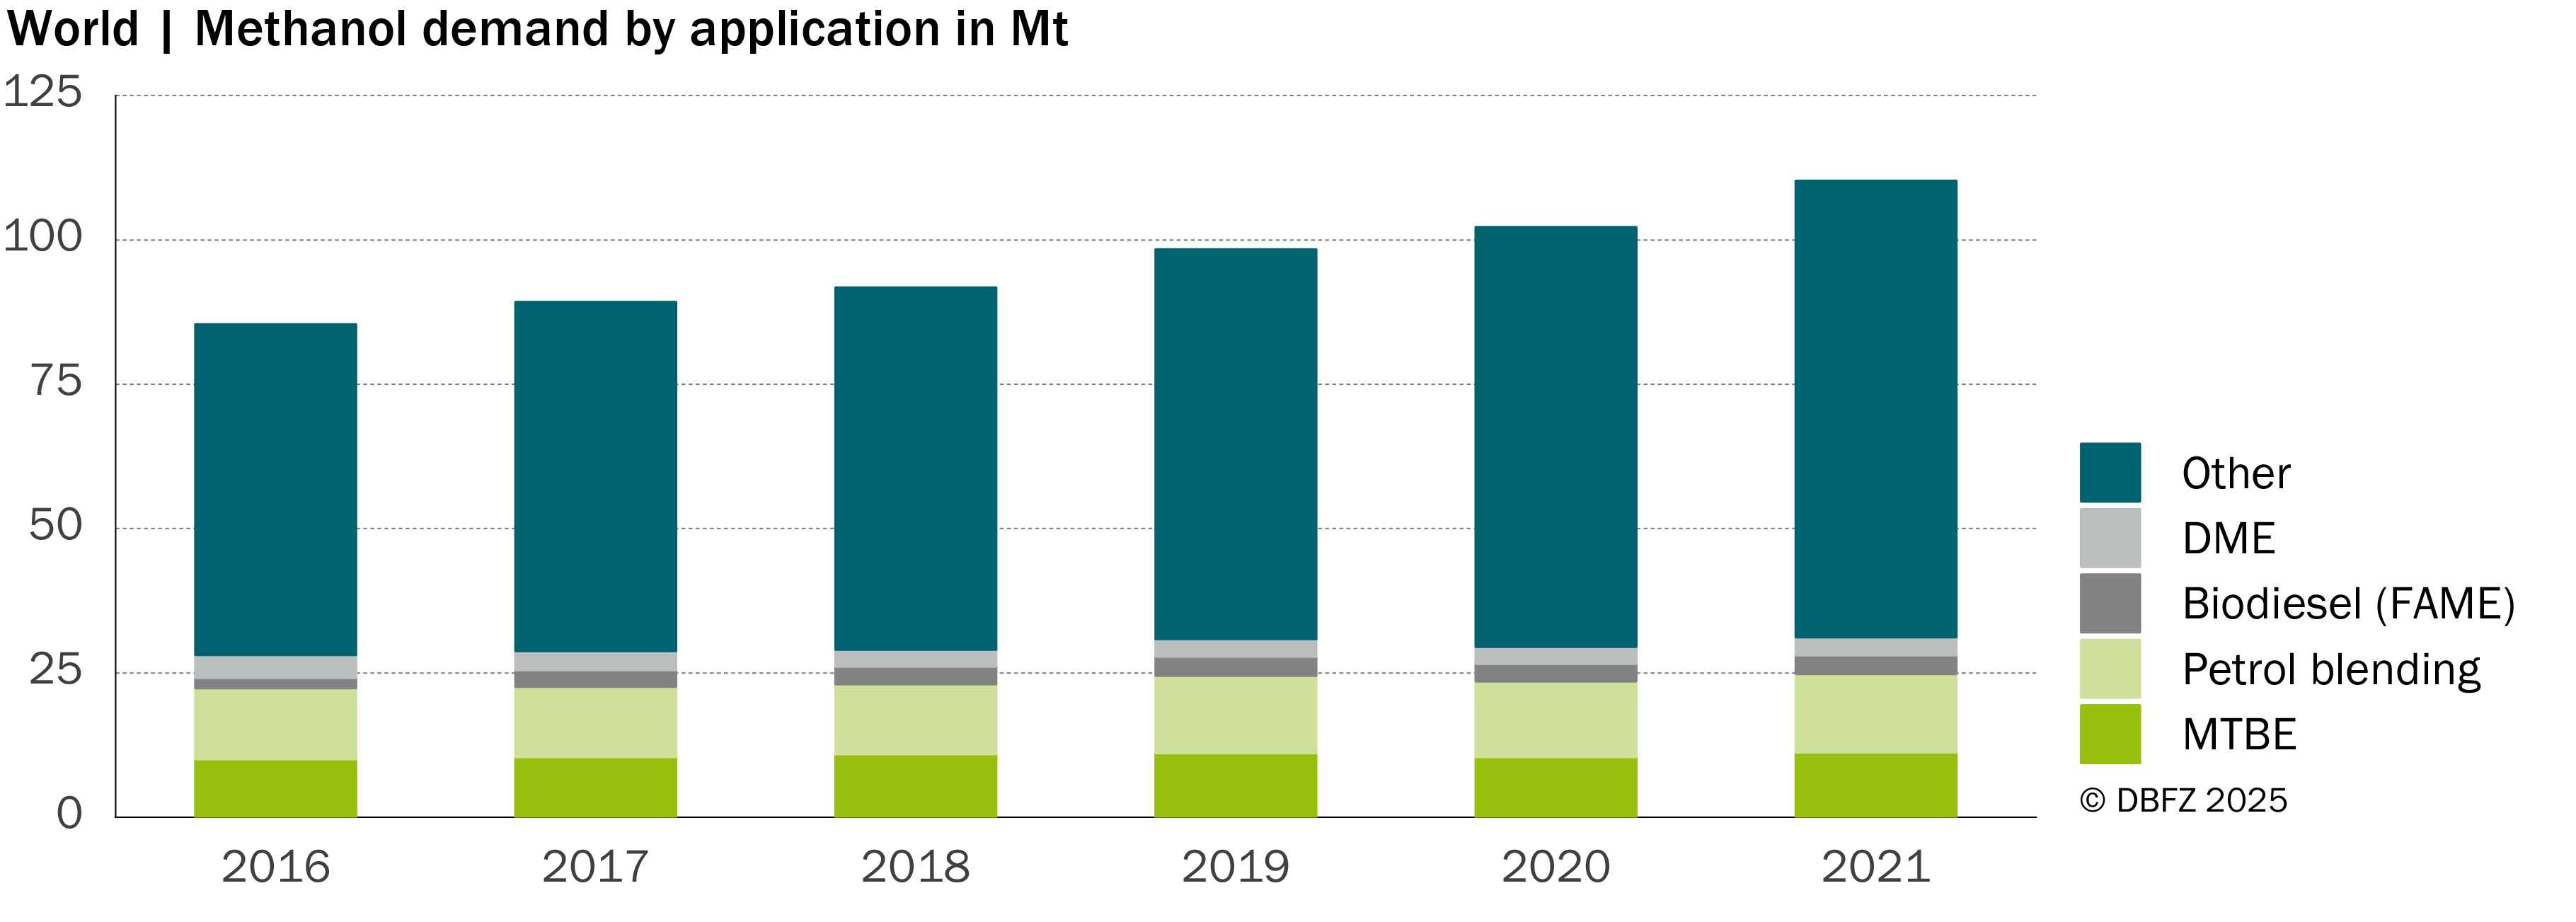
Chapter 5: Resources and their mobilisation
When using the illustrations in Chapter 1, please cite them as follows:
Naumann, K.; Cyffka, K.-F.; Costa de Paiva, G.; Nieß, S.; Neuling, U.; Zitscher, T. (2026): Resources and their mobilisation. In: Schröder, J.; Görsch, K. (eds.): Renewable Energies in Transport. Monitoring Report. pp. 77-100. Leipzig: DBFZ. ISBN: 978-3-949807-36-7. DOI: 10.48480/45hp-x131


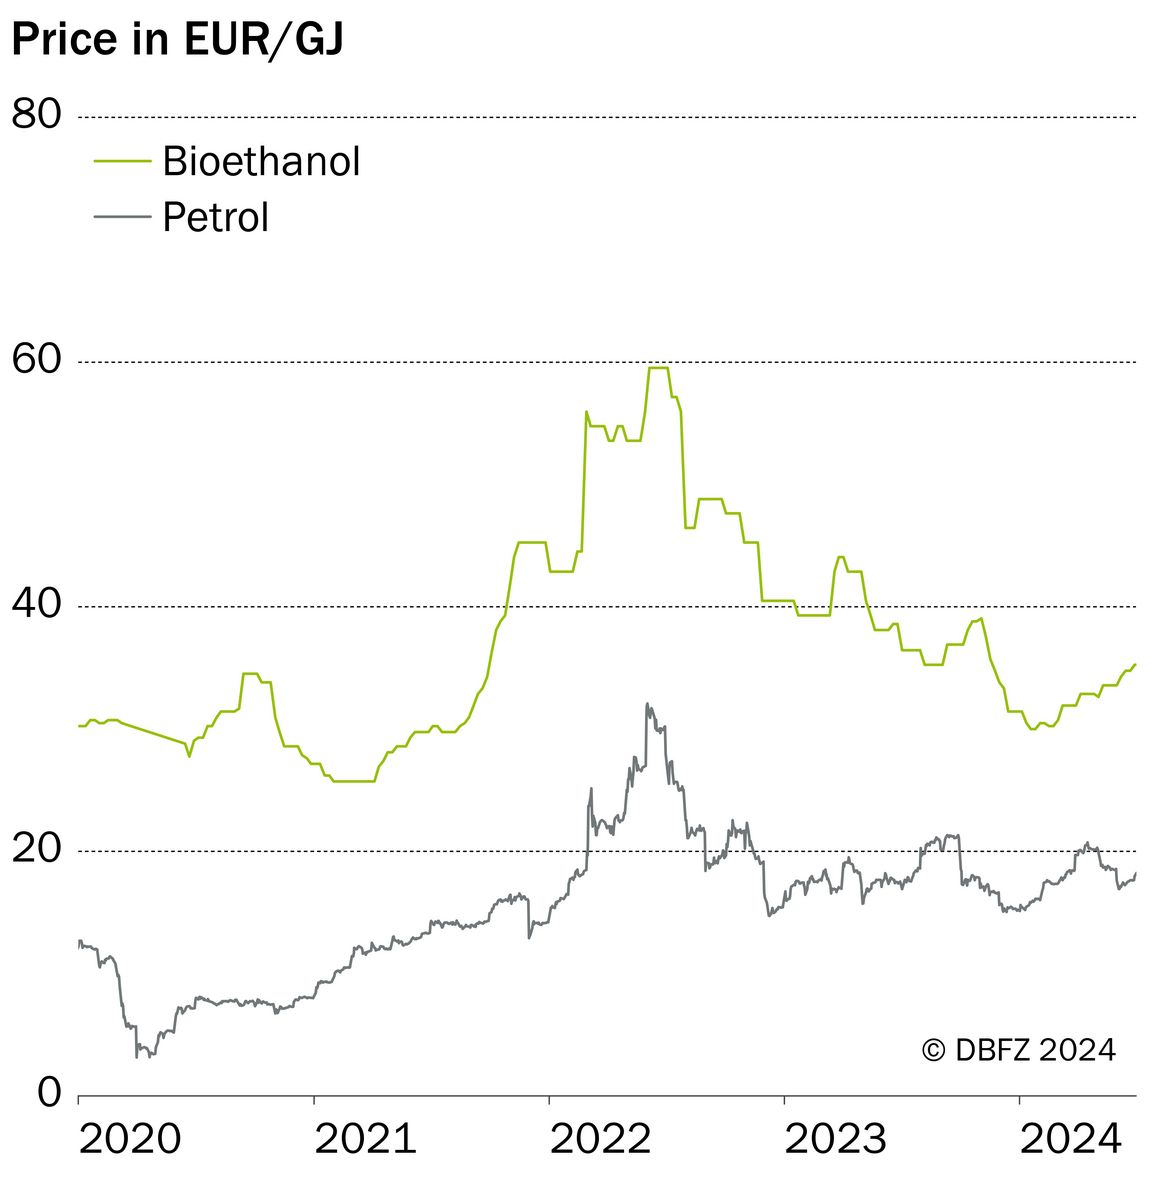
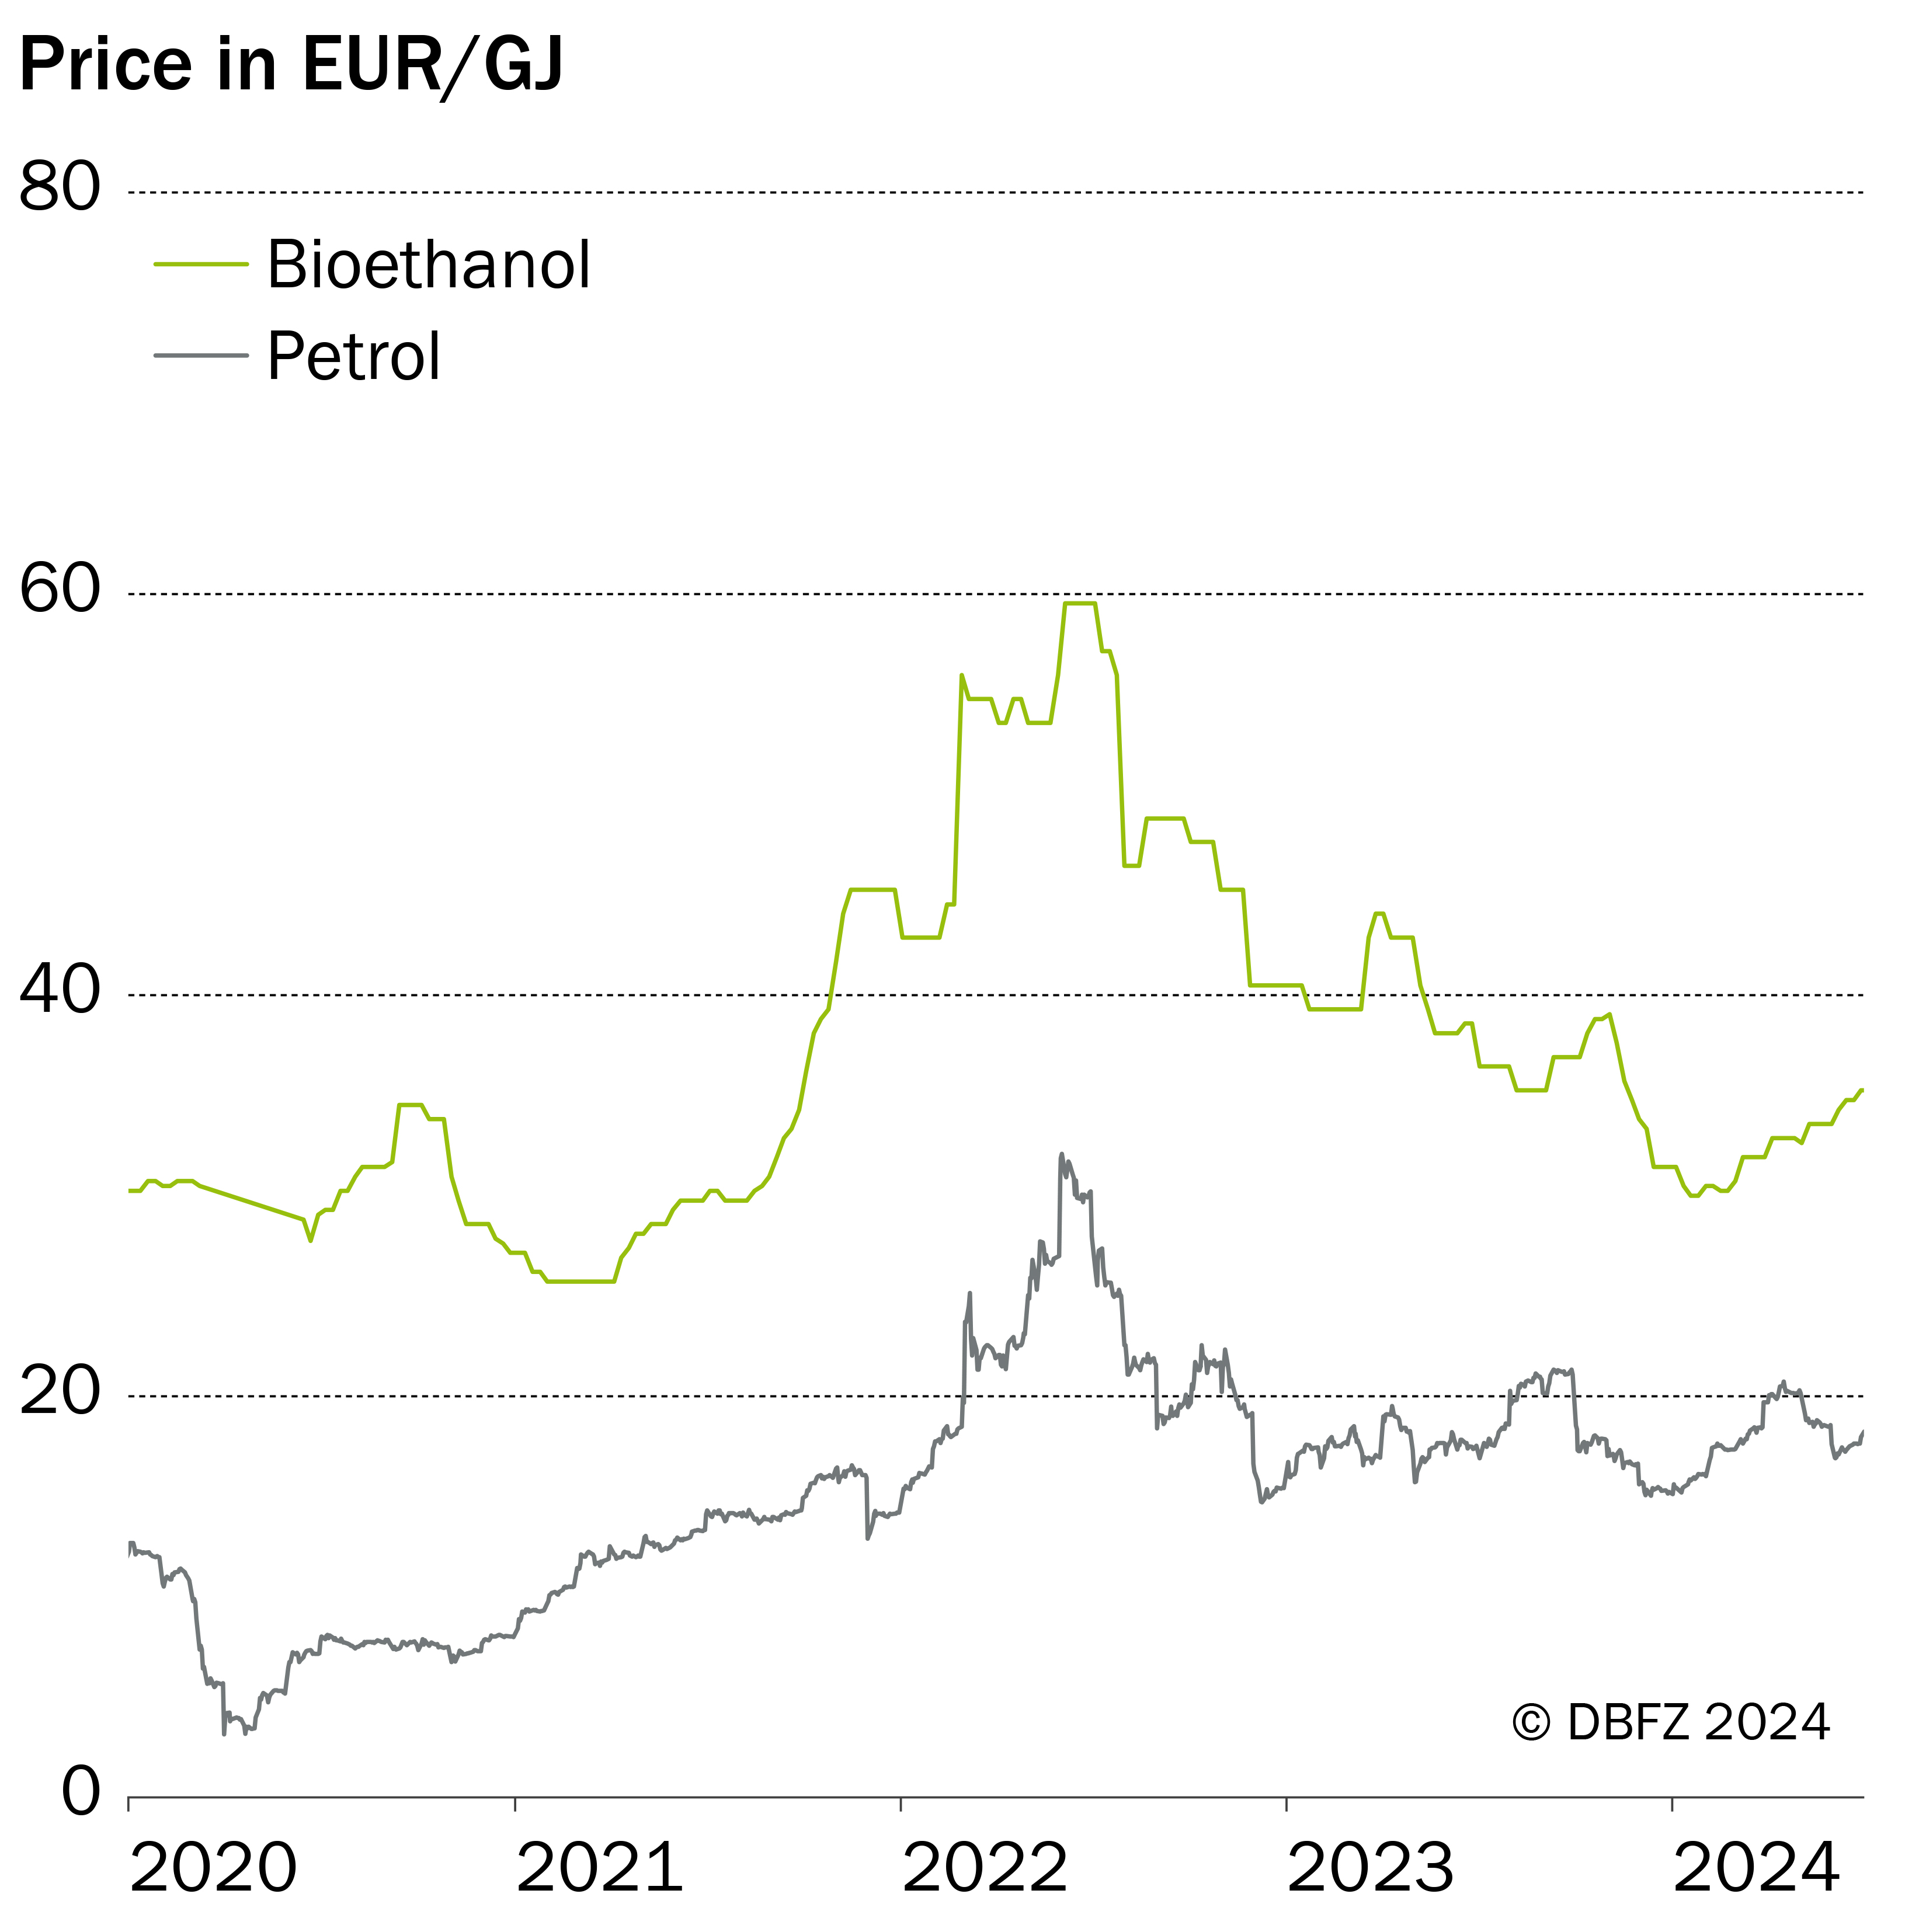
Chapter 6: Market indicators
When using the illustrations in Chapter 6, please cite them as follows:
Schröder, J.; Görsch, K.; Naumann, K.; Costa de Paiva, G. (2026): Market indicators. In: Schröder, J.; Görsch, K. (eds.): Renewable Energies in Transport. Monitoring Report. pp. 101-112. Leipzig: DBFZ. ISBN: 978-3-949807-36-7. DOI: 10.48480/45hp-x131


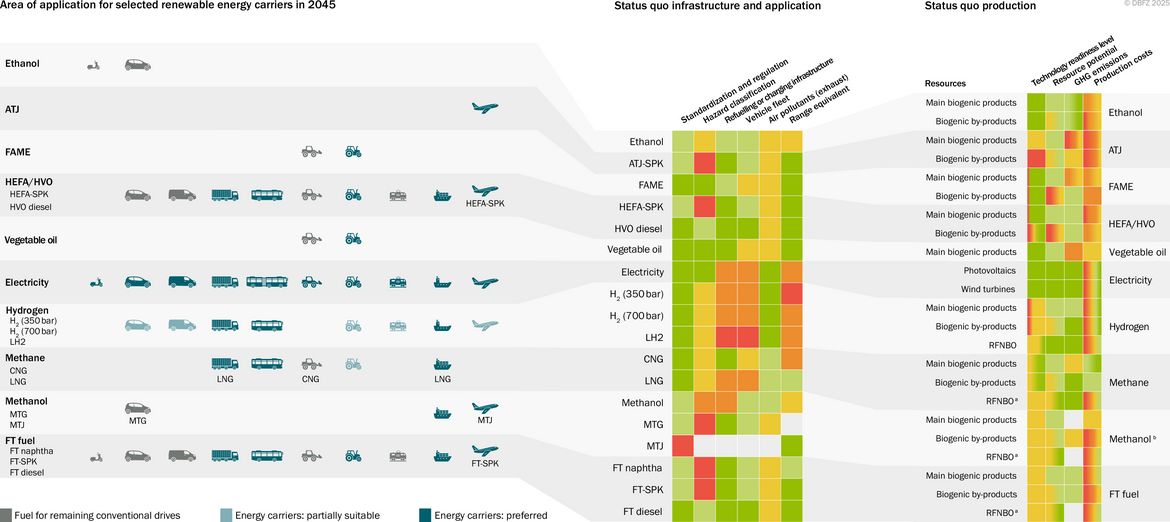
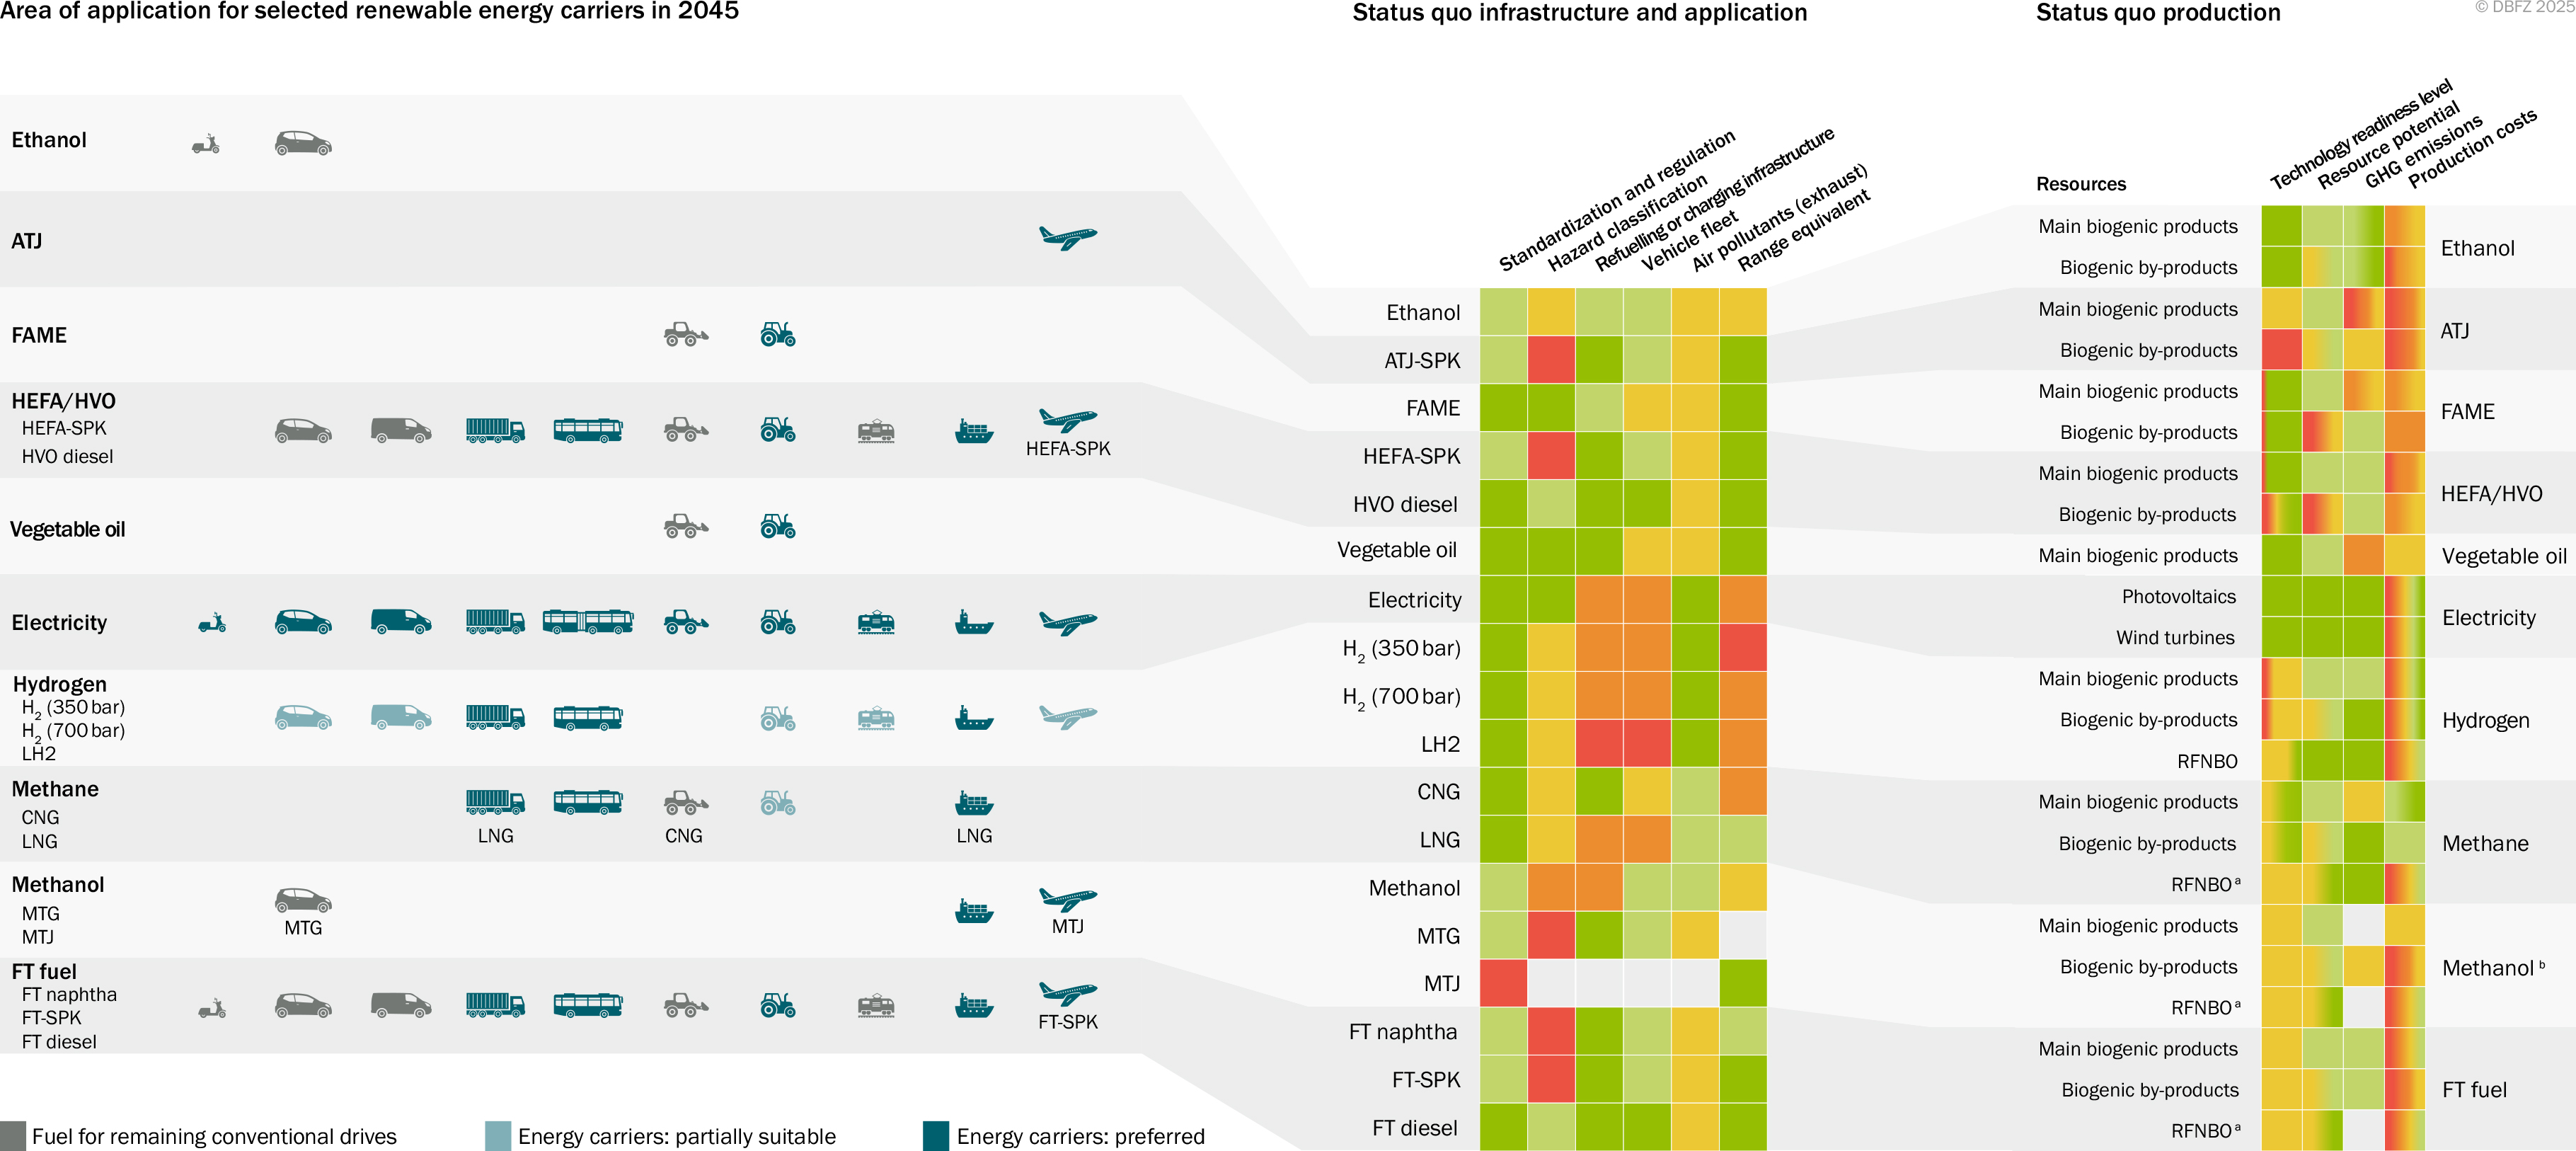
Chapter 7: Application
When using the illustrations in Chapter 7, please cite them as follows:
Schröder, J.; Görsch, K.; Remmele, E.; Emberger, P.; Thuneke, K. (2026): Application. In: Schröder, J.; Görsch, K. (eds.): Renewable Energies in Transport. Monitoring Report. pp. 113-130. Leipzig: DBFZ. ISBN: 978-3-949807-36-7. DOI: 10.48480/45hp-x131


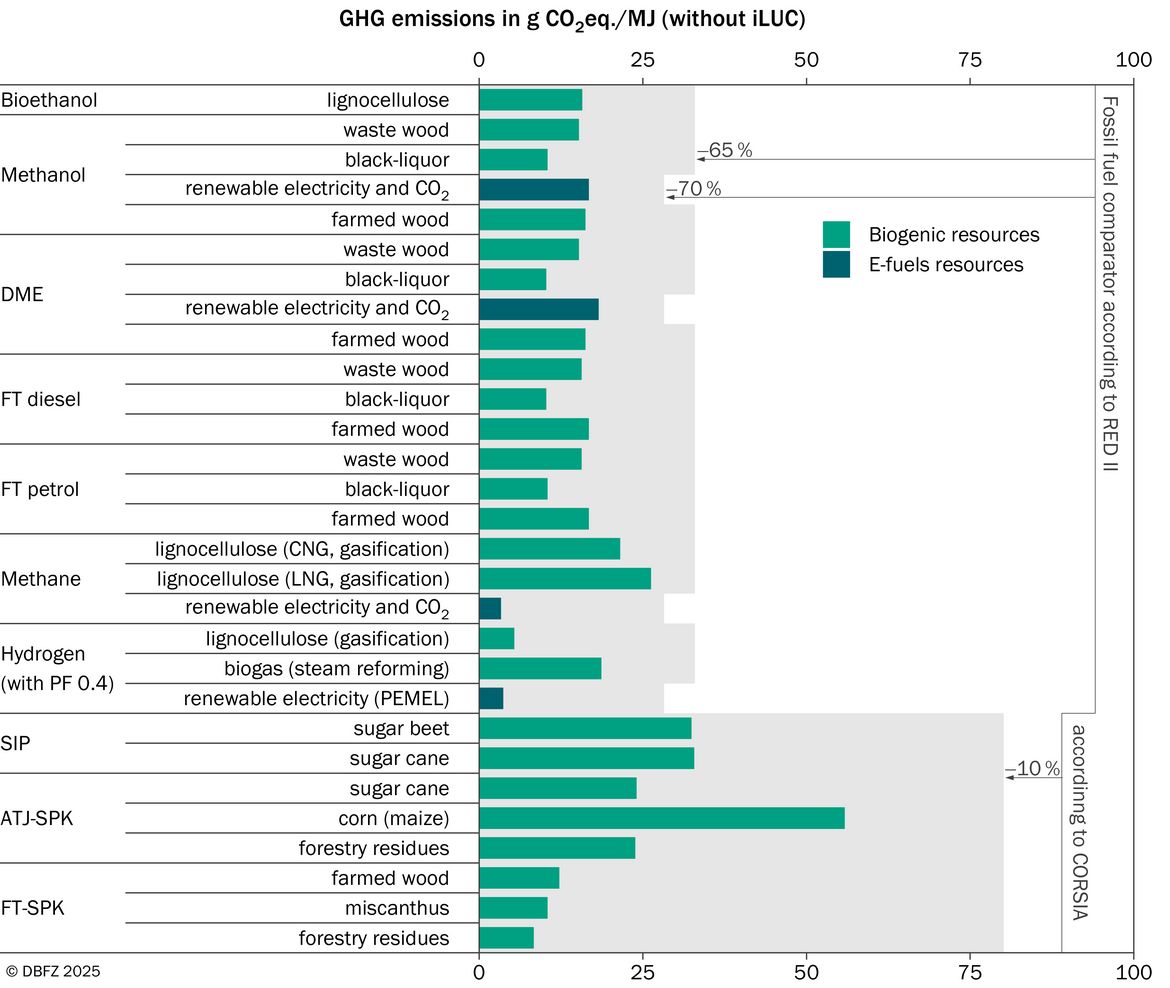
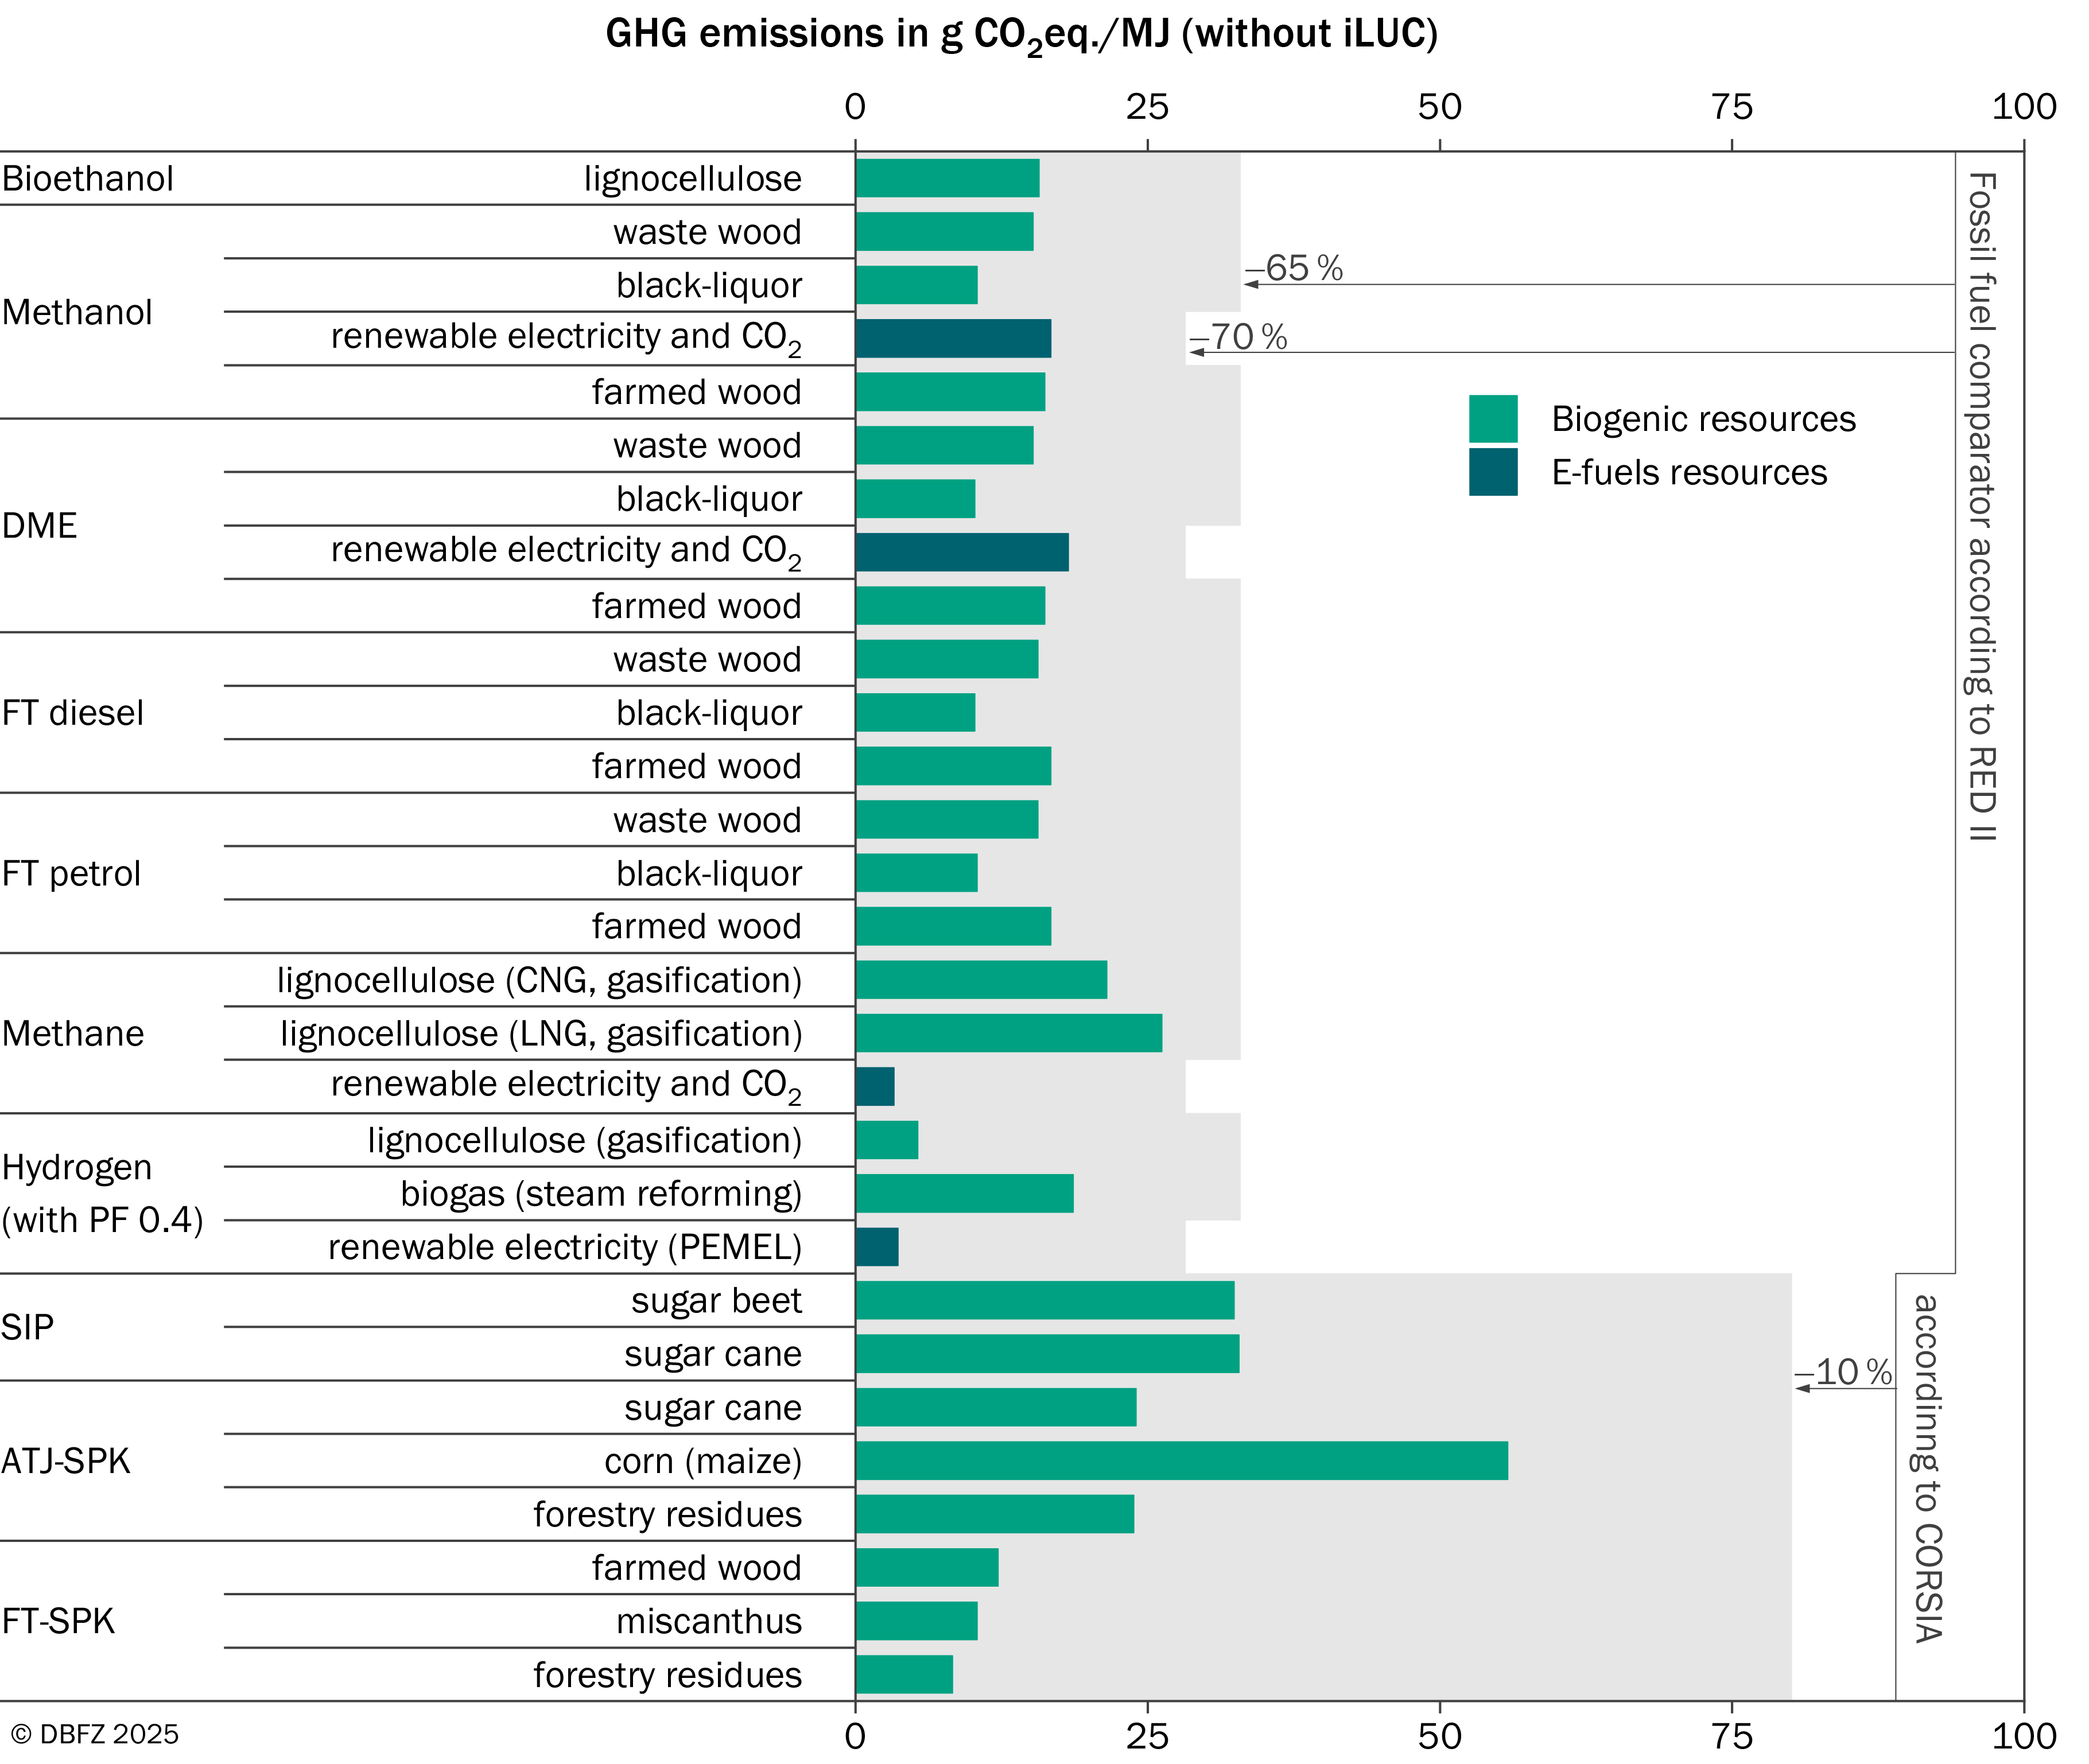
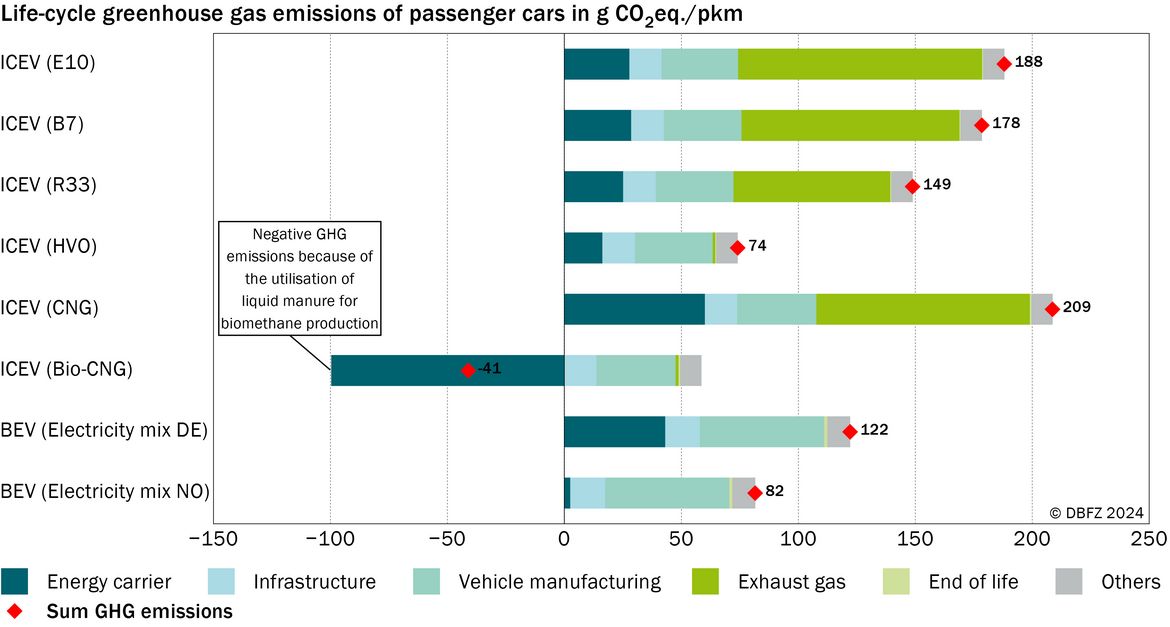
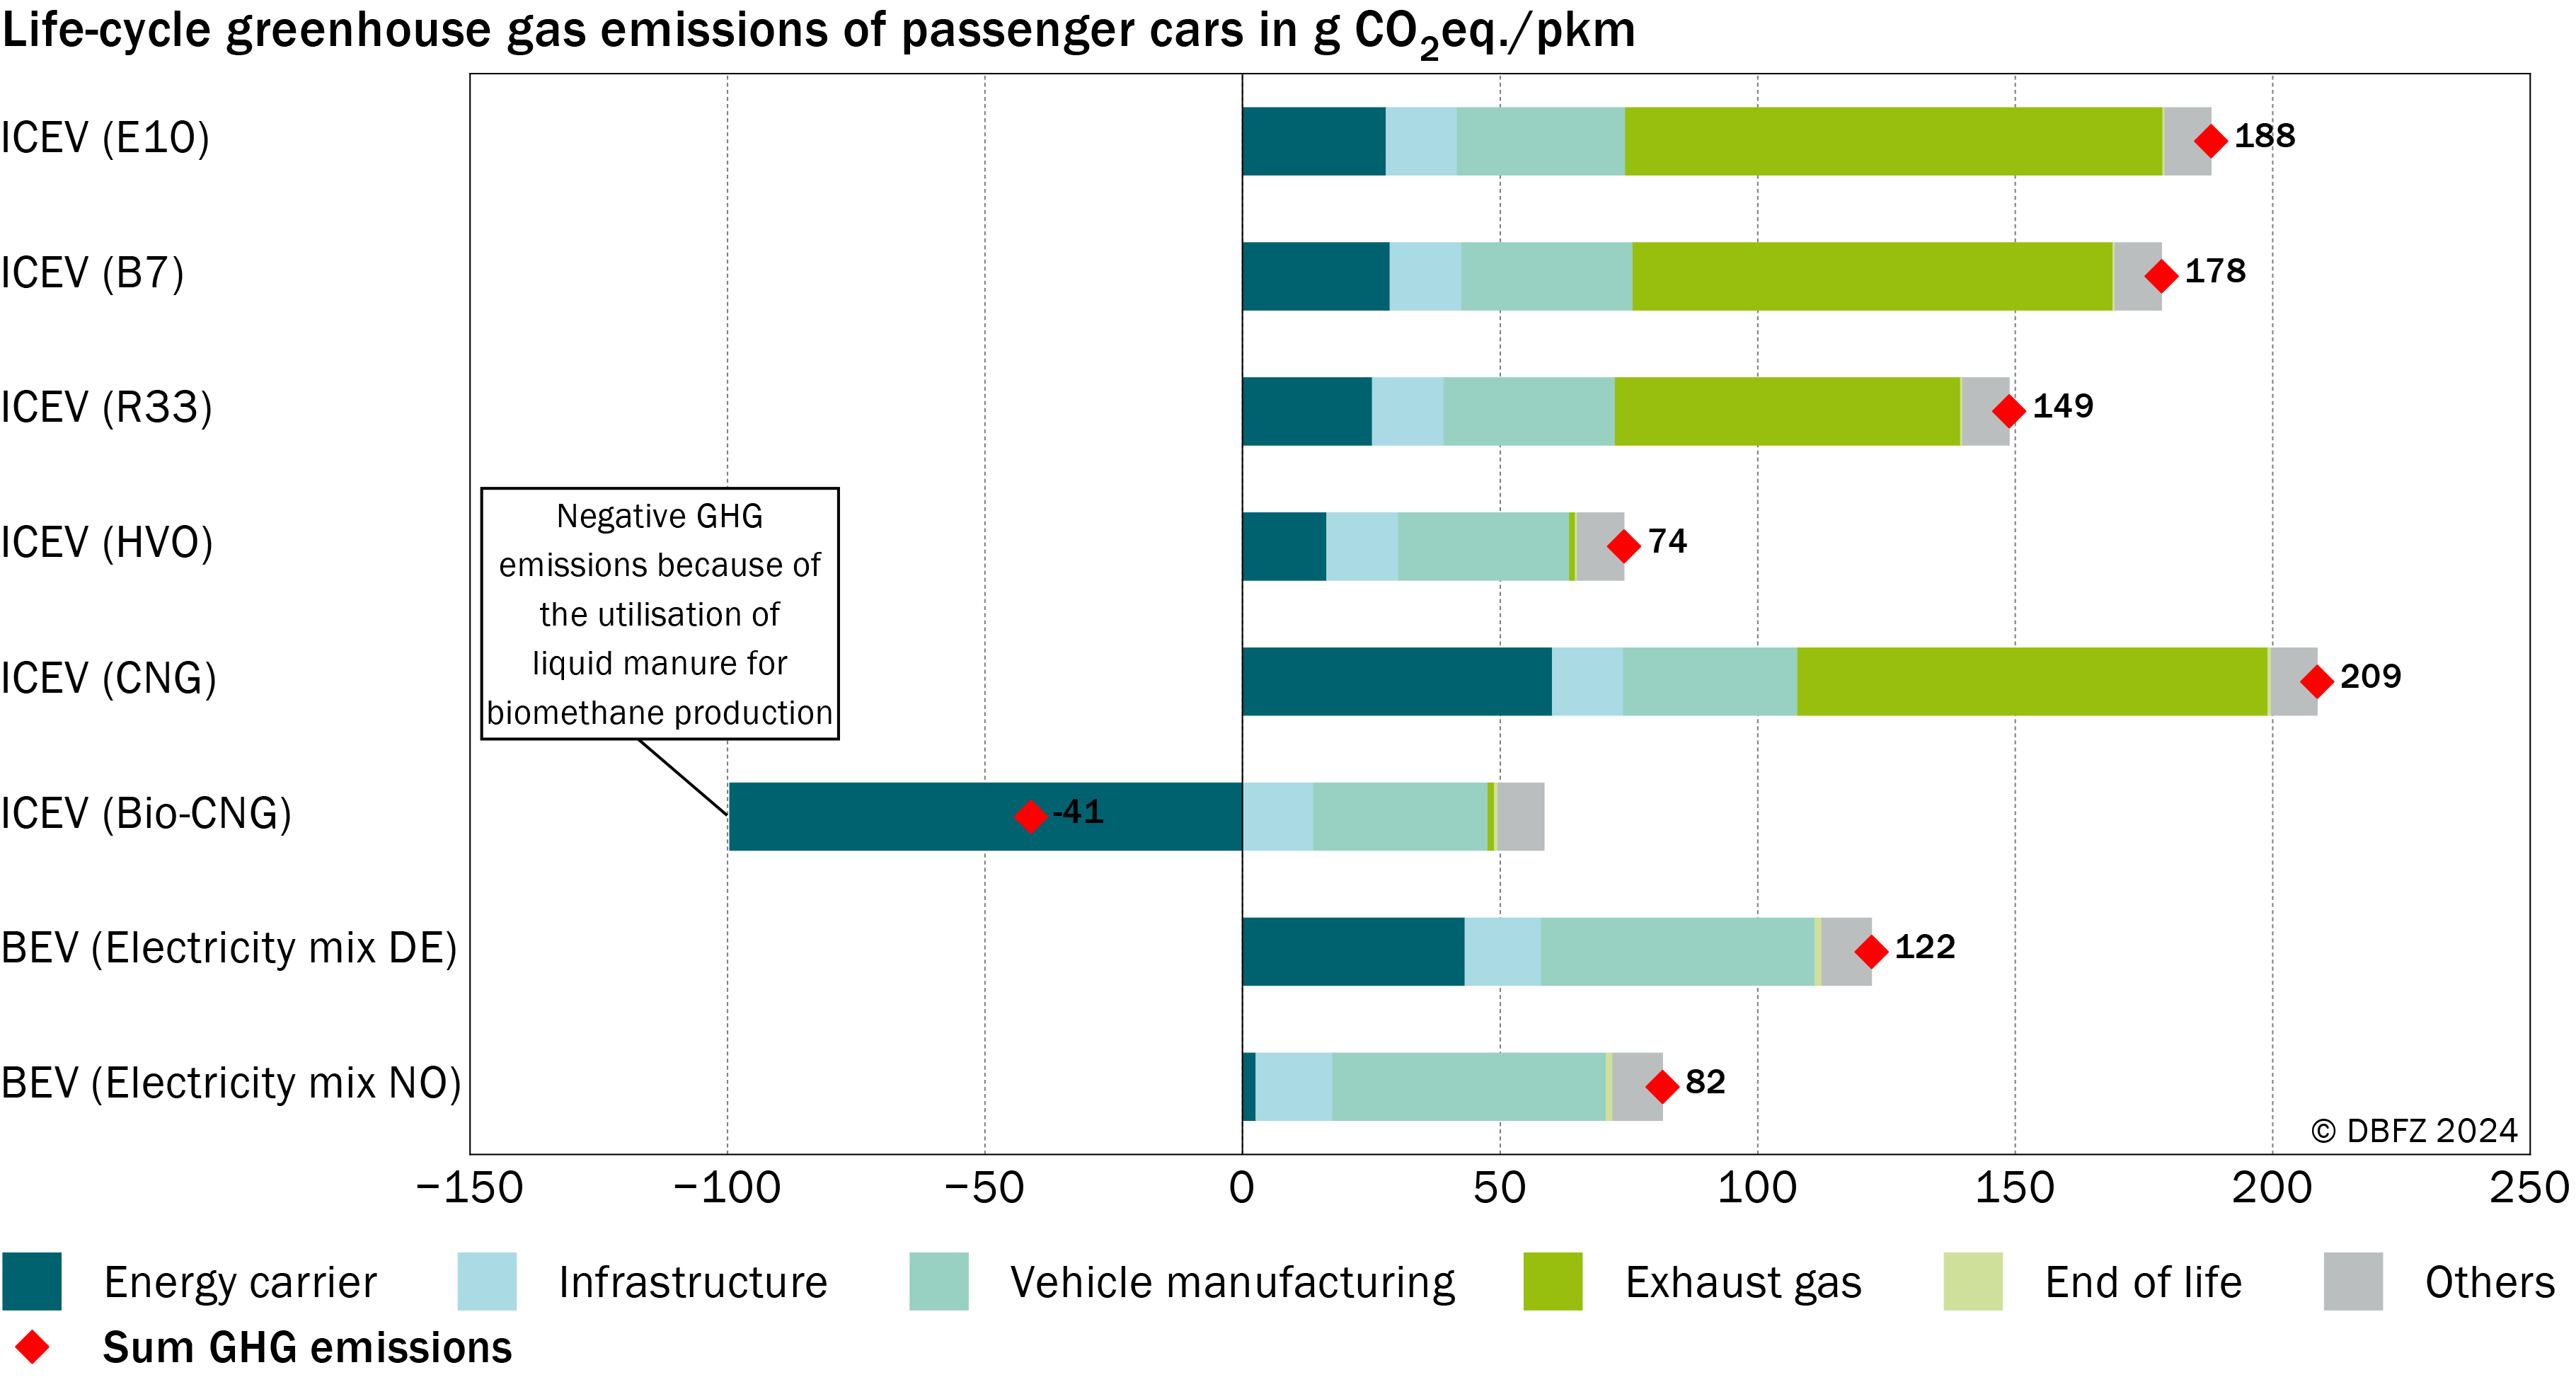
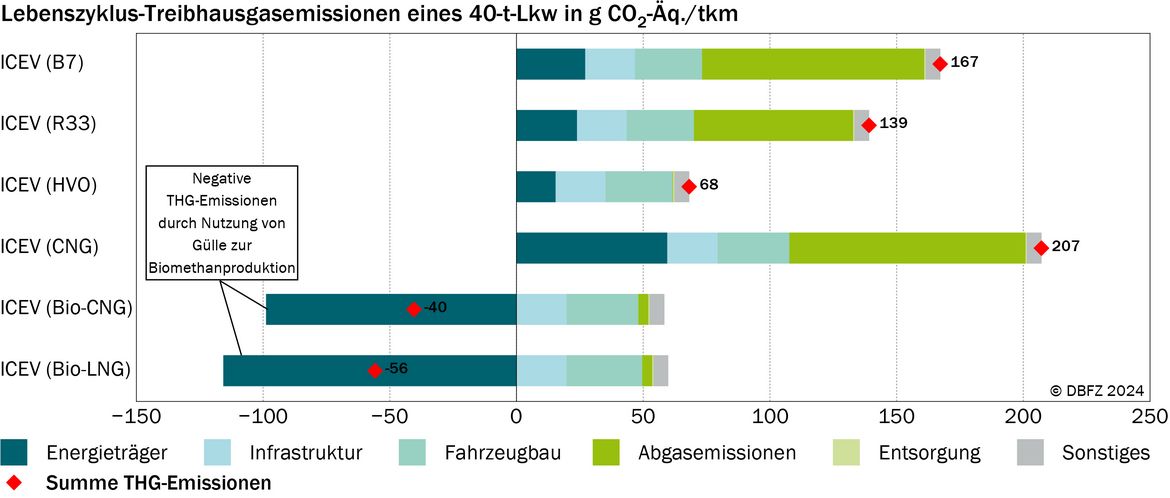
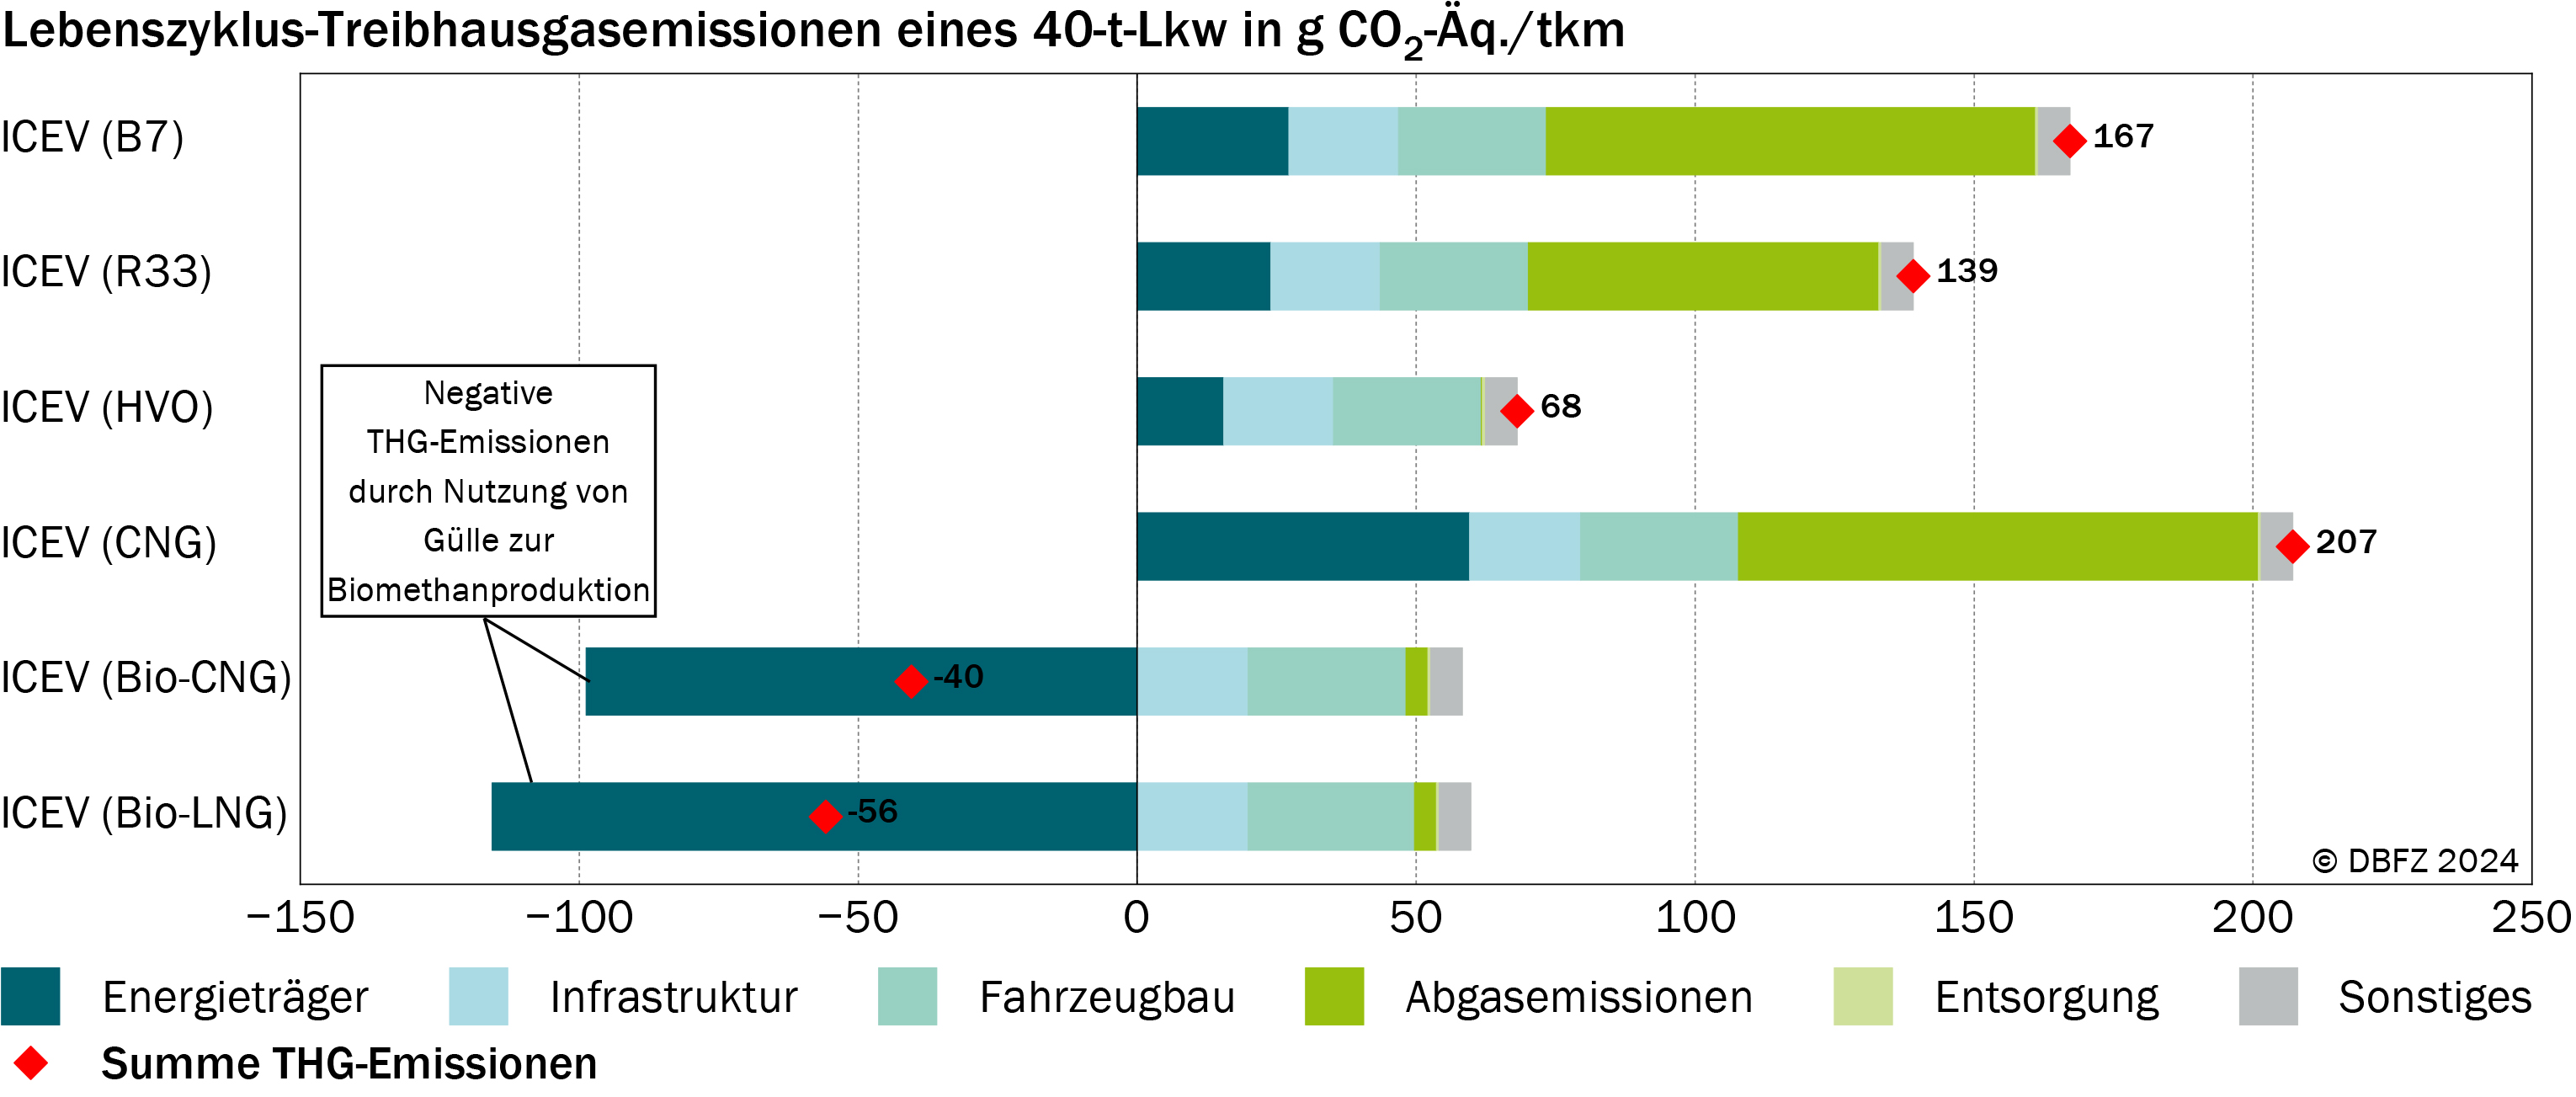
Chapter 8: Environmental assessment
When using the illustrations in Chapter 8, please cite them as follows:
Götz, I. K.; Meisel K.; Schröder, J.; Remmele, E.; Thuneke, K.; Bauer, C.; Sacchi, R. (2026): Environmental assessment. In: Schröder, J.; Görsch, K. (eds.): Renewable Energies in Transport. Monitoring Report. pp. 131-142. Leipzig: DBFZ. ISBN: 978-3-949807-36-7. DOI: 10.48480/45hp-x131


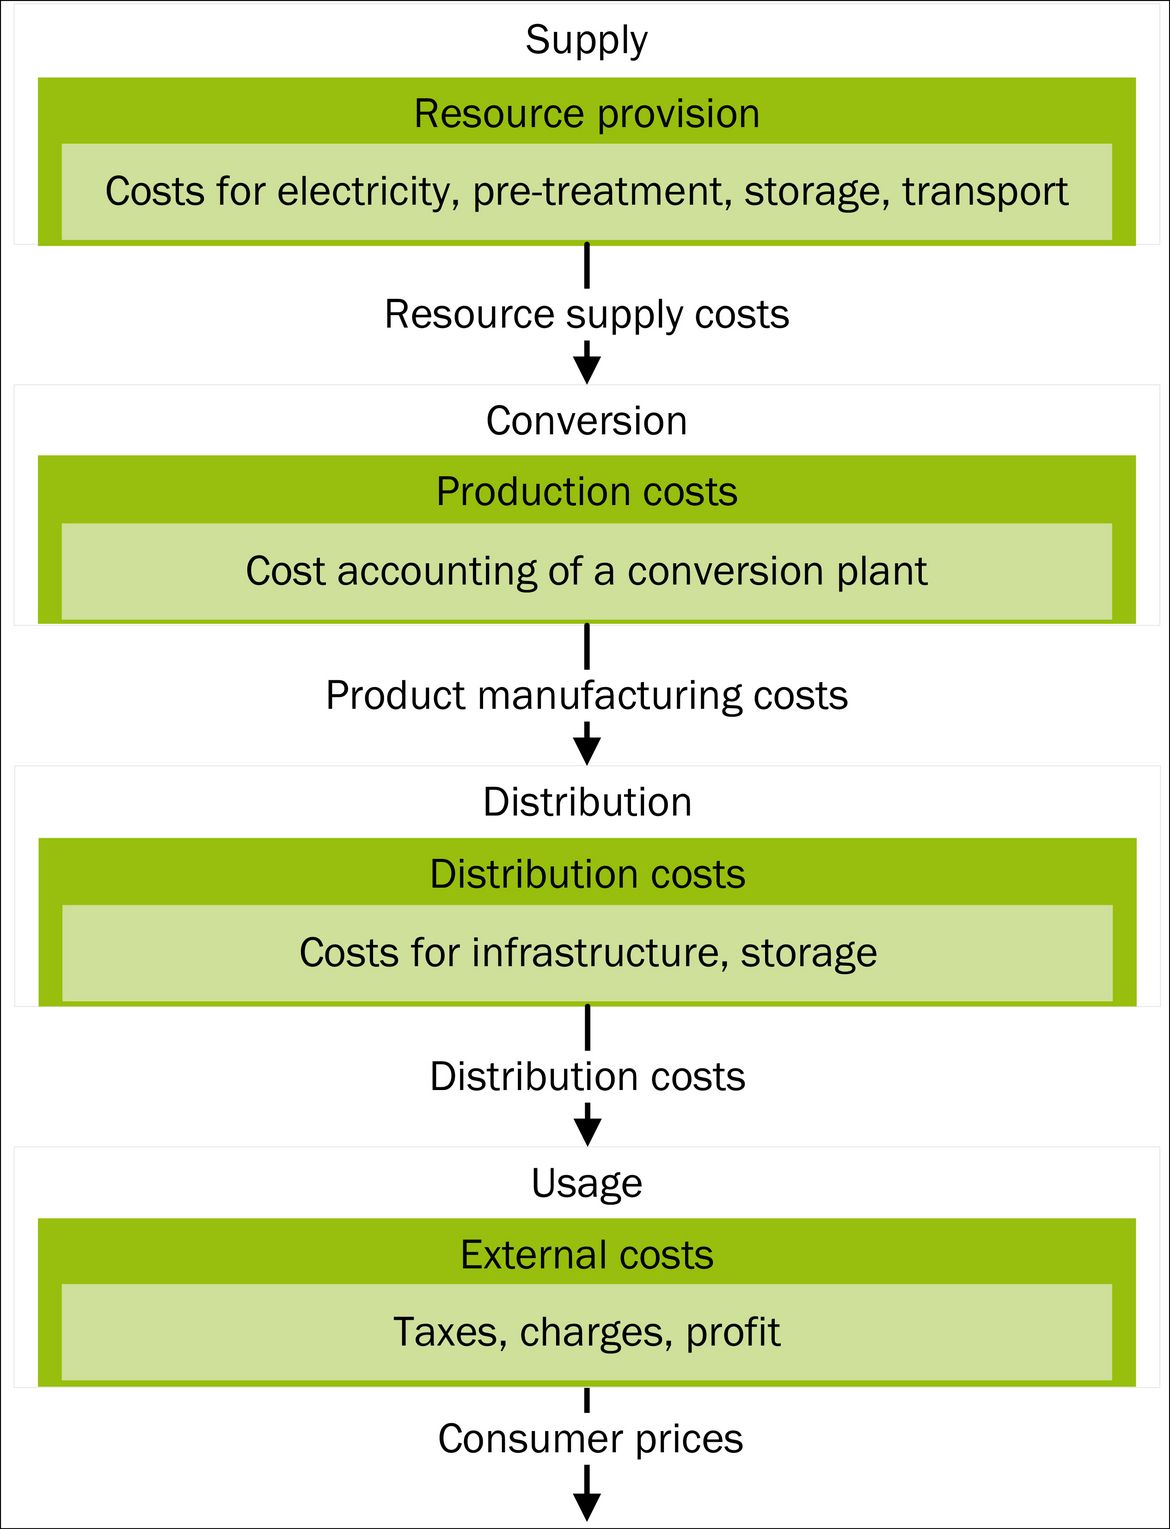
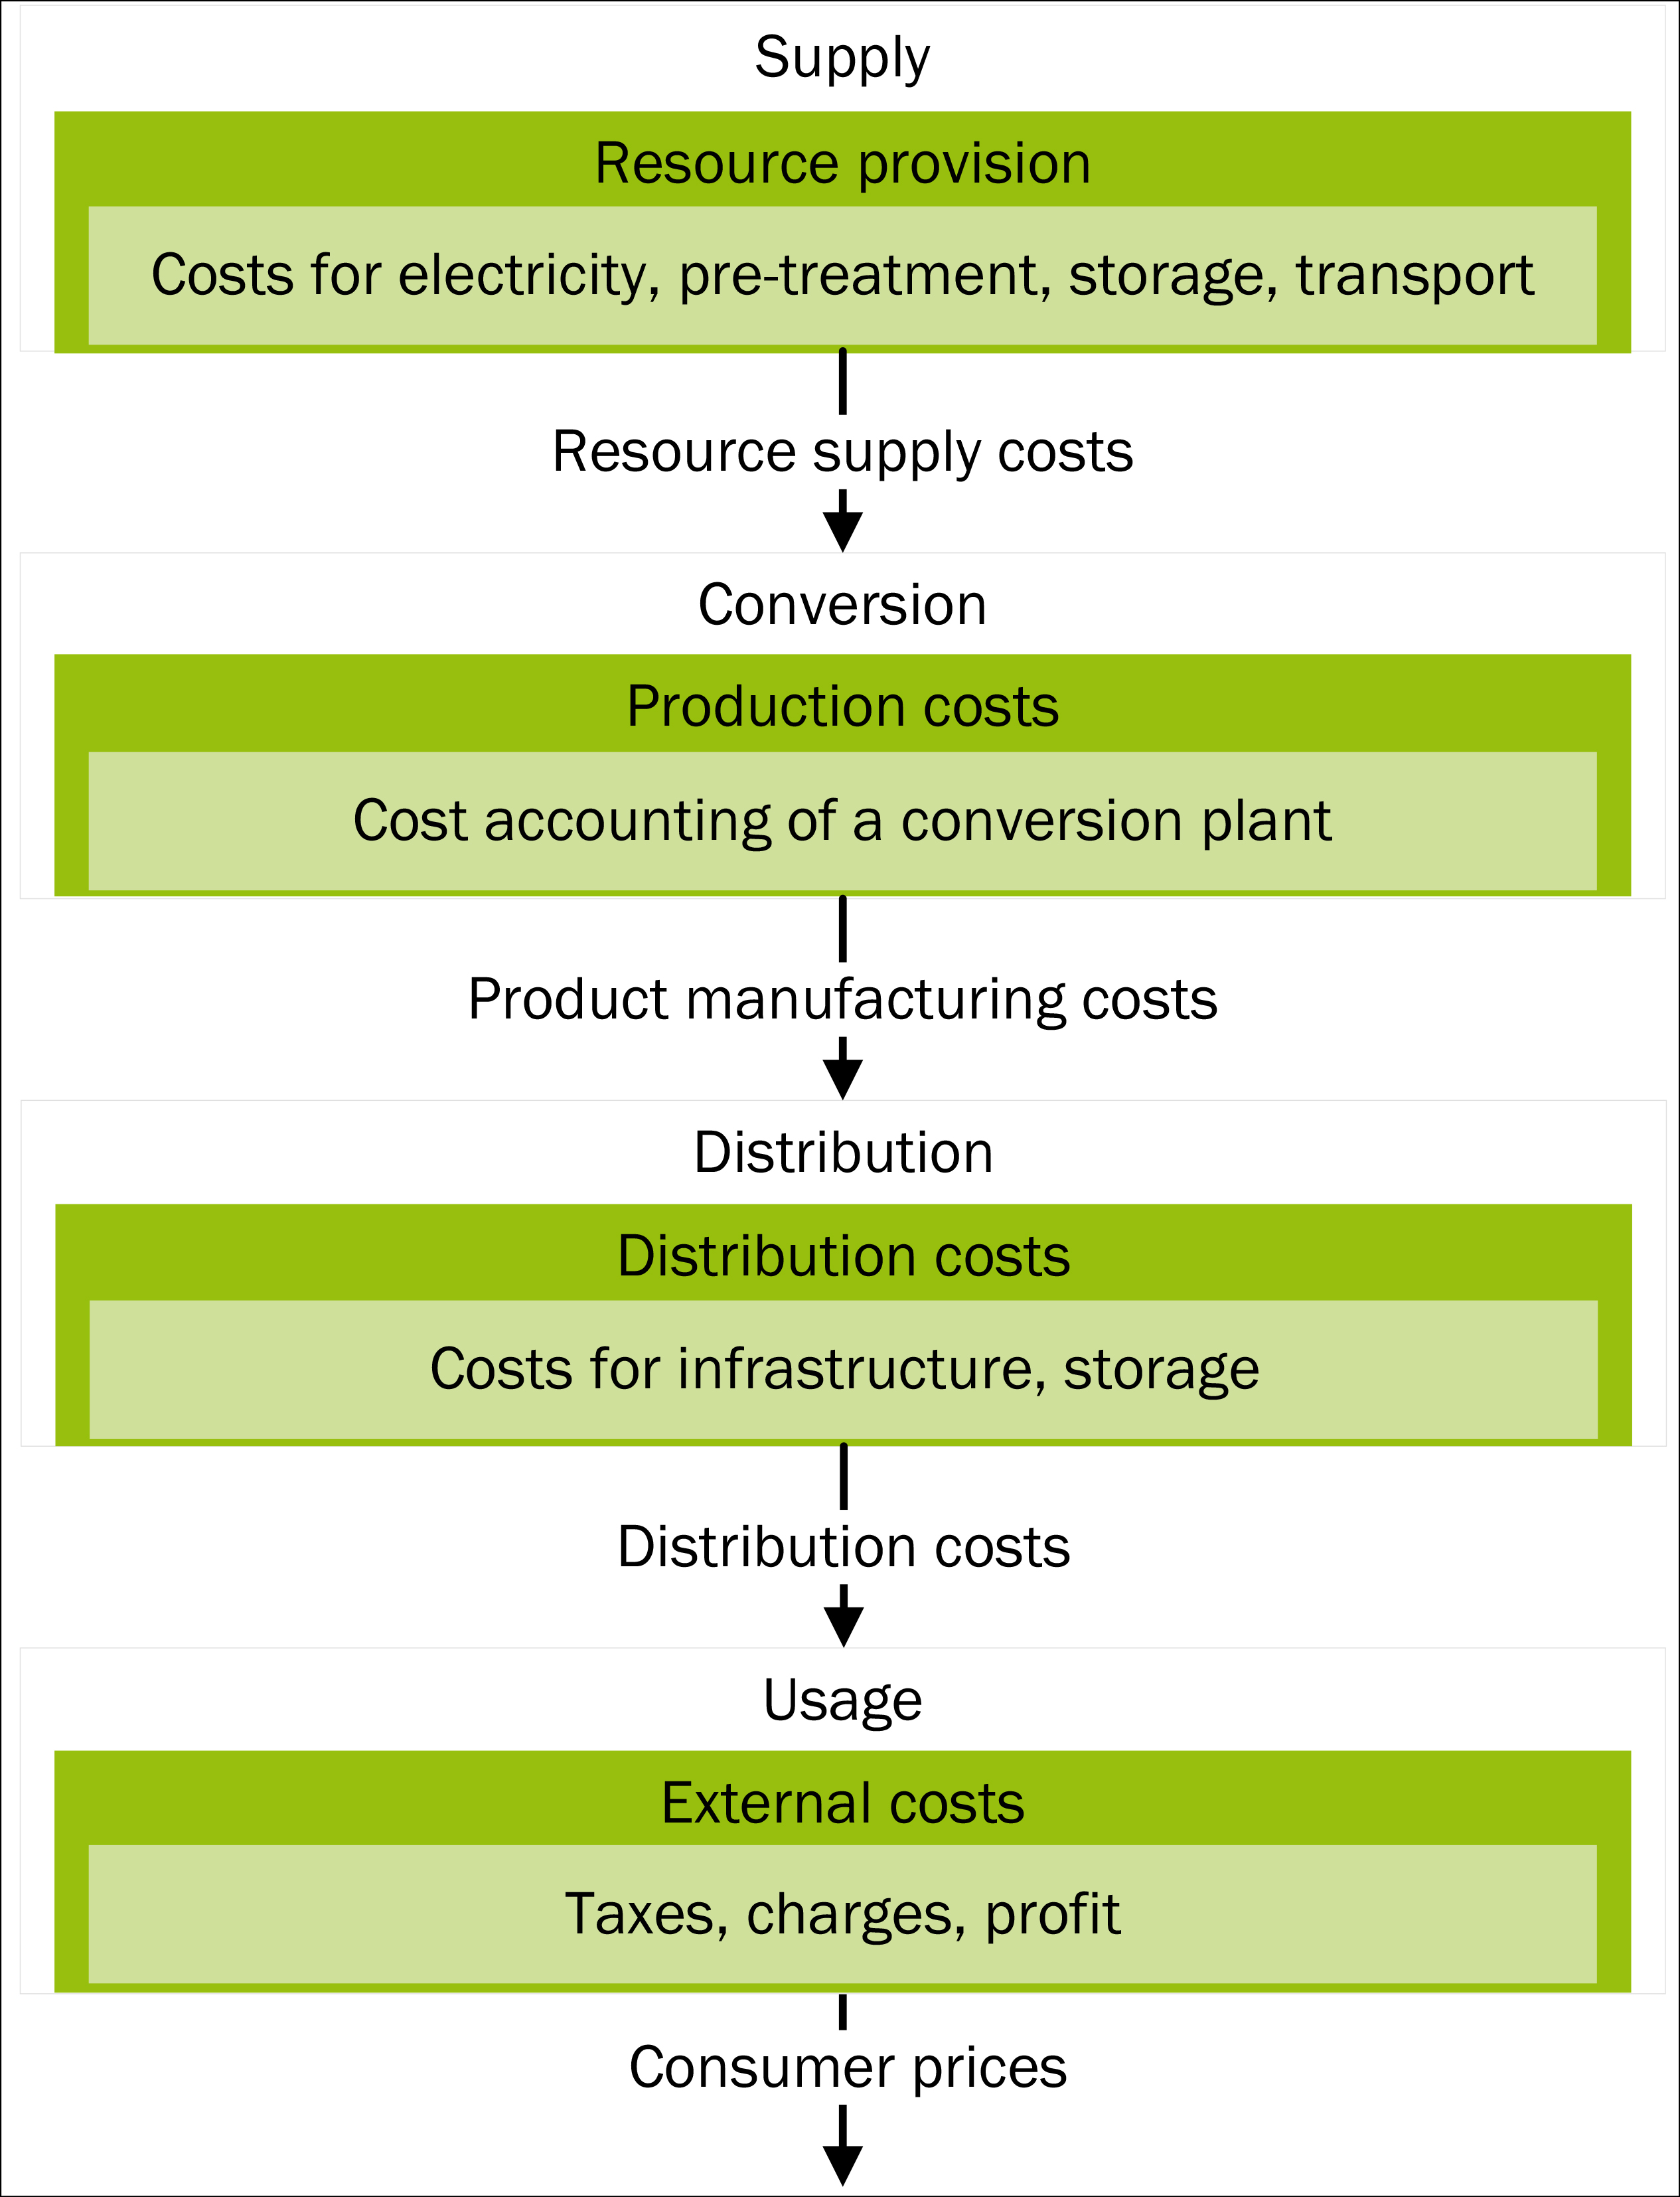
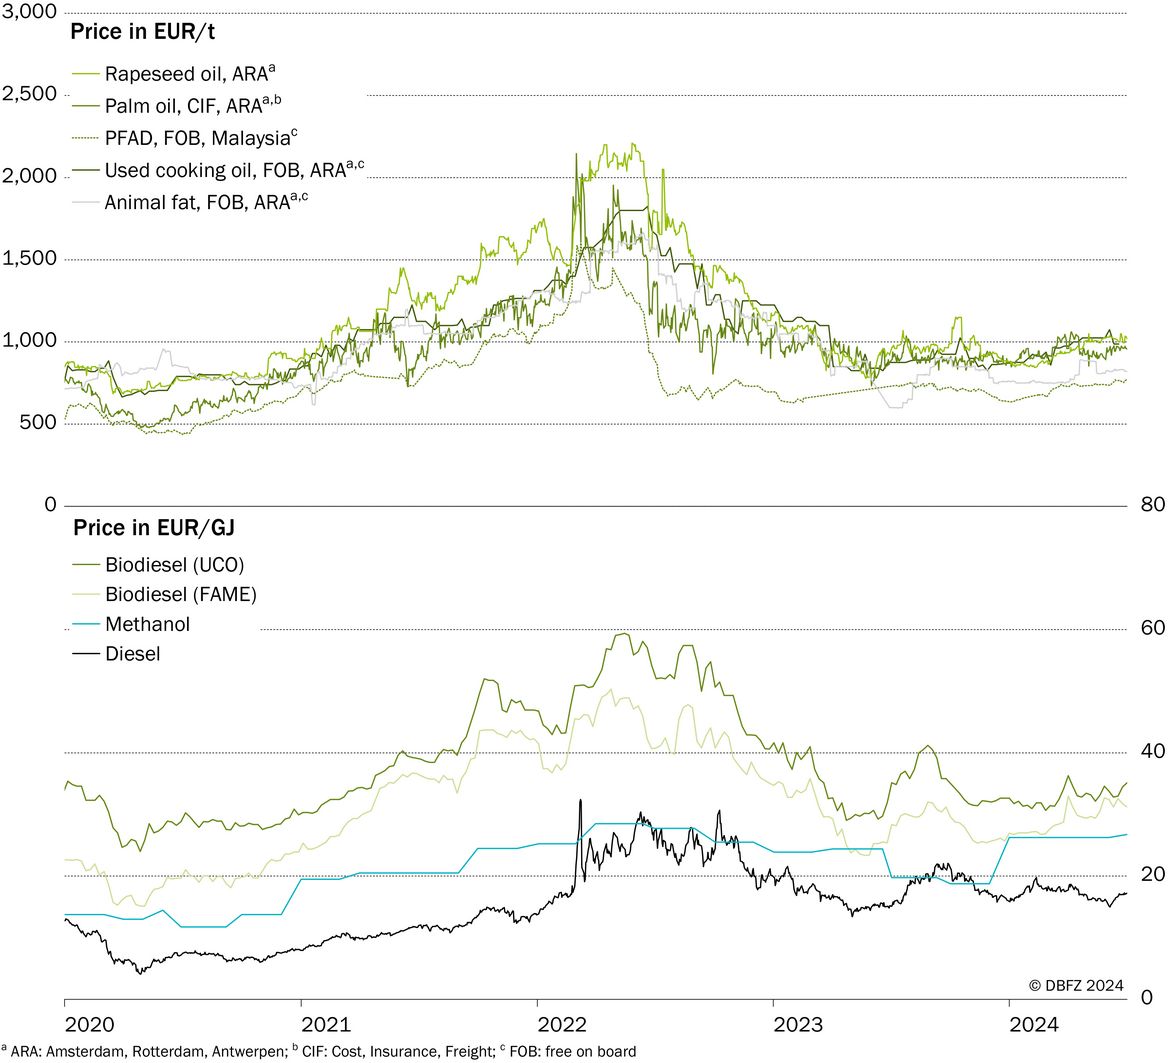
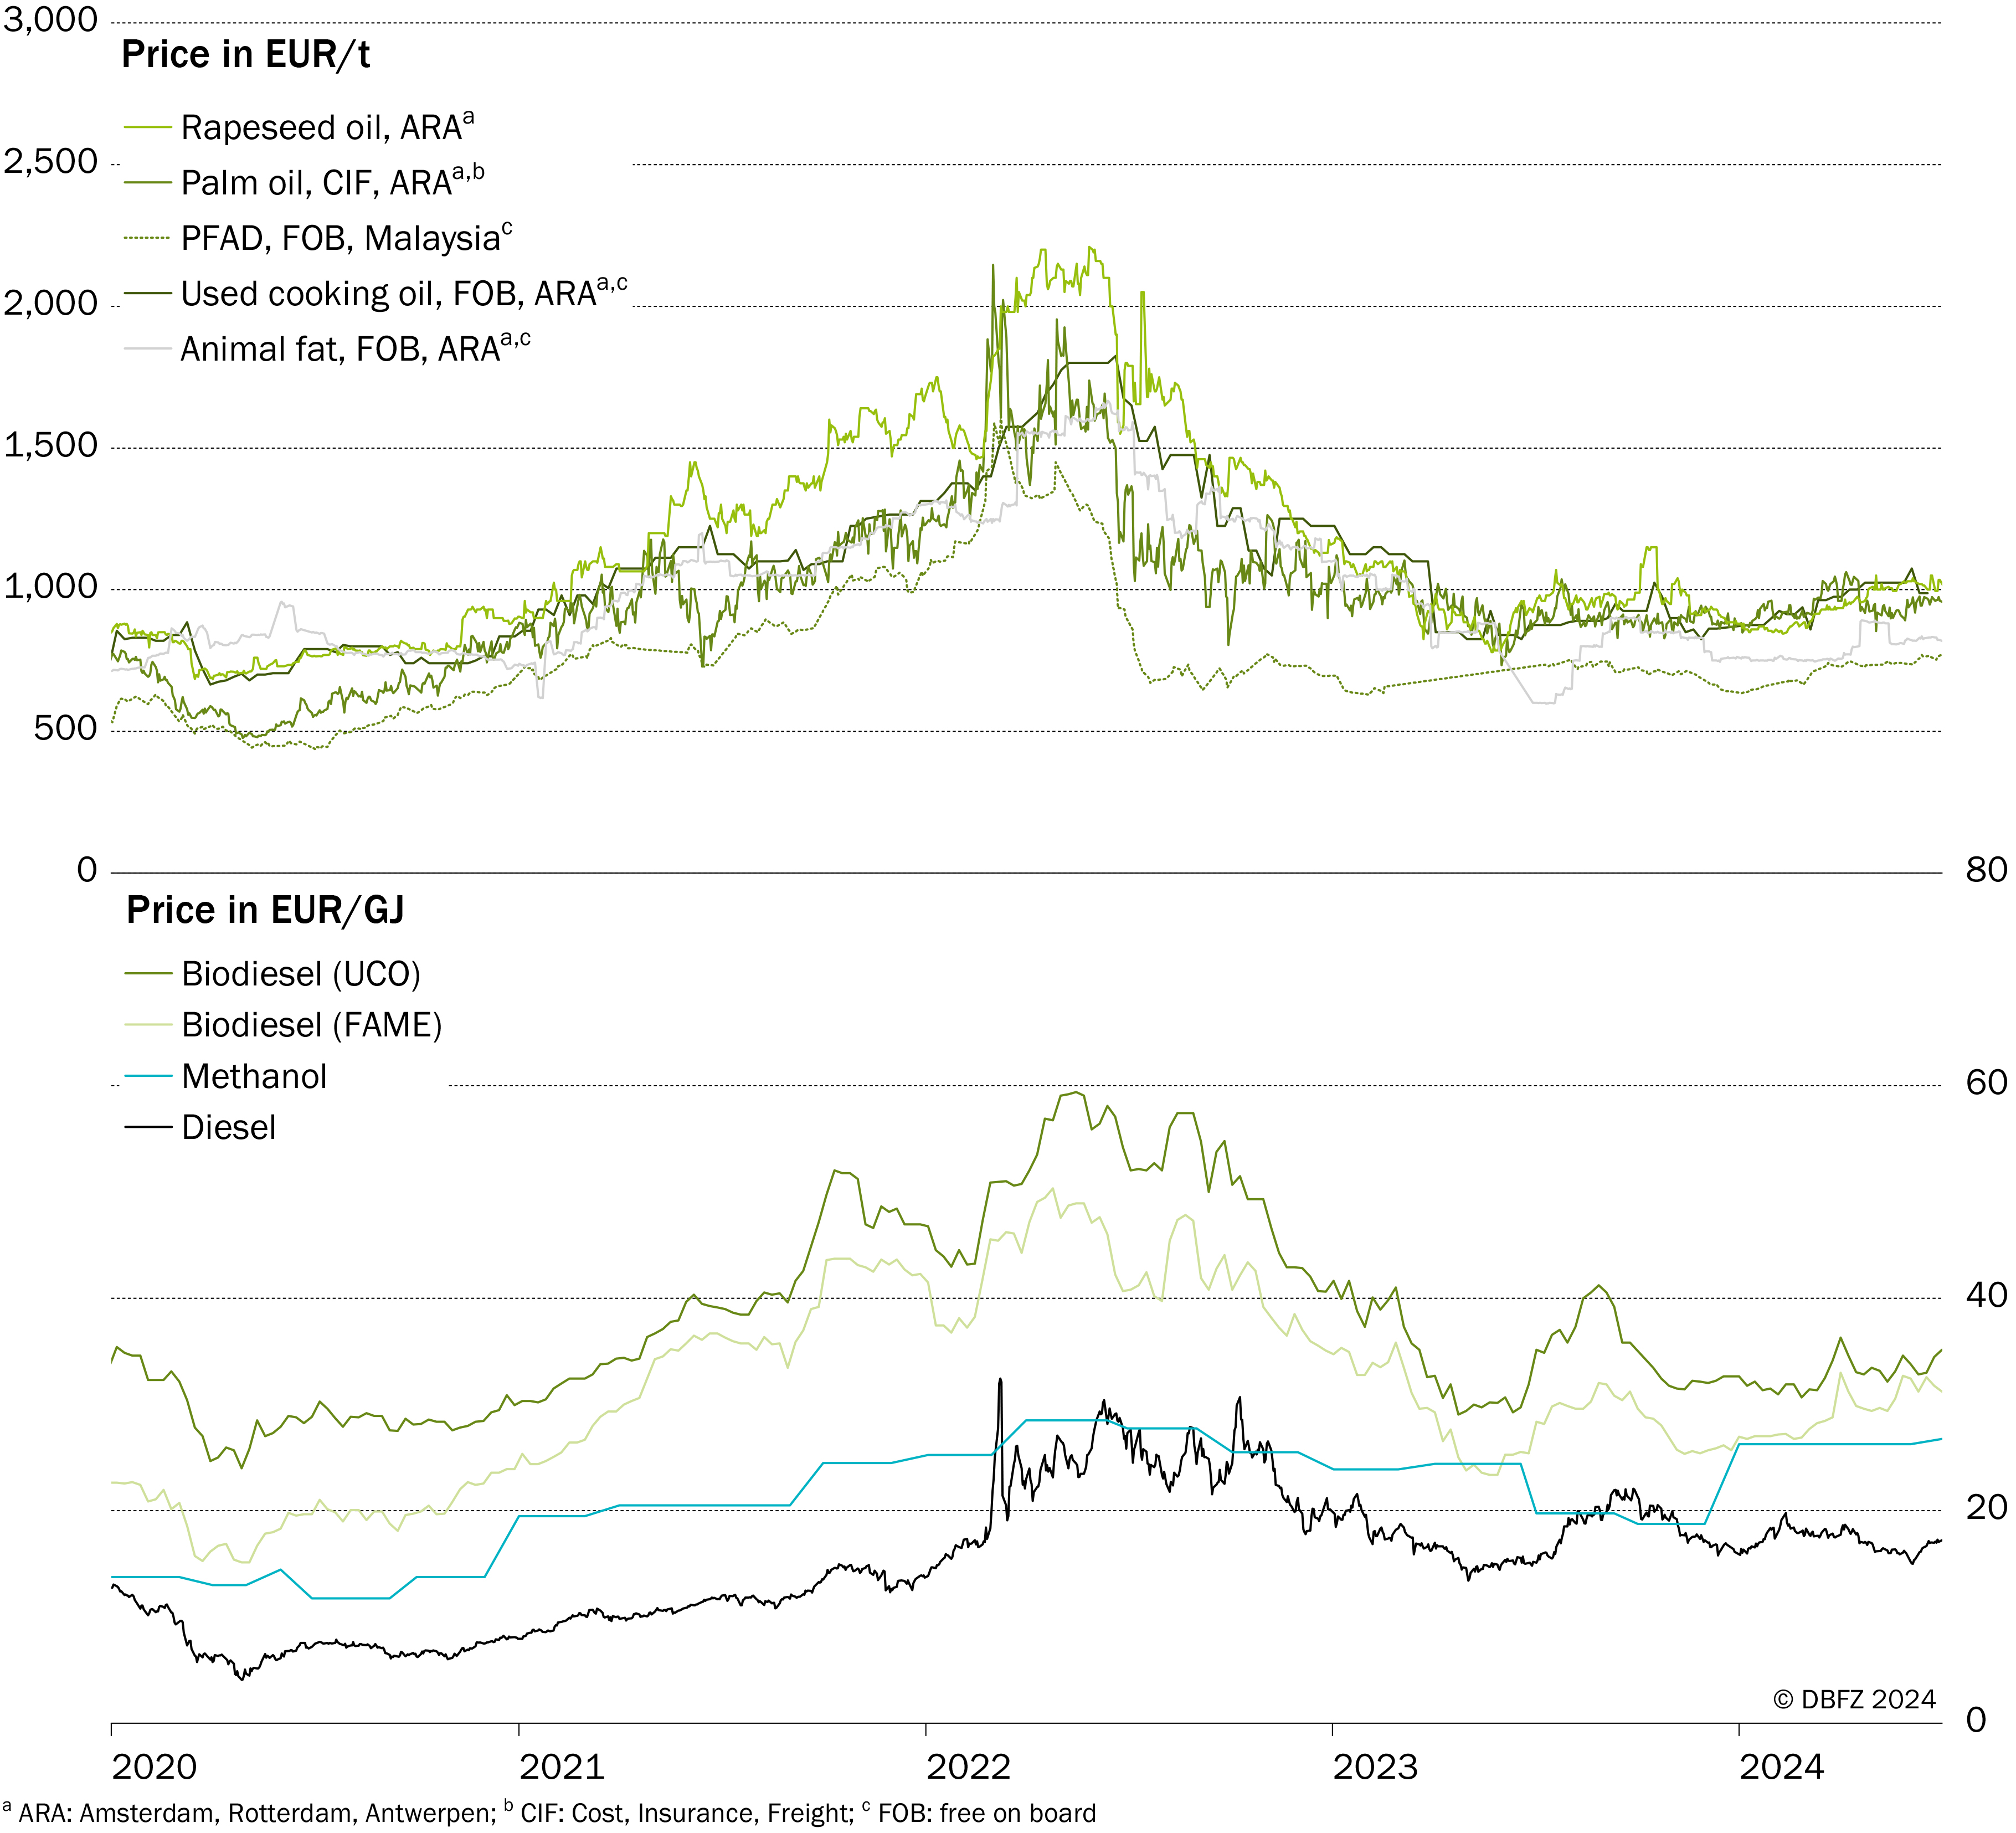
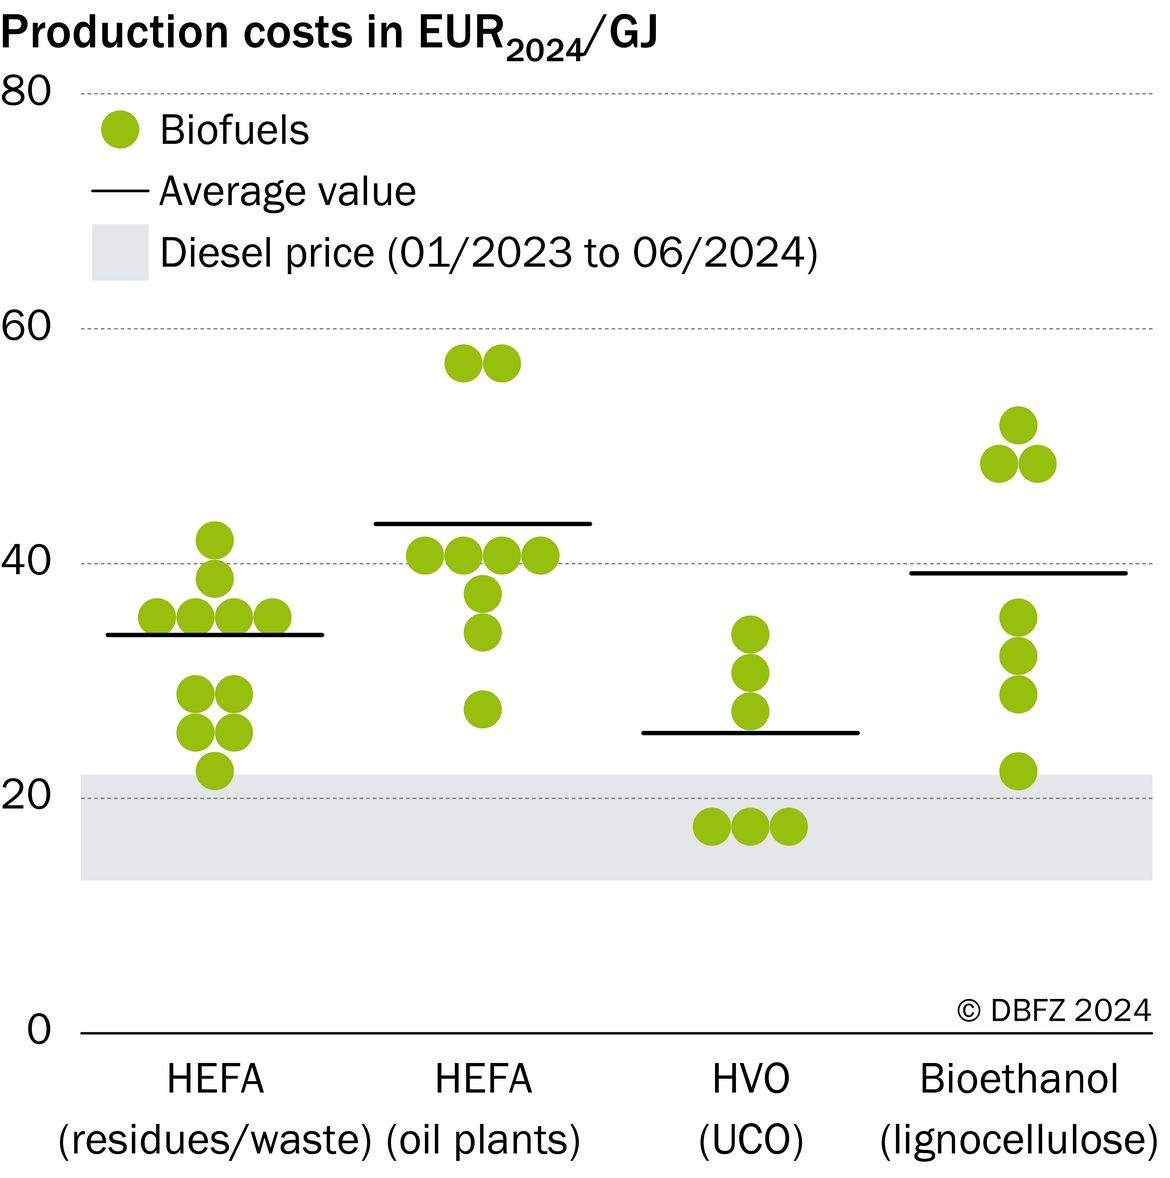
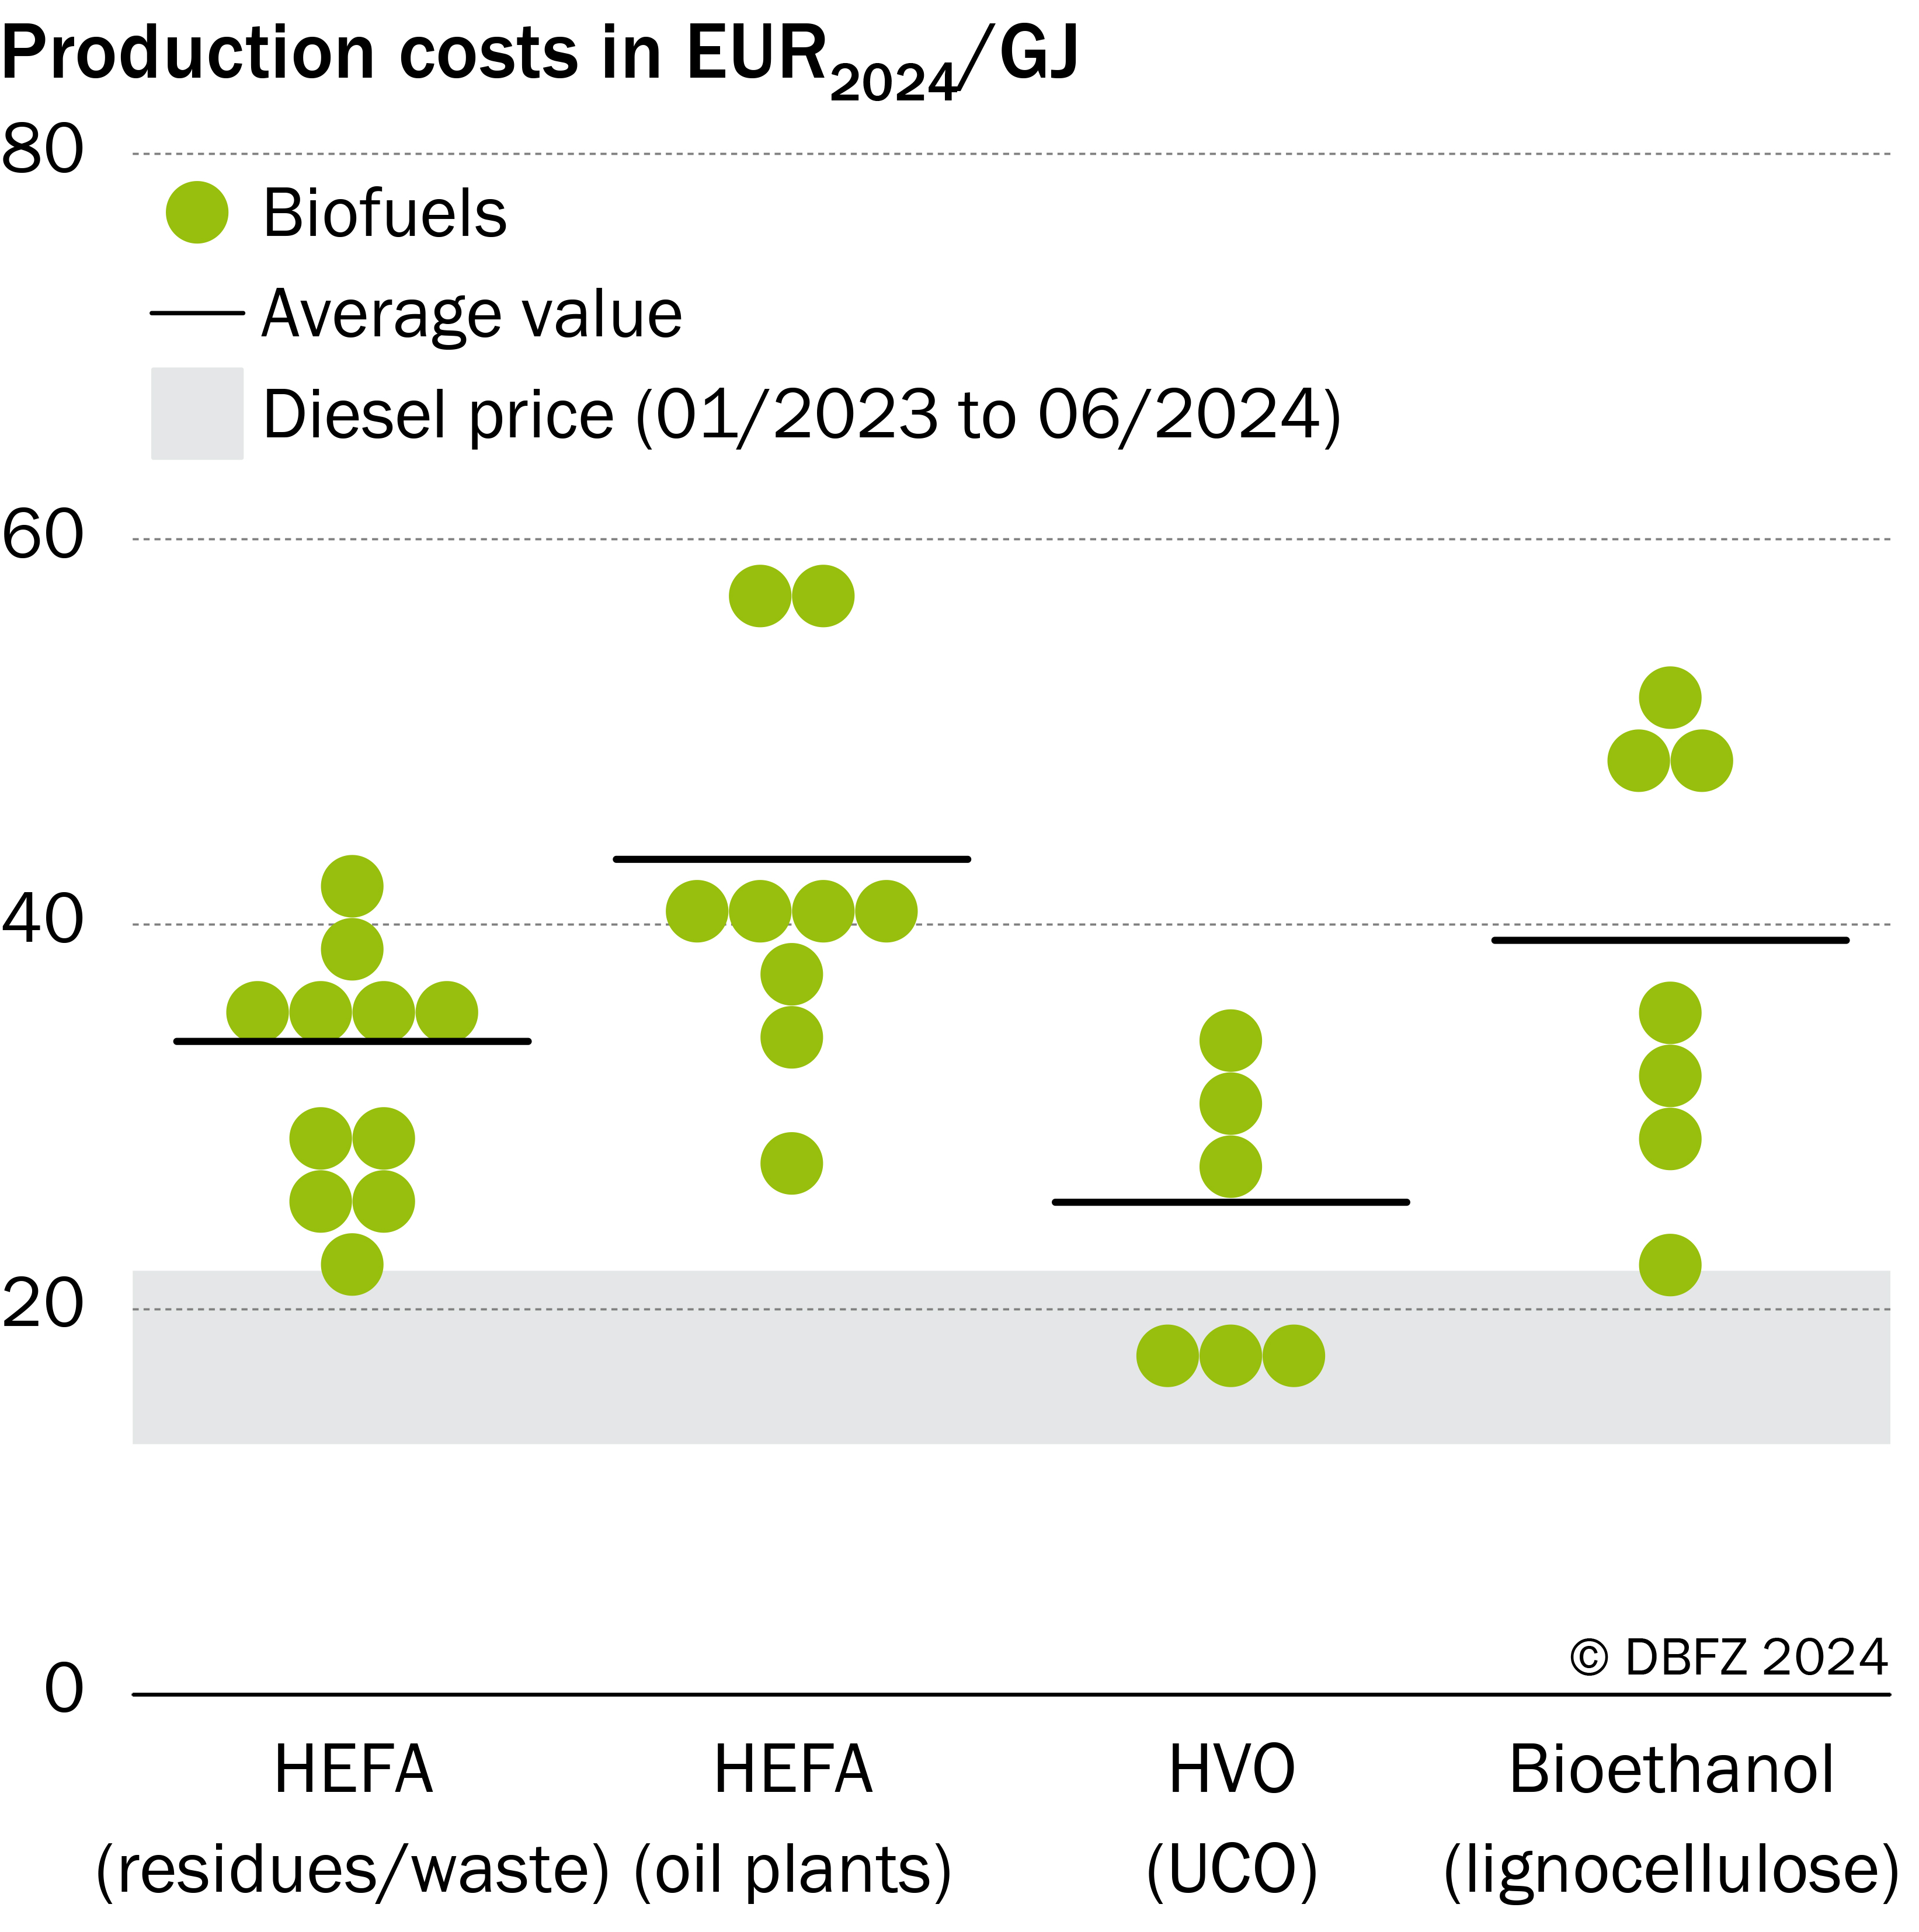
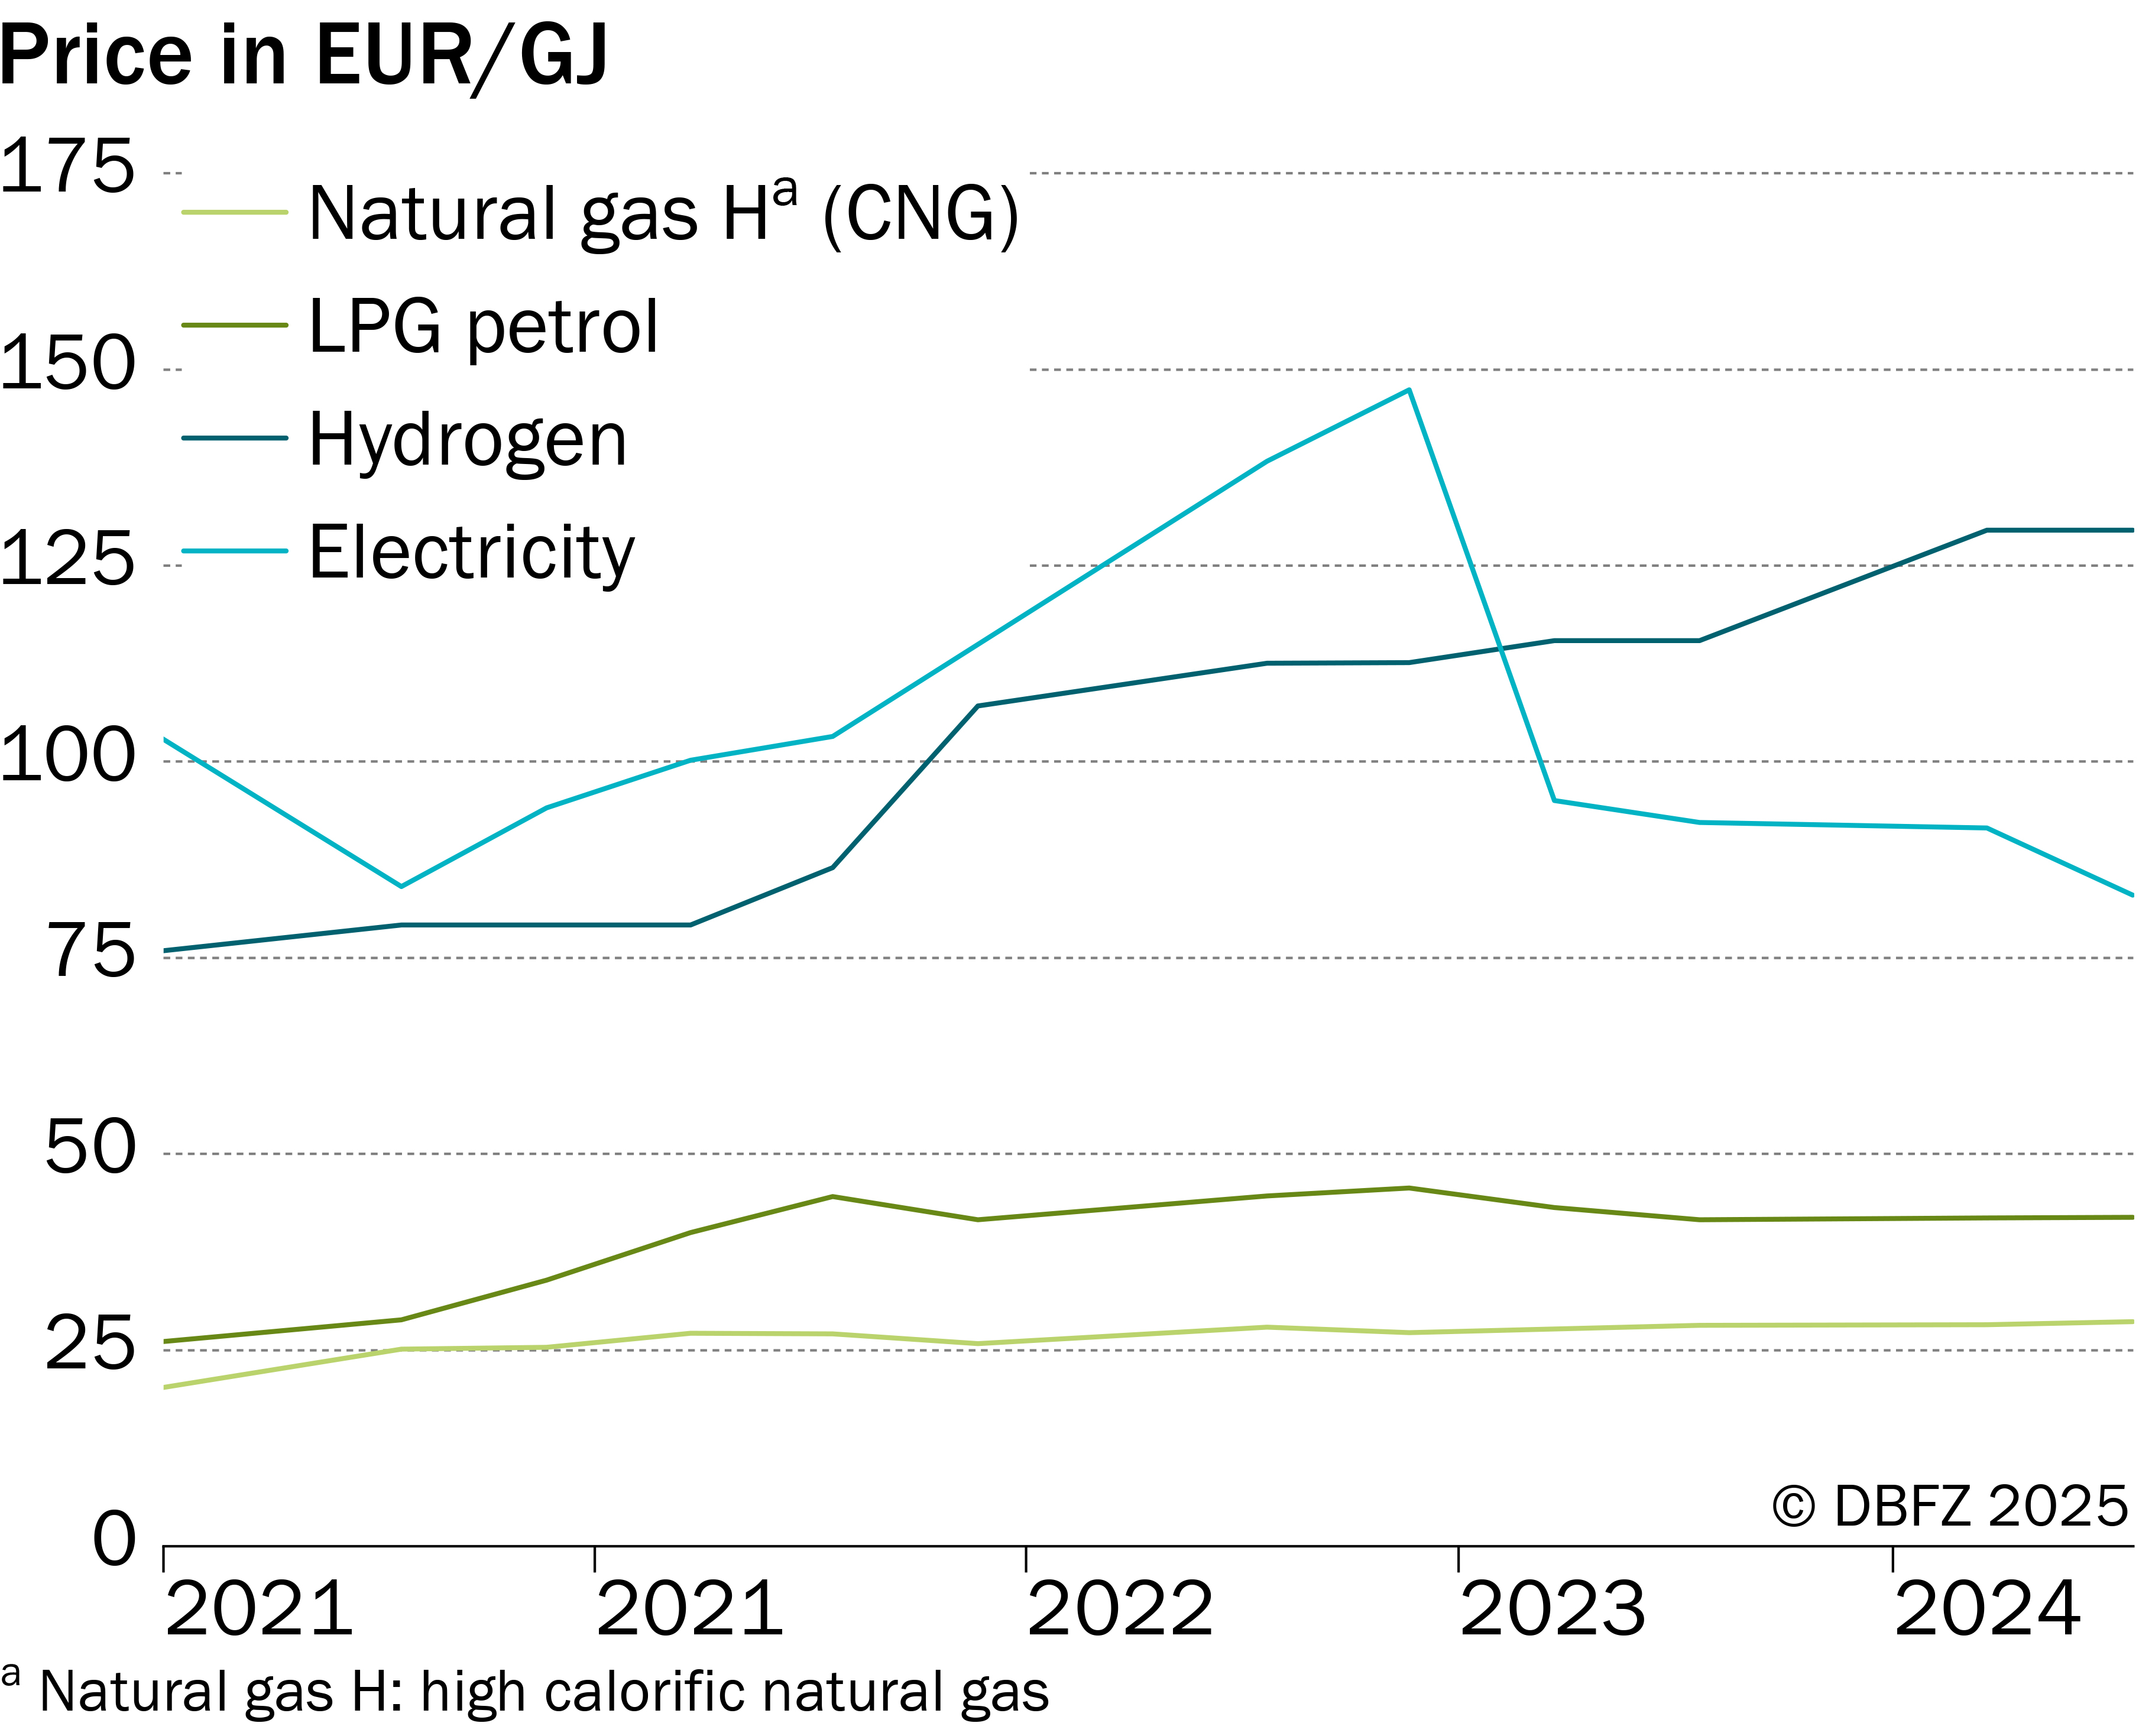
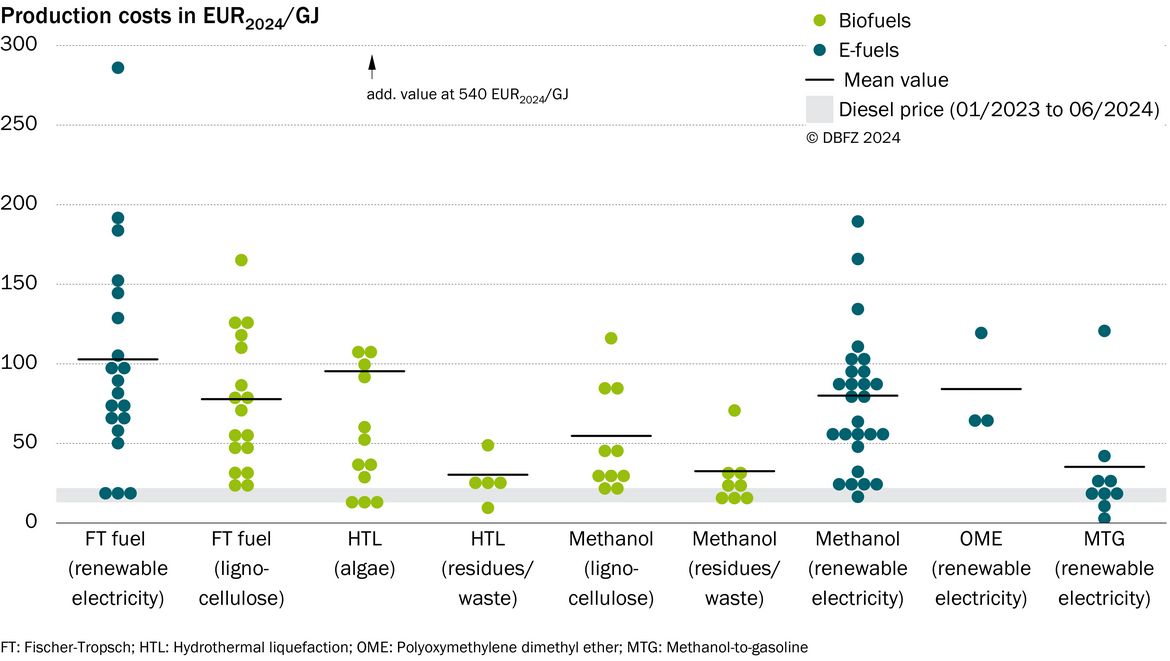
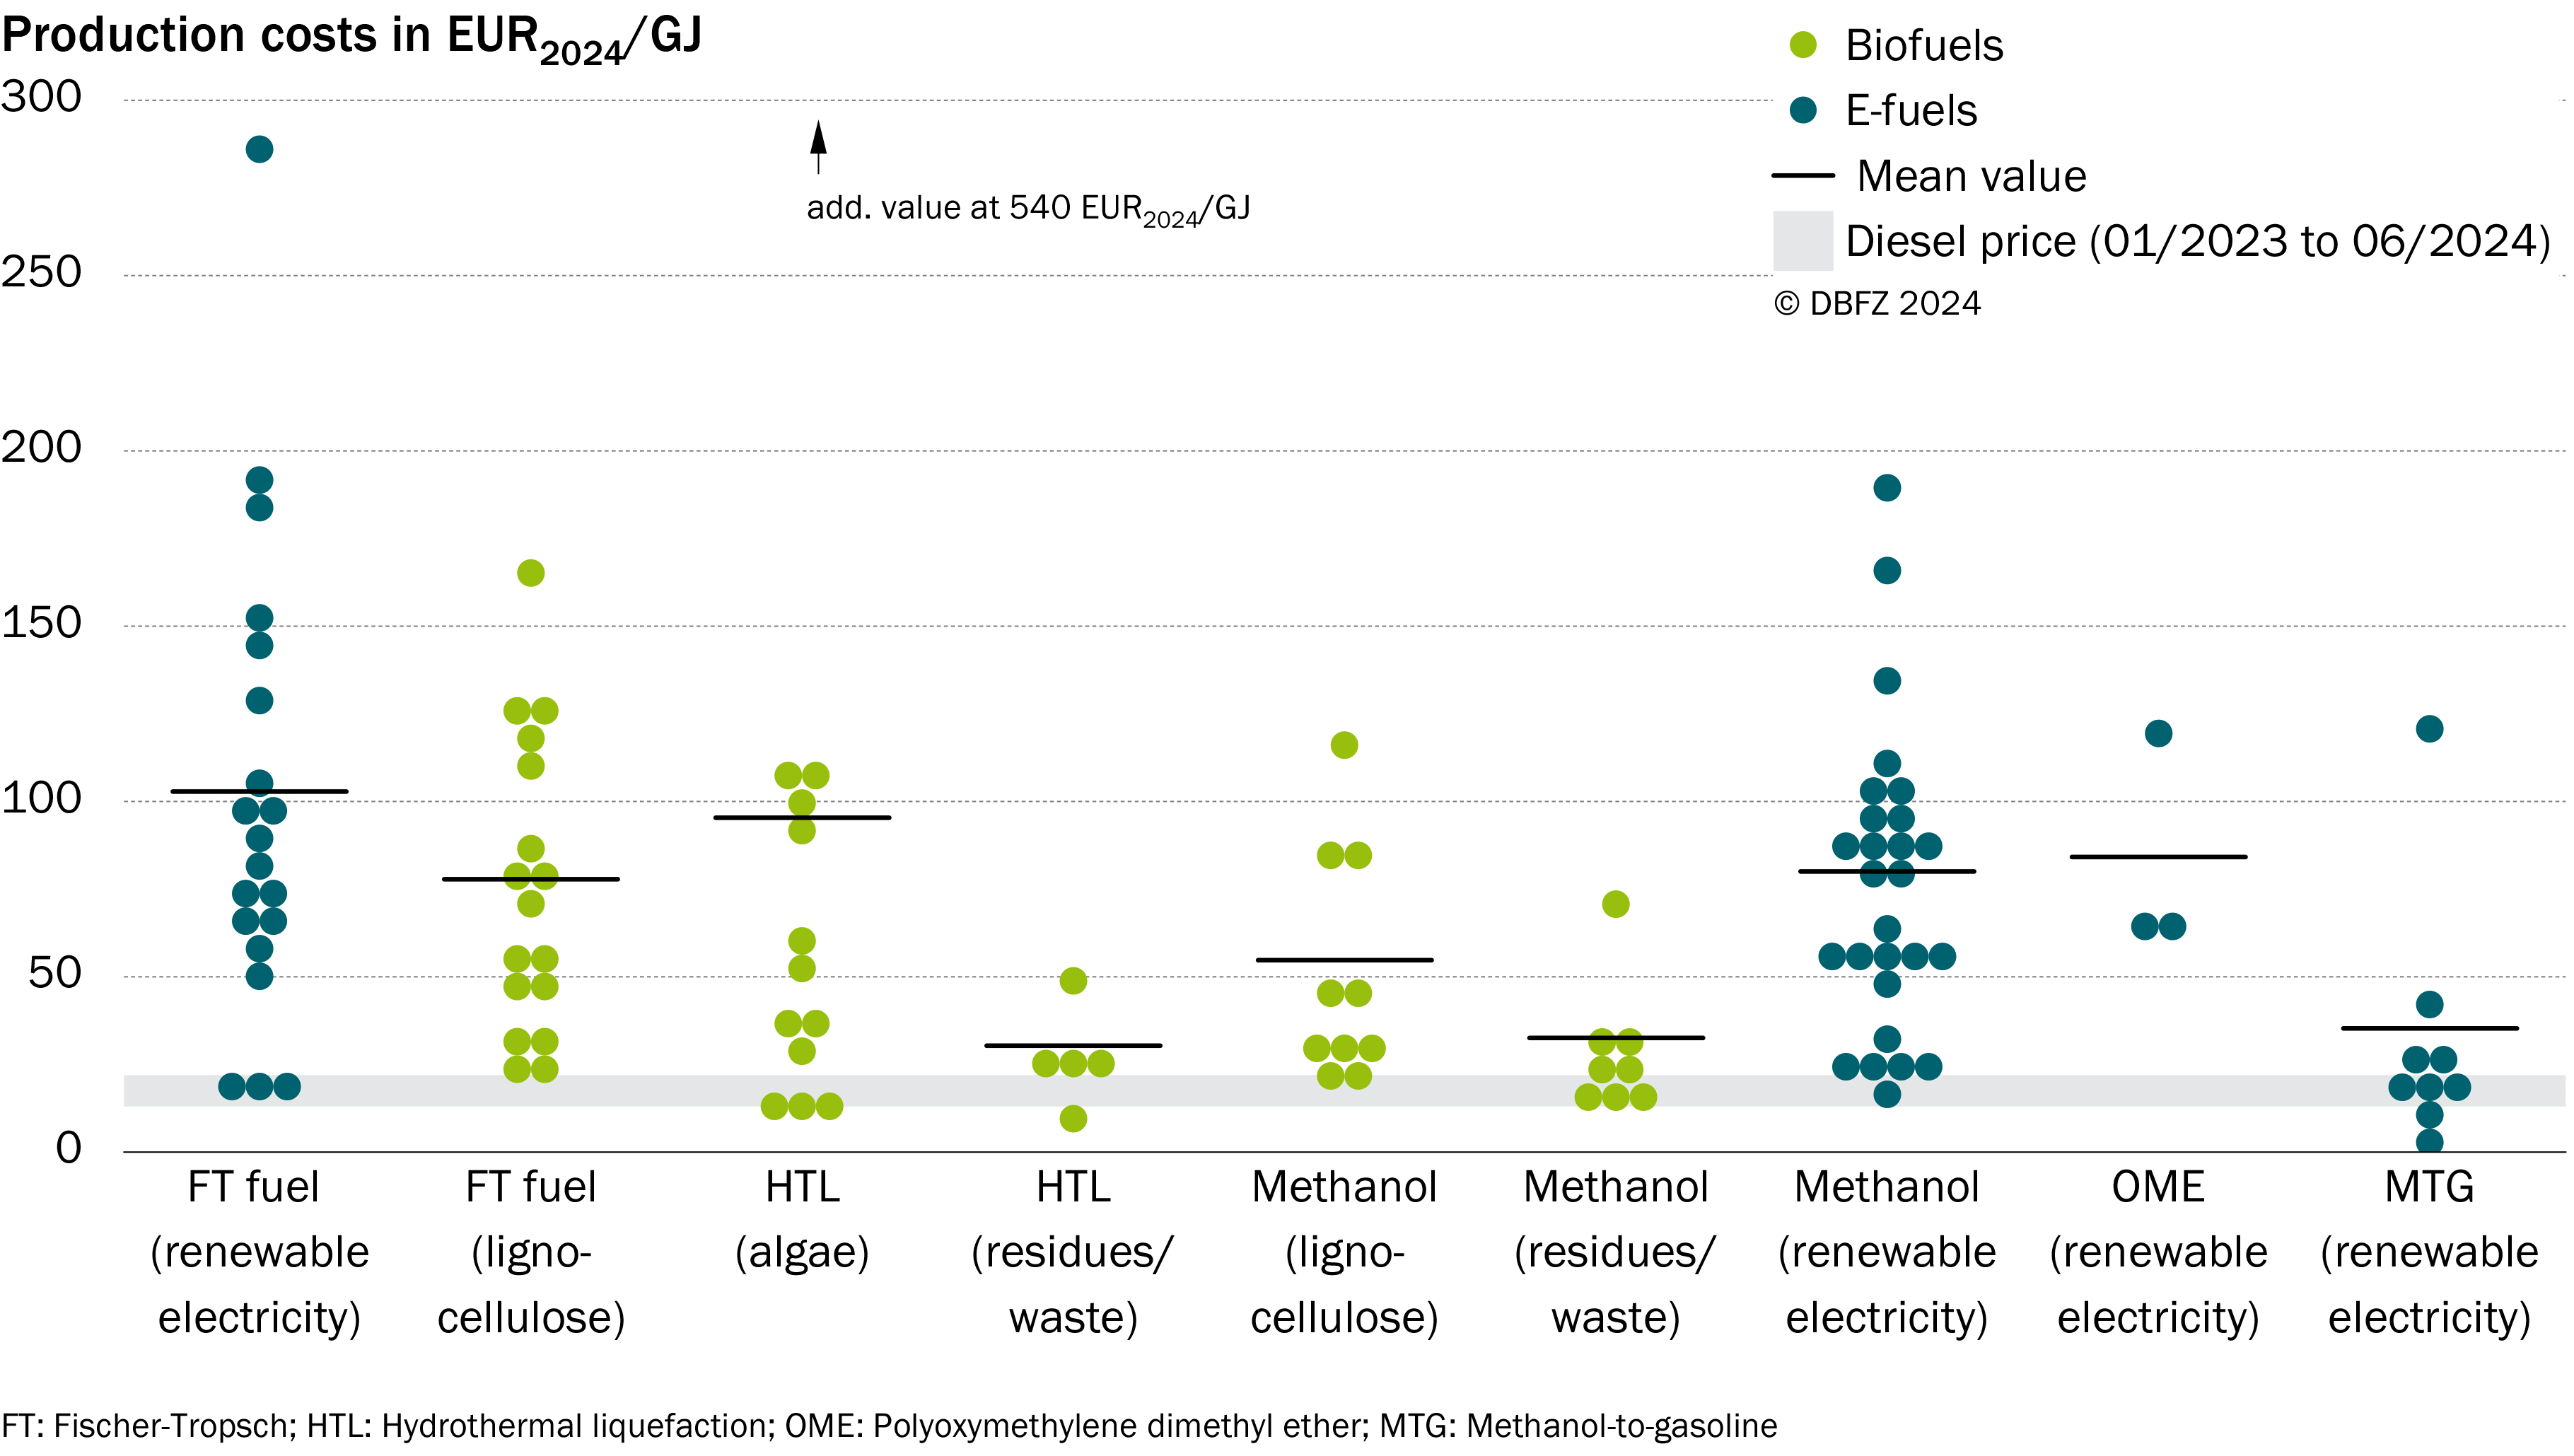
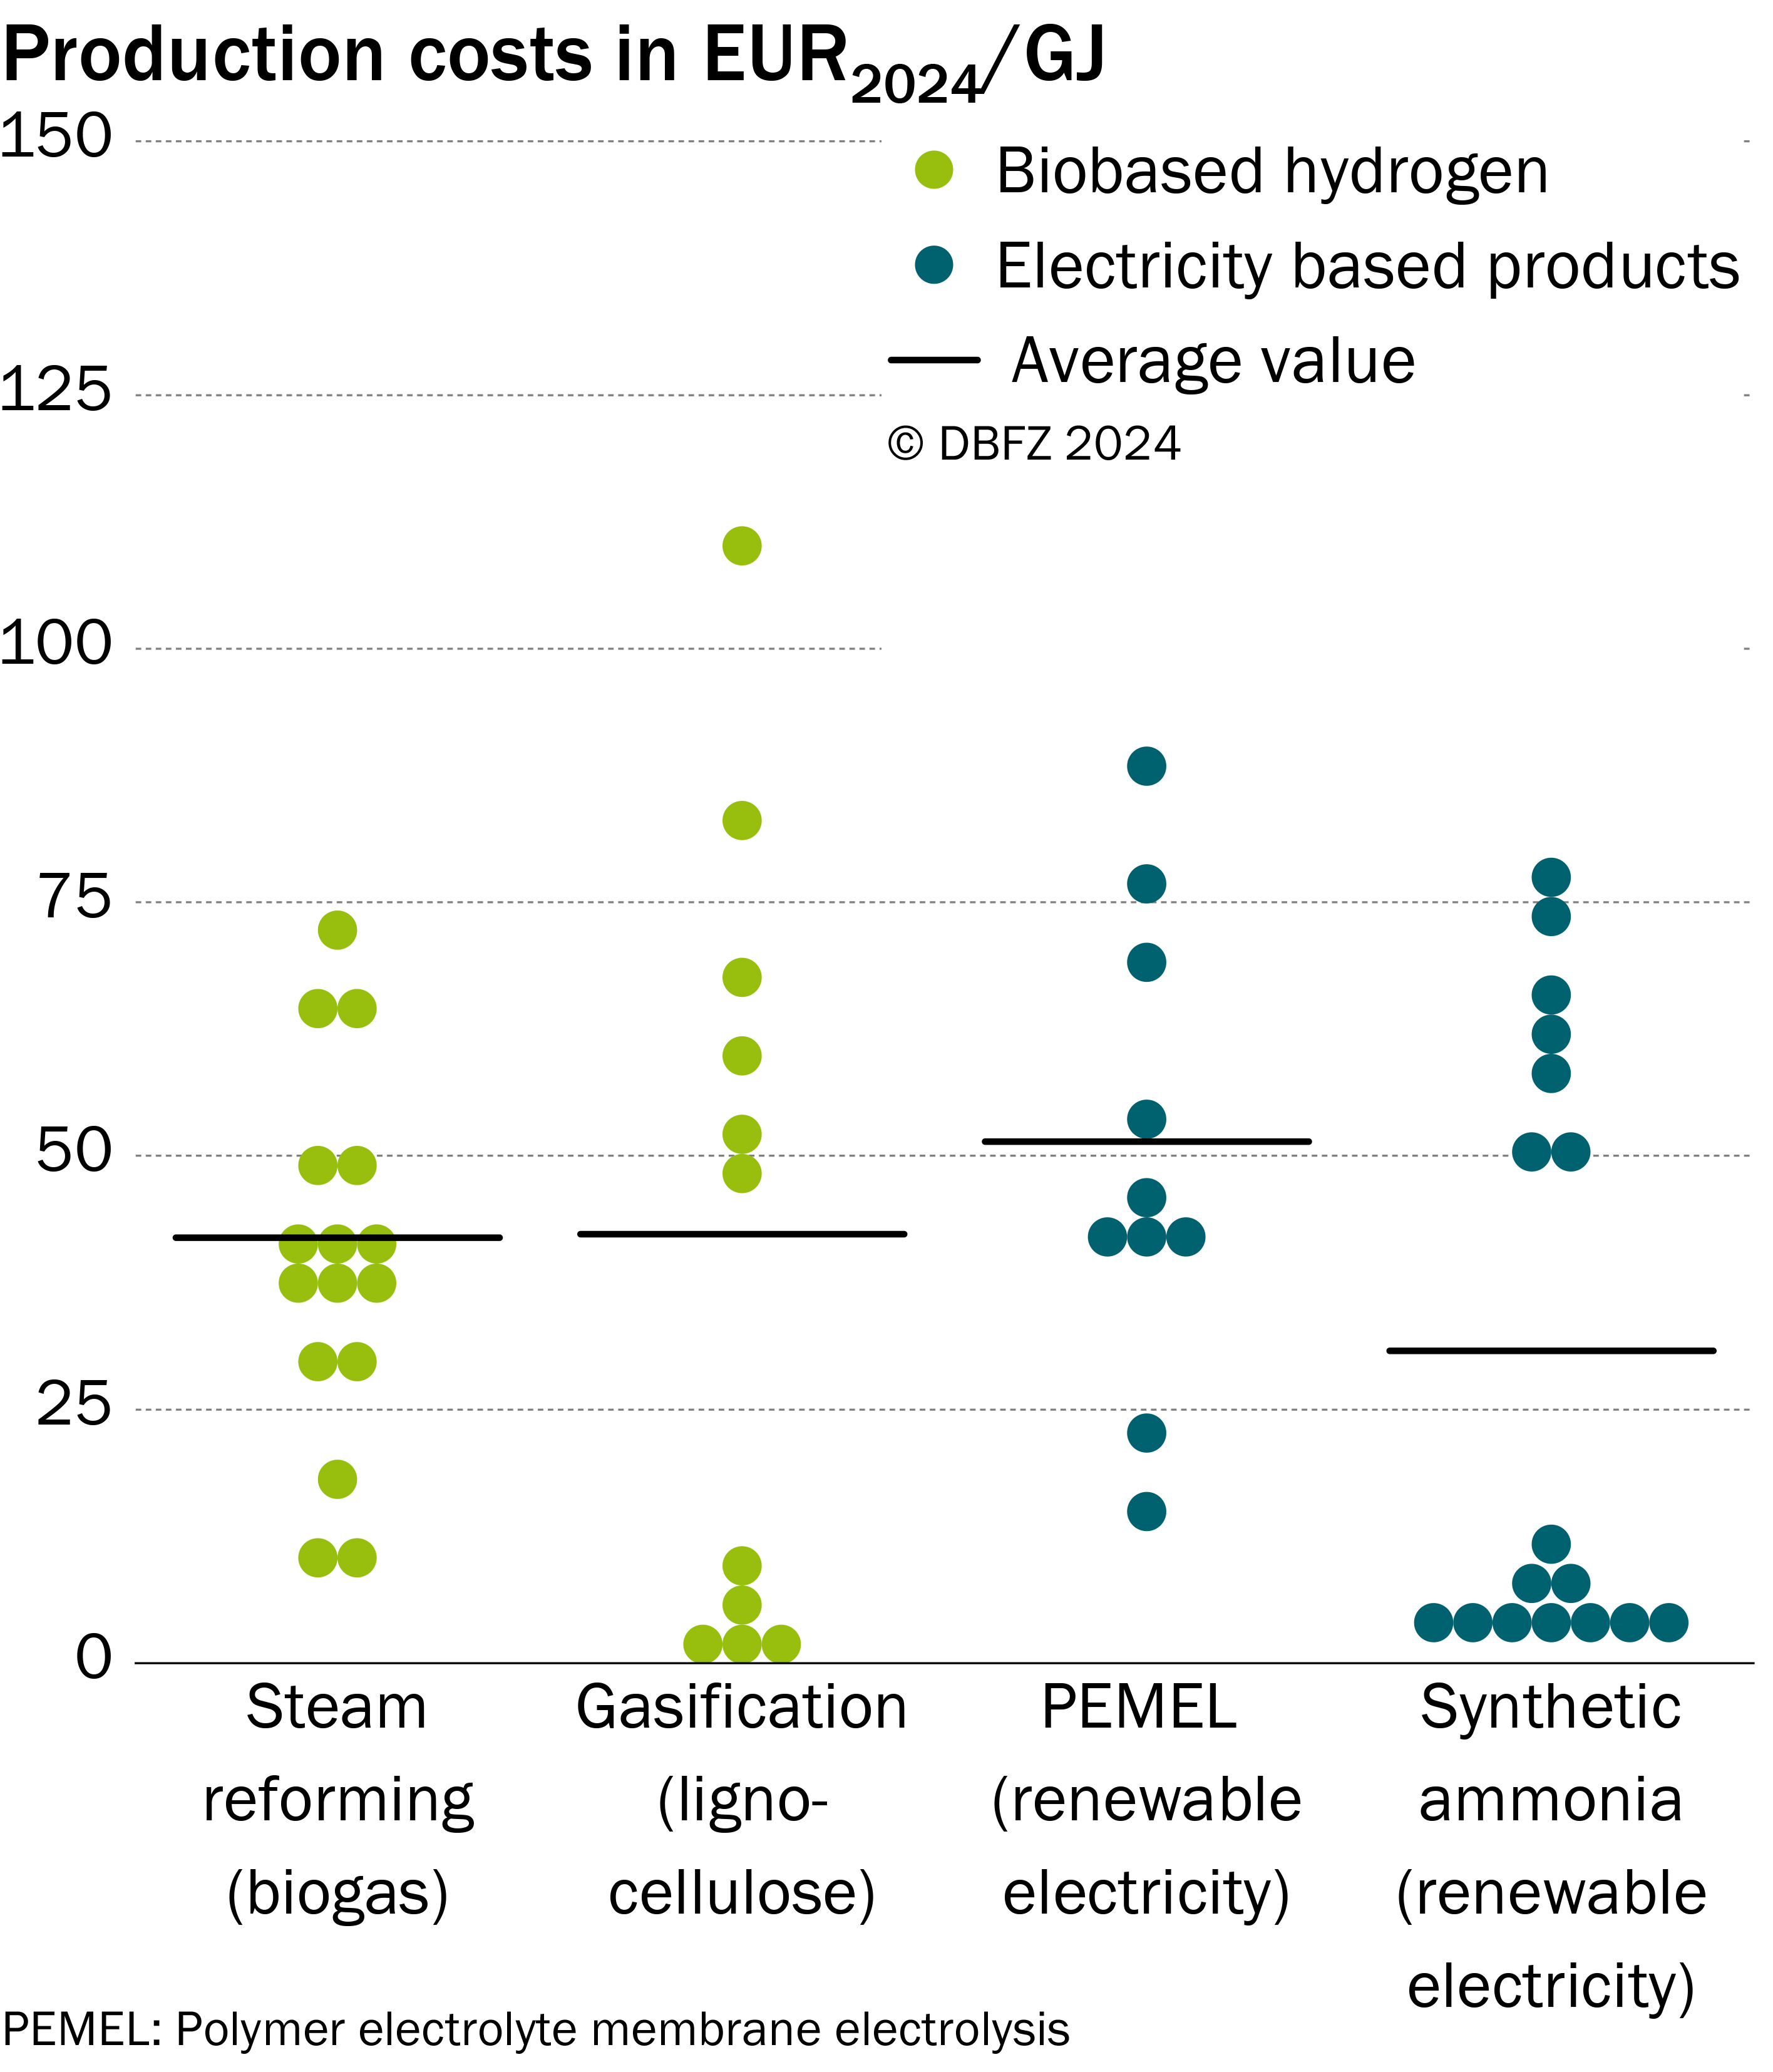
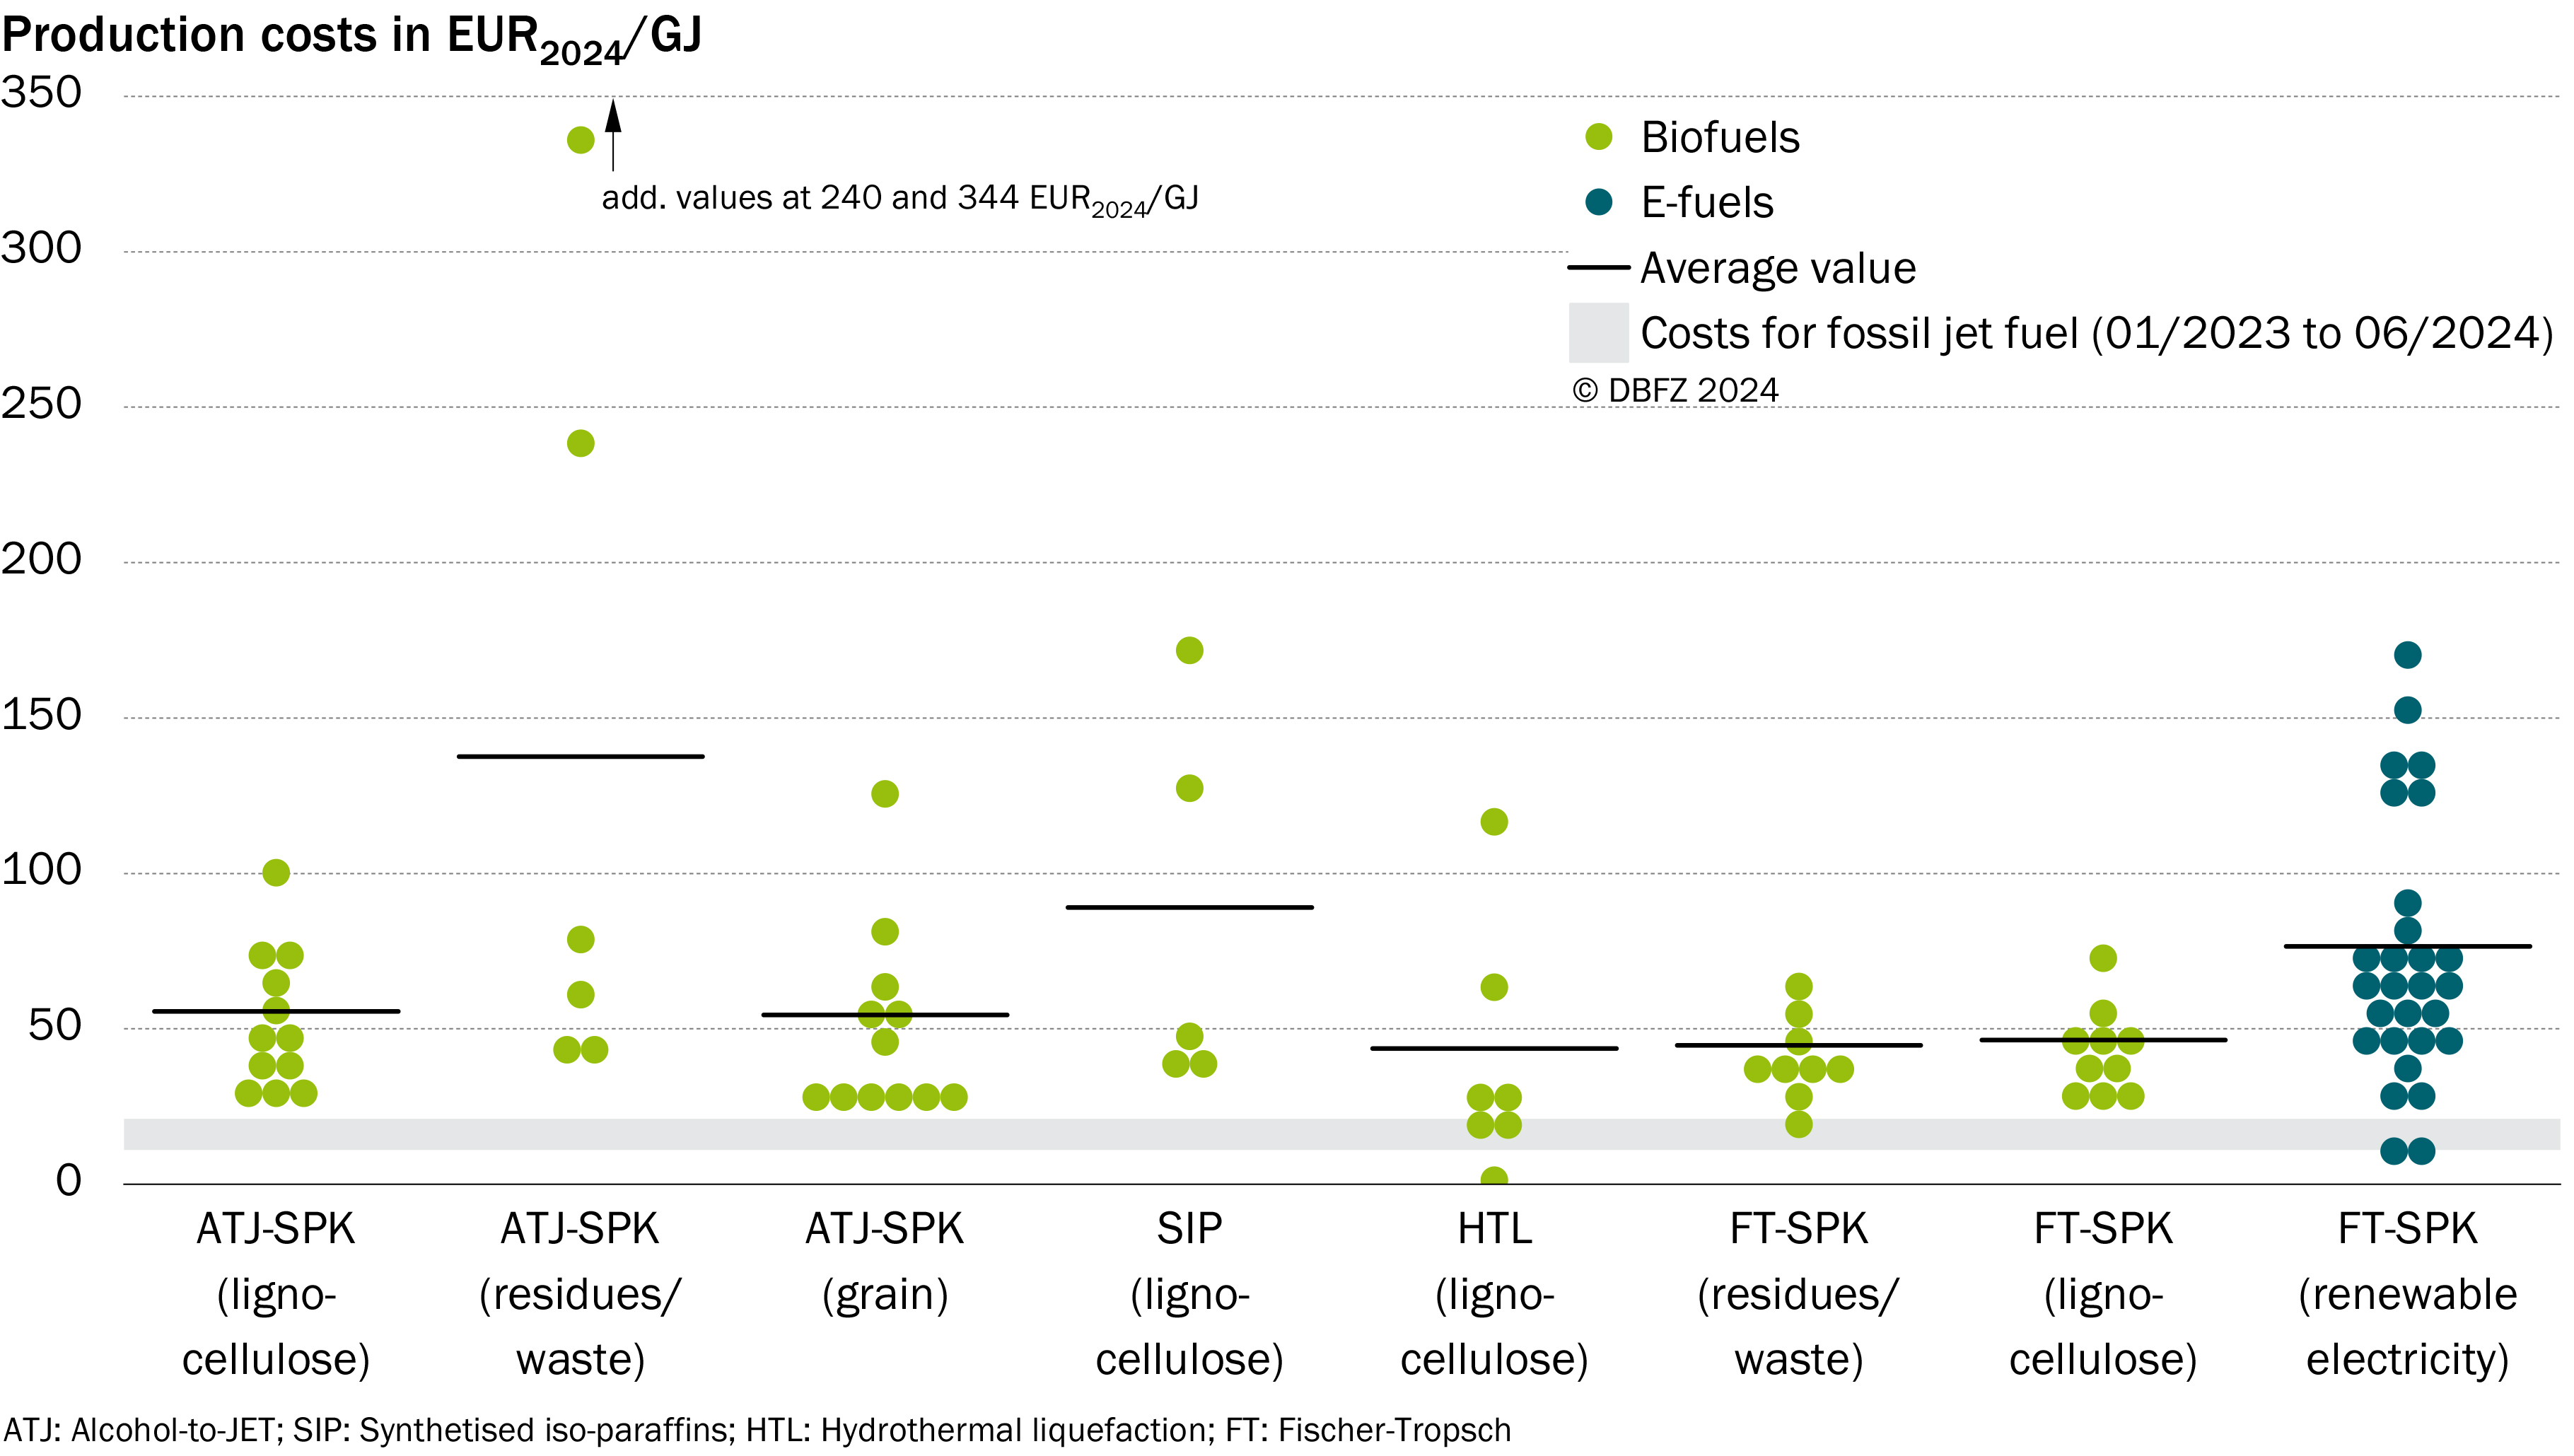
Chapter 9: Economic evaluation and assessment
When using the illustrations in Chapter 9, please cite them as follows:
Dögnitz, N.; Etzold, H. (2026): Economic evaluation and assessment. In: Schröder, J.; Görsch, K. (eds.): Renewable Energies in Transport. Monitoring Report. pp. 143-147. Leipzig: DBFZ. ISBN: 978-3-949807-36-7. DOI: 10.48480/45hp-x131