Chapter 2: Transport and its infrastructure
Transport is closely linked to the concept of mobility. Both describe the movement of people and goods within a region or between different locations. Mobility refers to the ability or need to move, whether on foot, by bicycle, by car or by public transport. Transport refers to the organisational and infrastructural aspects of this movement, including roads, railways, airports and ports. According to this definition, transport represents realised mobility. The challenges in this area include improving traffic flows, reducing environmental impacts and promoting sustainable mobility solutions. Effective mobility and transport planning is crucial for economic development and quality of life in cities and regions. The Monitoring Report covers only the energy supply aspect of transport. Accordingly, the relevant parameters for a demand-driven analysis of renewable energy in transport are transport performance, the different modes of transport and their energy consumption, and the associated energy supply infrastructure.
For optimal presentation and readability, we recommend downloading and
opening the monitoring report in a PDF reader.
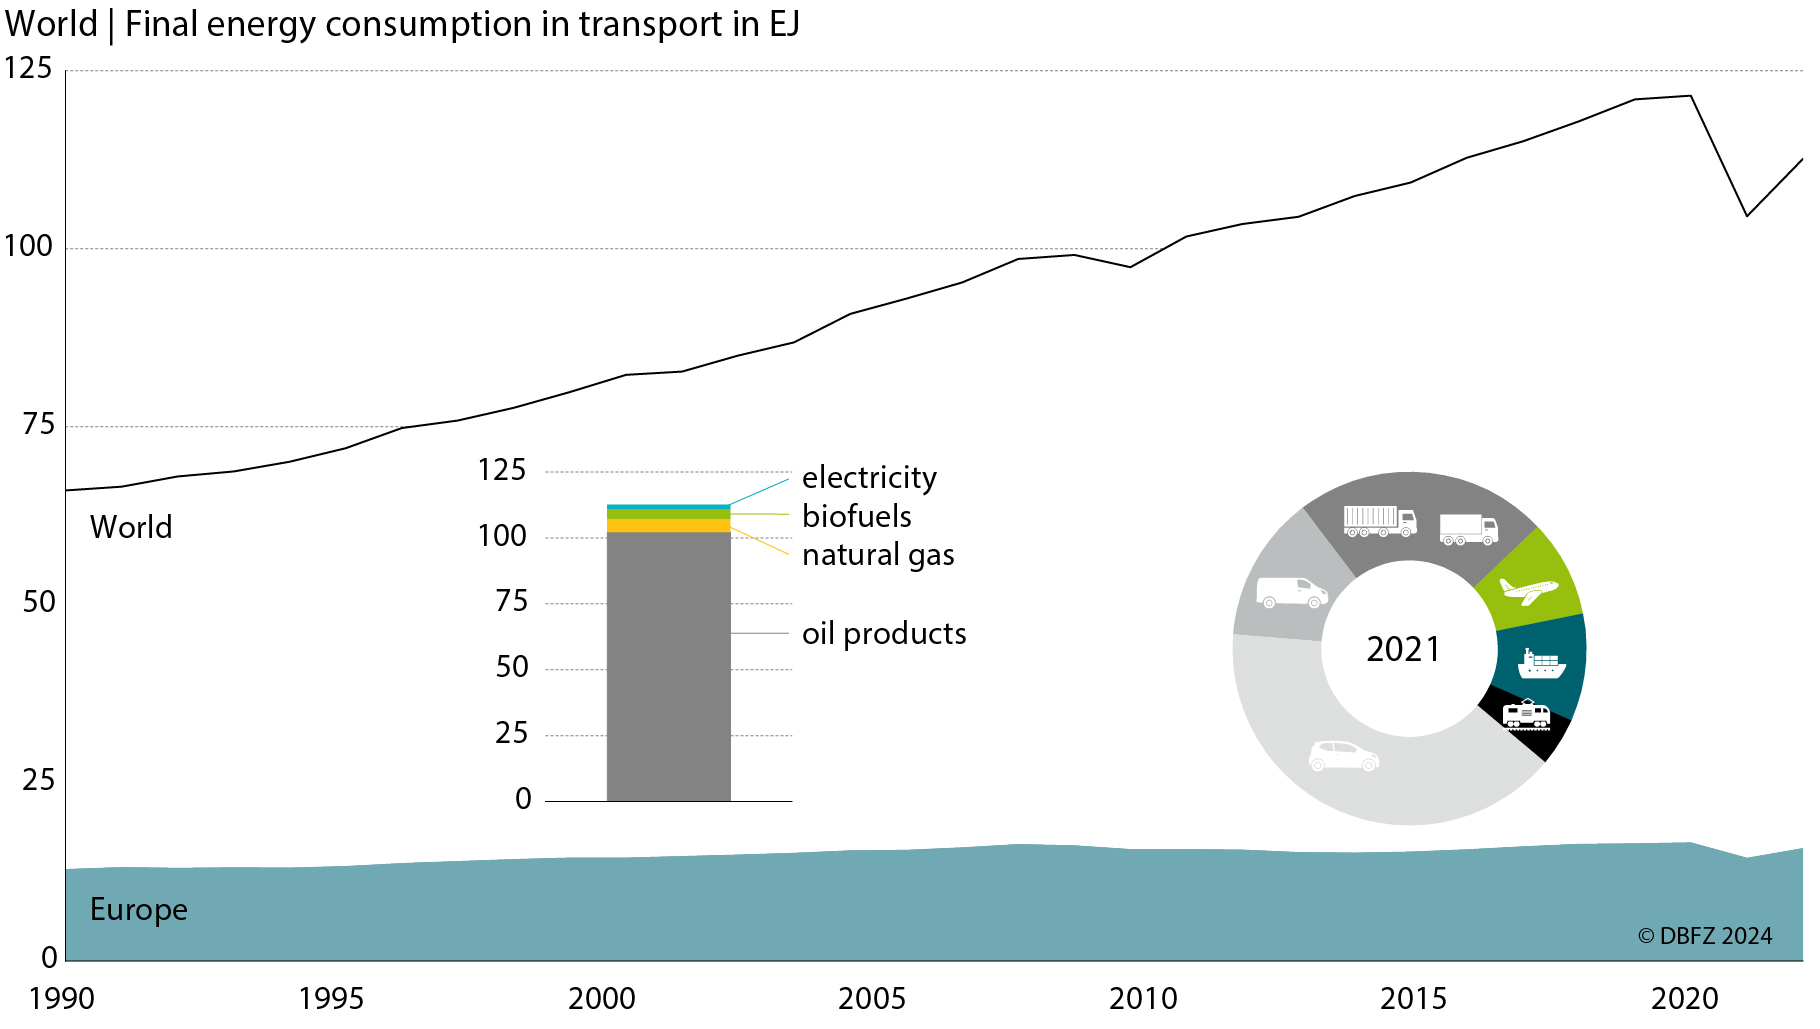
The transport sector faces extreme challenges in meeting current climate change targets. While other sectors have been able to reduce both their greenhouse gas emissions and their final energy consumption since 1990, no quantifiable reductions have yet been achieved in the transport sector. On the contrary, global energy consumption in the transport sector continues to grow strongly. Current trends suggest that energy consumption in 2023 and 2024 will already exceed the previous record year of 2019, the last pre-pandemic year. The share of renewable energy is still very low (< 5%). Greenhouse gas emissions from transport are also on track to reach record levels. The picture is somewhat different in the EU and Germany. Here, final energy consumption has stagnated at an almost constant level in recent years - but also with a very low share of renewable energy.
Recommended citation for the chapter: Schröder, J.; Görsch, K. (2025): Transport and its infrastructure. In: Schröder, J.; Görsch, K. (eds.): Renewable Energies in Transport. Monitoring Report. pp. 22-32. Leipzig: DBFZ. ISBN: 978-3-949807-36-7. DOI: 10.48480/45hp-x131
